Employee Benefits
2026 Benefits State of the Union: High-Cost Drugs and What They Mean for Your Health Plan
According to Mployer Insights’ 2026 analysis of 50,000+ employer health plans, prescription drugs account for over 25% of total benefit expenses, with Tier 4 specialty drugs driving the majority of high-cost claims. While Tier 4 copays average $123 with coinsurance requirements in 31% of plans, individual oncology therapies like Darzalex Faspro ($170,800/yr) and Keytruda ($158,200/yr) frequently exceed average individual stop-loss deductibles ($141,938). To mitigate exposure, self-funded employers are increasingly turning to independent, transparent PBM models and biosimilar substitution—which yields up to a 73% net cost reduction per patient.
August 9, 2026

The Likely Fastest-Growing Line in Your Benefits Budget

Modern medicine has produced remarkable advances. Cancer therapies that were not available five years ago are now extending and saving lives. Treatments for autoimmune diseases, multiple sclerosis, and rare genetic conditions are giving employees and their families real options where few existed before. As an employer, providing access to these treatments through your benefit plan is one of the most meaningful things your organization does for the people who work there.

It also comes with a financial reality that every benefits decision maker needs to understand clearly. Over 25% of total employer health benefit expenses are now driven by prescription drugs, and within that figure, a small number of specialty drugs account for an outsized share of the cost. A single covered employee on an oncology therapy can generate $100,000 to $170,000 or more in annual drug spend. A handful of members on these treatments can represent a larger budget impact than the entire pharmacy spend of the rest of your workforce combined. The goal is not to restrict access to these medications. The goal is to understand how the system works, how costs flow, and how to structure your plan so that both your employees and your organization are best positioned for the long term.

This piece covers how the pharmacy benefit system works, how your plan’s tier structure determines who pays what, how stop-loss insurance interacts with high-cost drug claims, and what employers can do to manage this exposure thoughtfully.
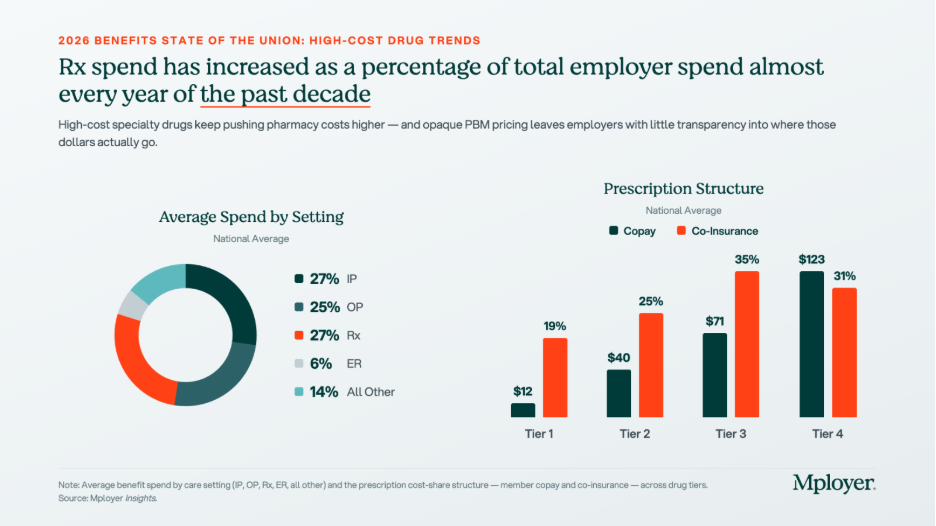
The tier structure in the chart above reflects how plans already account for the cost complexity of specialty drugs. Tier 4, which is where specialty biologics and injectables are typically placed, carries significantly higher cost-sharing than the other tiers: an average employee copay of $123 and coinsurance requirements in 31% of plans. But Tier 4 behaves very differently from the other tiers. On Tier 1, 2, and 3 drugs, cost-sharing is relatively predictable and manageable. On Tier 4, the combination of high drug cost and percentage-based coinsurance can generate out-of-pocket exposure that approaches or exceeds a patient’s annual out-of-pocket maximum in a single month of therapy. How Tier 4 is structured, what controls are in place, and how the plan manages cost is one of the most consequential design decisions an employer makes.

Understanding Your Benefit Plan’s Pharmacy Options

How Pharmacy Benefit Managers Work

Most employer health plans do not manage pharmacy benefits directly. That function is delegated to a Pharmacy Benefit Manager, or PBM, which acts as the intermediary between the health plan, the pharmacy, and the drug manufacturer. The PBM builds and maintains the formulary, negotiates drug prices and rebates with manufacturers, contracts with pharmacy networks, and processes pharmacy claims. The three dominant PBMs, Express Scripts (owned by Cigna), CVS Caremark (owned by CVS Health / Aetna), and OptumRx (owned by UnitedHealth Group), together manage the pharmacy benefits of approximately 80% of covered lives in the United States. Each is affiliated with a major carrier, meaning that employers who use an ASO medical arrangement often default to the carrier’s affiliated PBM without realizing it. Independent PBMs such as Capital Rx, Navitus, and MedOne Pharmacy Benefit Solutions operate on transparent, pass-through pricing models that return all rebates to the plan rather than retaining them as PBM revenue. PBMs are compensated through administrative fees, spread pricing (charging the plan more than the pharmacy receives and keeping the difference), manufacturer rebates in exchange for formulary placement, and specialty pharmacy margin. For any employer managing meaningful specialty drug spend, understanding which of these revenue sources applies to your contract is essential.

How Drug Tiers and Cost-Sharing Work

Every pharmacy benefit plan organizes covered drugs into tiers, with cost-sharing that increases as you move from Tier 1 generics (avg. $12 copay) through Tier 2 preferred brands ($40), Tier 3 non-preferred brands ($71), and into Tier 4 specialty drugs ($123 copay, with coinsurance in 31% of plans). The tier placement of a drug affects both what the employee pays and, indirectly, what the plan pays, since tier placement drives utilization patterns. Plan sponsors have real levers here: step therapy (requiring a patient to try a lower-cost drug first), prior authorization, specialty pharmacy channel mandates, and formulary exclusions all affect Tier 4 cost without eliminating clinical access. These controls require balancing cost management with the reality that for many specialty drugs, no lower-cost alternative achieves the same clinical outcome.

How Stop-Loss Insurance Interacts with High-Cost Drug Claims

For self-funded employers, specialty drug claims are now among the most common triggers for individual stop-loss reimbursement. A single employee on a cancer therapy or rare disease treatment can generate pharmacy claims that exceed the plan’s specific stop-loss deductible, which averages $141,938 nationally for self-insured plans, within a single plan year. The mechanics: the employer pays all claims up to the deductible threshold, and the stop-loss carrier reimburses costs above it. Several dynamics are specific to high-cost drugs. At renewal, stop-loss carriers may laser a known high-cost member by raising their individual deductible or excluding them from coverage. Some carriers now specifically carve out GLP-1 medications or other high-utilization drug categories from stop-loss reimbursement, so employers adding new drug coverage should verify what their contract covers. Specialty drugs can also be administered under either the pharmacy benefit or the medical benefit depending on whether they are self-administered or clinic-administered, and some stop-loss contracts apply different terms to each channel. Employers should model their actual specialty drug cost distribution against their stop-loss deductible at every renewal to understand where the plan’s real exposure sits.

The Costliest Specialty Drugs: What They Treat and What They Cost

The chart below shows the highest-cost specialty and biologic drugs by average cost per patient, ranked from most to least expensive. Cancer therapies dominate the top of the list, but treatments for autoimmune conditions, MS, and inflammatory disease also appear, reflecting how broadly specialty drug spending is distributed across a workforce.
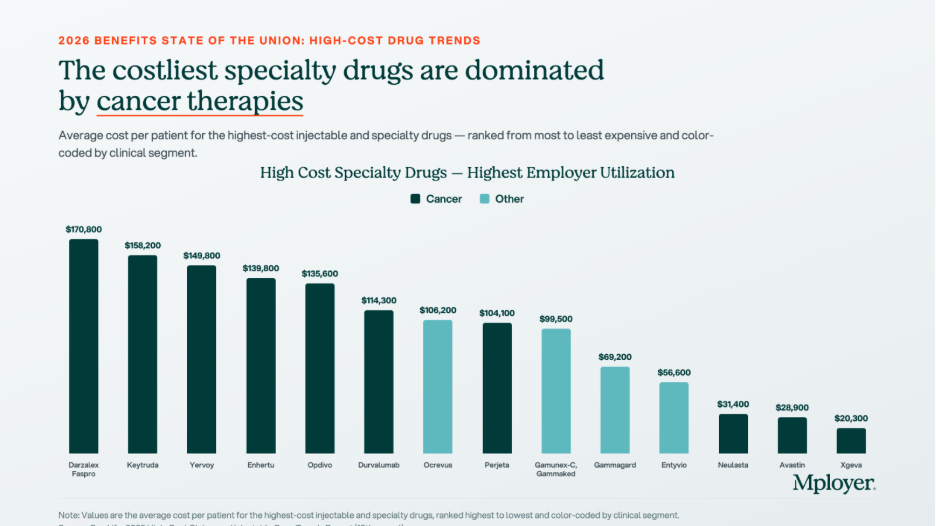
  • Darzalex Faspro (daratumumab/hyaluronidase) | $170,800 avg. annual cost per patient. Janssen (J&J). Multiple myeloma, a blood cancer. The highest-cost drug on the list by average patient cost. The subcutaneous formulation allows home administration, increasing the likelihood it flows through the pharmacy benefit rather than the medical benefit.
  • Keytruda (pembrolizumab) | $158,200 avg. annual cost per patient. Merck. FDA-approved across more than 40 cancer indications including lung, melanoma, head and neck, and bladder cancers. One of the most prescribed oncology drugs globally and one of the most common high-cost pharmacy claims in large employer plans.
  • Yervoy (ipilimumab) | $149,800 avg. annual cost per patient. Bristol-Myers Squibb. Melanoma and in combination with Opdivo for lung and other cancers. Combination Yervoy plus Opdivo therapy is among the highest per-patient drug cost regimens in common use.
  • Enhertu (trastuzumab deruxtecan) | $139,800 avg. annual cost per patient. AstraZeneca / Daiichi Sankyo. HER2-positive and HER2-low breast and gastric cancers. A significant recent clinical advance for patients with cancers that previously had limited options after first-line treatment.
  • Opdivo (nivolumab) | $135,600 avg. annual cost per patient. Bristol-Myers Squibb. Melanoma, lung, kidney, bladder, and other cancers. Frequently used in combination with Yervoy, compounding cost significantly when both are prescribed together.
  • Ocrevus (ocrelizumab) | $106,200 avg. annual cost per patient. Genentech. Relapsing and primary progressive multiple sclerosis. MS therapies are a persistent specialty drug cost driver because patients remain on therapy for years, making each diagnosed member a multi-year plan cost.
  • Entyvio (vedolizumab) | $56,600 avg. annual cost per patient. Takeda. Moderate-to-severe Crohn’s disease and ulcerative colitis. Inflammatory bowel disease therapies are among the most common specialty drug claims in employer plans because the conditions are prevalent in working-age adults.

Biosimilars: The Cost Opportunity Most Employers Are Not Fully Using

A biosimilar is a biologic drug that is highly similar to an already-approved reference biologic, with no clinically meaningful differences in safety, purity, or potency. Biosimilars are not generic drugs in the traditional sense, because biologic drugs are complex proteins manufactured from living cells and cannot be chemically replicated exactly. But they go through an FDA approval pathway that confirms their clinical equivalence to the reference product, and they cost significantly less. The biosimilar market has expanded rapidly as major biologic patents have expired. Humira, the world’s best-selling drug for much of the past decade, now has multiple biosimilar competitors in the U.S. Stelara has followed. The oncology biosimilar pipeline is maturing, with more approvals expected in the next two to three years.
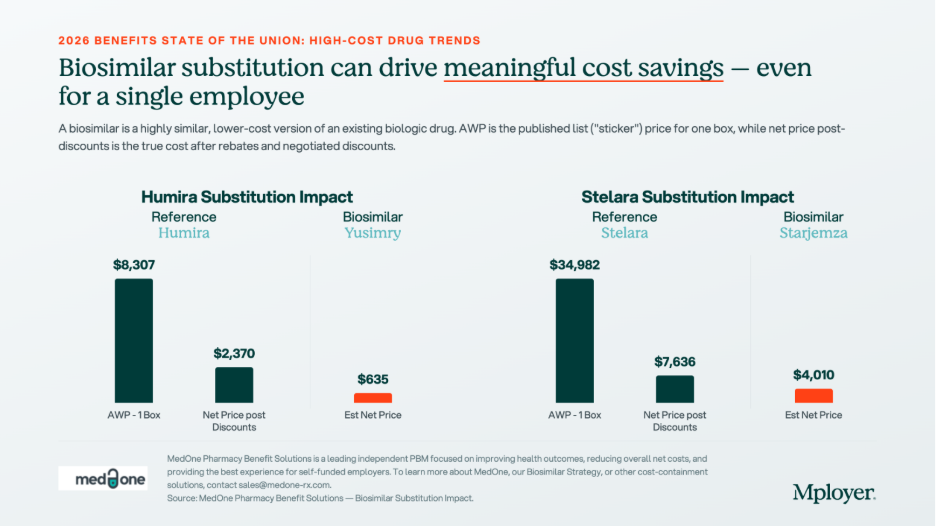
The chart above shows what biosimilar substitution looks like in dollar terms. For Humira, the net price after rebates and negotiated discounts is $2,370 per box. The biosimilar Yusimry has an estimated net price of $635, a 73% reduction. For Stelara, the reference drug net price is $7,636 per box. The biosimilar Starjemza has an estimated net price of $4,010, a 47% reduction. For an employee on monthly Humira therapy, the difference between the reference drug and the biosimilar is approximately $21,000 per year in net plan cost. For a Stelara patient, the annual difference is approximately $43,500. Across even a small number of members on these therapies, biosimilar substitution is one of the highest-return cost management interventions available.

Plan sponsors have four main tools to drive biosimilar adoption: preferred formulary placement (putting the biosimilar on a lower tier and the reference drug on a higher tier), step therapy for new patients, automatic substitution where state law permits, and formulary exclusion of the reference drug entirely. The most important variable in any biosimilar strategy is whether your PBM has a financial incentive to keep the reference drug preferred. A PBM earning a large rebate on Humira has a direct financial reason to keep Humira on the preferred formulary, even when the biosimilar costs the plan less on a net basis. Independent PBMs operating on pass-through pricing remove this conflict entirely, because all rebates return to the plan and formulary decisions are made without a competing financial interest.

What Employers Should Be Asking About Their Pharmacy Benefit

High-cost drug management requires active decisions about PBM contract structure, formulary design, specialty pharmacy strategy, and stop-loss alignment. The questions worth asking at every renewal:

  • Is your PBM contract pass-through or spread-based? A pass-through model means you pay exactly what the pharmacy receives and all rebates come back to the plan. A spread-based model means the PBM earns revenue that is not visible in the administrative fee. Request full compensation disclosure under the CAA requirements.
  • Are you receiving all available biosimilar savings? Ask your PBM for a net cost comparison of each reference drug plus rebate against the available biosimilar net price. The answer will tell you whether your formulary is designed around the plan’s cost interest or the PBM’s rebate interest.
  • What is your specialty drug channel strategy? Are specialty prescriptions being filled through your PBM’s affiliated specialty pharmacy? Carving specialty to an independent pharmacy or using a white-bagging program for clinic-administered drugs can generate meaningful cost differences.
  • How does your stop-loss deductible interact with your specialty drug exposure? Model your actual specialty drug claims against your stop-loss threshold. If most of your high-cost drug claims fall below the deductible, the plan is absorbing those costs without triggering reimbursement.
  • Does your formulary have appropriate Tier 4 controls? Step therapy, prior authorization, and quantity limits on specialty drugs reduce cost without eliminating clinical access. Without these controls, high-cost therapies can be approved and dispensed without any plan-level review of whether a lower-cost alternative exists.

Know How Your Pharmacy Benefit Compares

Pharmacy is now one of the two or three most consequential cost management decisions in health plan design. The employers managing it well are not restricting access to the medications their employees need. They are ensuring that the structure of the benefit, the PBM contract, the formulary design, and the stop-loss coverage work together in the plan’s interest, and that every dollar spent on high-cost drugs is spent as efficiently as possible.

Mployer’s benefits rating evaluates pharmacy benefit design as part of the Medical pillar score, benchmarked against a custom cohort matched by size, region, and industry. Knowing where your pharmacy benefit stands relative to employers who actually look like you is the starting point for making better decisions.

See how your benefits package compares to your custom cohort at MployerAdvisor.com.

Sources

Mployer Insights: Average Spend by Setting, Prescription Structure, and High-Cost Specialty Drugs. Source: Mployer Insights analysis.

MedOne Pharmacy Benefit Solutions: Biosimilar substitution impact data for Humira/Yusimry and Stelara/Starjemza. MedOne is a leading independent PBM focused on improving health outcomes and reducing net costs for self-funded employers. [email protected].

Mployer 2025 and 2026 Employee Benefit Plan Design Study, covering 50,000+ employer plans. Individual stop-loss avg $141,938 self-insured.

Consolidated Appropriations Act of 2021, Section 202: broker/consultant compensation disclosure requirements for group health plans.

FDA Biosimilar approval framework: 42 U.S.C. Section 262(k).

Insurance Brokers
How to Retain Your Key Employees During the Mergers and Acquisitions Process
The article provides tips on how to retain key employees during a merger or acquisition process, including keeping communication open and honest, providing incentives, and creating a culture of inclusion and support. It suggests that a successful retention strategy can help organizations to maintain their talent, culture, and productivity throughout the transition.
Author:
Abbey Dean
January 4, 2023

Editor's Note: This piece has been republished with the permission of The Horton Group.

During a merger or acquisition, employees may understandably feel wary about the security of their jobs, changes in management style, and cultural differences between the two merged companies. If business owners do not keep these factors in mind while preparing for the transaction and continue to neglect them during the entire process, employee productivity and morale could decrease drastically.Mismanaging talent can adversely affect a mergers and acquisition (M&A) transaction, which is why you should implement a strong talent strategy before the transaction has closed. Here are some effective ways to retain your best employees during the mergers and acquisitions process.

Evaluate Your Benefits and Offer the Best Options

Many traditional retention strategies involve pay incentives, such as stay-or performance-based bonuses. However, firms are also looking for additional levers that can help bolster their retention strategy.For example, executive medical reimbursement offers programs that allow companies to reimburse their key employees tax-free for out-of-pocket medical expenses for themselves and family, which would not otherwise be covered by their base health insurance plan.Additional options include but are not limited to:

It may be a good opportunity to reevaluate your company’s benefits package. Creative benefits are an opportunity to show candidates how you can help them inside and outside the workplace. Do you offer flexible work schedules? Are there options for childcare? Are you able to offer remote working options? All of these are topics to consider.

Remain Transparent With Employees During the Mergers and Acquisitions Process

It is important to keep employees’ needs in mind during the transaction and to update them frequently on the status of the merger or acquisition. If a certain change being implemented is going to be altered, let them know. If a timeline is going to run longer than projected, inform everyone. Keeping your employees in the loop will make them feel involved and trusted as a valuable part of the company. This also means you must be very transparent about positions that will be opening up or others that will be eliminated. It would be helpful if this information were decided and relayed before the actual merger begins, but sometimes decisions are unforeseen or must made along the way. These should be handled with tact and honesty.

Additionally, if employees are taking on extra work during the merger or have moved to a position that drastically alters their current roles and duties, ensure they are compensated fairly for the change. If employees must take on extra tasks and their increased efforts are not recognized, it could cause resentment.

It is also important to set aside time to reward and recognize employees for successfully handling changes, adapting quickly to new methods or processes, and managing new roles or duties well. Employee recognition is a great way to keep everyone encouraged and moving forward.

Stay positive and keep employees motivated when working through the merger or acquisition. There may be changes in the plan that are not ideal for your company or employees but are necessary to facilitate the merger. You should encourage employees along the way and keep reminding them of the end goal.

Don't Forget to Check in With Employees After the Merger

After the merger is complete, your most important focus will be training employees on changes to policies, processes and new systems or programs. Coordinate small group training where employees can work hands-on and receive guidance regarding any changes in workflows and processes.Employees may feel more comfortable asking questions in a smaller group setting. Any employees who need assistance above and beyond the scope of normal training can be helped on the spot. It’s also a good idea to set benchmarks to measure where you want employees to be with the training and by when. Setting goals will help employees who are struggling with or resisting the changes to stay on track.

Make sure new management is open and honest with employees after the merger–in return, employees will feel more comfortable being open and honest with management. Fostering these relationships and keeping them positive is imperative. Consider setting time aside for old and new employees to get to know each other outside of the office or during the day away from work responsibilities for a period of time—this could accelerate the time it takes for everyone to feel more comfortable around each other.A successful merger or acquisition requires planning beyond contracts and finances—business owners must remember to address the needs of their most important resource: employees. Looking for more exclusive content? Check out what's trending on the Mployer Advisor blog, and be sure to check out the Season 1 finale of Mployer Advisor's podcast "This Week in Benefits."

Health Insurance Trends
What is Accident Insurance?
The article defines accident insurance as a type of insurance policy that provides financial protection to an individual in the event of an accident or injury. It also outlines the types of coverage typically offered by accident insurance policies, such as medical expenses, disability benefits, and accidental death and dismemberment benefits.
December 19, 2022

Accident insurance is a voluntary benefit that many employers offer their employees to help provide financial support in the event that they or a member of their family are accidentally injured.Also called voluntary accident insurance, this type of insurance is paid out directly to the policyholder in lump sums, the amount of which is determined by a schedule outlined in the policy based on the type and severity of the injury.

For example, a sprained ankle or tendon injury will pay out at a lower set rate than a broken limb, which in turn will pay out at a lower set rate than a dismembered limb, and so on.

Those lump sums will also include pre-determined payouts for certain medical expenses incurred as a result of the injury.

Accident insurance payouts can cover expenses including, for example, diagnostics, therapies, ambulance transportation, emergency room visits, and hospital stays.

Because these claims are paid in lump sums directly to the policyholder, however, the money can be put to use wherever the policyholder believes it is most needed, whether that be contributing toward co-pays and deductibles, buying groceries, taking a vacation, or purchasing a new video game console to stay occupied while laid up and recovering for a few weeks.

Accident Insurance vs. Workers’ Compensation

Accident Insurance is not a substitute for workers’ compensation insurance, which is legally mandated for businesses who have more than a few employees in most industries.

Even in cases when workers’ compensation is in place to cover on-the-job injuries, accident insurance is often offered on an opt-in basis. In such cases, accident insurance will often pay out on claims much more quickly than workers’ comp.

As a result, voluntary accident insurance can provide stop-gap financial relief to policyholders who are injured on the job well before workers’ compensation pays out on a claim.

Furthermore, the accident insurance being discussed in this post should not be confused with occupational accident insurance, which is a type of commercial insurance typically used by small companies that do not meet the minimum requirements for legally mandated workers’ compensation coverage. These companies have the option to choose occupational accident insurance instead.

Benefits of Accident Insurance

In addition to recruitment advantages, loyalty, and the increased efficiency that robust benefits packages can create among existing employees, there are a number of additional reasons that many employers offer voluntary accident insurance as an opt-in benefit.

  • Cheap Premiums: The premiums for accident insurance are a great value relative to the coverage and peace of mind they can provide. Depending on the size of the payout schedules, there are policies available with $10 premiums per month or less for an individual (and only slightly more for family coverage). Further, these policies can be offered at no expense to the employer since premiums are paid entirely out of pocket by the employees, who in turn benefit from the group coverage rate.
  • Broad Scope of Coverage: Accident insurance policies tend to cover a fairly broad range of accident-related injuries, from minor wounds and pulled muscles to severe burns, lost limbs, and accident-induced comas. Because any of these injuries can potentially lead to time away from work, stress, and/or medical bills that may in turn lead to reduced on-the-job performance, offering accident insurance can help employees return to work at maximum productivity levels as quickly as possible. And because accident insurance can cover a policyholder’s entire family, that peace of mind extends beyond injuries that occur to the employee and policyholder in question.
  • Lump Sum Payments: Because the injuries and medical services that are covered are clearly defined in the policy, and because payments are made in lump sums that are paid directly to the policyholder, accident insurance tends to pay out claims more quickly than many other forms of insurance. As a result, policyholders are able to direct those resources when they are needed the most to where they are needed the most. This hastens their ability to manage the injury and reduces periods of diminished activity and productivity.
  • Health and Safety Incentives: In addition to providing the benefits already described in the unfortunate event of accidental injury, many accident insurance policies also have the added perk of incentivizing safe behavior and rewarding policyholders who manage to avoid accidental injuries. Many accidental insurance providers will pay out cash payments for policyholders who avoid filing for claimable injuries over a certain period of time, while other providers will increase the maximum payout per injury on an annual basis when no claims were filed. Some providers will create a “rainy day” fund to enable lump sum payouts even when a policyholder has exceeded the ‘repeat injury’ threshold outlined in their policy for a given injury. These kinds of health and safety incentives may not only somewhat decrease the likelihood of productivity-sapping accidents, but they also can increase the benefits that policyholders can expect when accidents inevitably do happen, which can further limit the negative impact that the accident has.

What’s the Difference Between a “Good” and “Bad” Accident Insurance Policy?

As with most types of insurance, a good accident insurance policy is one that is well-tailored to the policyholder’s needs, keeping risk at manageable levels without purchasing so much coverage that the premiums break the bank.

Maybe even more important, however, is that a good policy is one that is part of a well-rounded insurance portfolio - because no one single type of policy could provide optimized coverage and effectively manage the risk of adverse events on its own. To that point, with regard to accident insurance policies, these policies are often found working in conjunction with critical illness insurance policies, especially when the overall portfolio includes high-deductible traditional health insurance, for example.

When evaluating and comparing potential accident insurance policies, one thing you’ll want to consider is the breadth of each policy’s coverage. While accident insurance typically covers a pretty broad range of injuries in general, some policies may cover 50 different injuries while others may cover 100. Before signing up for any accidental insurance policy, it’s best to determine not only the number of injuries covered but also the type of injuries, to make sure your policy has a coverage range that sufficiently protects against any injuries that may be especially common in your line of business.

After considering how a particular accident insurance policy may fit within your current insurance portfolio and making sure the scope of coverage was closely hewn to your needs, the deciding factor about what makes a good policy will likely be tied to your specific company.

For instance, if you determine that the cost of premiums will be among the biggest inhibiting factors that might keep your employees from considering accident insurance, then consider letting premium price be determinative and choose a policy that keeps those costs down.

On the other hand, maybe your employees would be more responsive to a plan that doubles the claim payout amount if a policyholder’s child gets injured playing sports. Or maybe they would most appreciate a policy that rewards injury avoidance with big safety bonuses.

All of these options are possible and can significantly shape employees’ perception of your company’s insurance offerings as a whole.

The best way to ensure that your accident insurance policy is a good one that works well within the framework of your existing insurance offerings and is ideally suited to the needs of your employees is to speak with your business insurance broker and find out how accident insurance could potentially help fill some gaps in your coverage.

Top 5 Questions to Ask a Broker About Accident Insurance

  • What is the scope of injuries that are covered, how much is paid out for each, and how does the severity of a given injury factor into the equation?
  • What other additional benefits, safety incentives, rainy day funds, bonuses, and other features can be included to further benefit and encourage buy-in from employees, and which features best suit employee needs?
  • How does an accident insurance policy overlap with, conflict with, or complement my existing insurance portfolio and could my insurance portfolio be amended, revised, or supplemented to better achieve my company’s goals in some other way that doesn’t involve the addition of accident insurance to that portfolio?
  • What is the cost of the premium payments relative to the maximum payouts for each injury on the policy schedule?
  • What is the process for filing claims and how quickly are those claims typically paid out?

How to Find an Accident Insurance Broker

To find a broker in your area with expertise in accident insurance for your industry, search Mployer Advisor. Read real reviews, see independent ratings, and compare top-rated brokers to find the best fit for your business.Find Top-Rated Brokers

About Mployer Advisor

At Mployer Advisor, our focus is creating transparency in the insurance and insurance broker, consultant and advisor space to the advantage of the employer. Analytics is our core and we will bring to light new information, tools and resources to aid employers in making more cost-effective decisions. As a phase I, we are here to help employers find the right broker or consultant and the right insurance company for them. Giving choice and initial transparency is a first step in creating an employer centric insurance marketplace.

Employee Benefits
Employee Benefits Benchmarking State of the Union
The article provides an overview of the current state of employee benefits in the United States through the lens of benchmarking. It examines trends in benefit offerings and usage, as well as the impact of the COVID-19 pandemic on employer-sponsored benefits.
December 19, 2022

The Current State of Employee Benefits Benchmarking Reports

The ability to attract and retain top quality talent has increasingly become a major priority among employers operating in an increasingly competitive labor market, and few tools have proven more effective at properly incentivizing current and prospective employees than robust benefits packages which can set a company apart from the competition.

When redesigning and attempting to improve benefits offerings, however, many companies tend to focus their attention almost exclusively on medical benefits, which is understandable given that medical benefits are the largest benefits-related cost component from an employer standpoint.

What many employers fail to recognize, however, is that employees rank financial benefits like 401k contributions and incentives nearly as high as medical benefits in terms of how attractive those kind of benefits package components are from an employee perspective.

In order to create a truly employee-centric offering that is optimized to attract the ideal candidates from the labor pool, a company must evaluate all the potential components of a benefits package, including:

  • Medical (health, dental, vision, FSA, retiree benefits)
  • Short & Long Term Disability
  • Life insurance
  • Leave benefits (sick, vacation, holiday, and various other leave like jury duty, un-paid leave), etc.

Of course, no benefits package regardless of its components can be fairly evaluated in a vacuum. In order to understand how best to craft the optimal benefits package for a given company, that benefits package must be compared with the benefits packages being offered by other similarly situated companies who are competing to attract the same talent.

This is where employee benefits benchmarking reports comes into play and have become an essential process for competitive companies to undertake.

What Is Benchmarking and How Is it Done?

Benchmarking in its simplest form is the exercise of comparing one company to another. In our case, we’re interested in comparing the benefits packages offered to employees by different employers, but the principle is the same whether comparing companies’ products and services or informal perks.

The key input that makes benchmarking possible is comp. data. Of course, any given company should have up-to-date information about its own benefits packages readily available, but gathering comparable information about the business and practices of competitors is typically a much more difficult task.

Further, not only can it be difficult to gather data in general, but it can be especially tricky to gather relevant data, that is, data from companies that are in the same industry and of a similar size. Even factors like geography can have significant impacts on benchmarking data, so it is extremely important that the data being used is well-tailored to the company/industry/location in question in order for the benchmarking comparison to provide meaningful, actionable results.

It’s also very important that the data is unbiased, which can be sometimes be difficult to determine given the often-misaligned financial incentives of data collectors and providers, which reinforces that properly assessing the source and quality of the data is a critical step in the benchmarking process.

What Benefit Benchmarking Resources Are Available Today?

There is no shortage of benefit benchmarking data available, which can be both a good and a bad thing. Having a lot of data available is great in the sense that there is a wealth of information from which valuable insights can be gleaned, but one of the reasons that there is so much data in the first place is because it is being supplied by a huge number of sources with inconsistent reporting, methodology, motivations & target audiences, differing definitions, data sources, samples & time frames, etc.

With that caveat in mind, for Small Business Benefit Benchmarking data, Zenefits produces a great survey focused on health benefits that is excellent for understanding small business trends in medical and plan design. It should be noted, however, that Zenefits is an insurance broker, which is primarily how they monetize their platform, and the sample set in the data is Zenefits own users who may or may not share similar characteristics with your company.

For information about Insurance Broker Benchmarking, Mercer Data is a great resource targeting companies that employ 500+ employees and encompassing in depth plan design, planning, discussion and consulting.For Payer Benchmarking, it is typically larger carriers who produce segment specific reports. Alfac and Cigna have historically put out great voluntary and health information respectively, for example. Because that information is siloed and apart from any comparable data covering other benefits package components, however, it is difficult to use this data to draw conclusions and take actions in a cohesive way across a full benefit plan design and offering.

There is also a fair amount of Benchmarking Data from Enrollment Firms, which is typically pulled directly from the firms’ clientele and their plan choices. The quality and applicability of this data can vary widely from firm to firm, any one of which may specialize in certain types of companies or industries and/or may exclusively operate in one or more geographic areas with particular characteristics.

Problems in the Current State of Benefits Benchmarking

As alluded in the paragraphs above and through much of our exploration of the available benchmarking data resources generally, sourcing relevant and unbiased information were two of the main challenges to effective benchmarking that we continually encountered over and over again.

In terms of bias, it is important to be aware at the outset of the process that nearly all benchmarking information today is provided by someone with a financial interest in your company choosing one plan over another.

To be clear, this isn’t to say that the data has been manipulated or framed to be deliberately misleading, but strong financial incentives can have practical effects even if they aren’t being actively considered or even acknowledged. This situation is not unlike a scorekeeper for a basketball game also playing for the opposing team. The arrangement itself is not evidence of any wrongdoing or malicious intent, but it certainly should raise questions and it serves to highlight the fact that there is no independent resource to fill this needed role.

Beyond bias, there are also issues involving the relevancy of benchmarking data, which typically involve data that is incomplete, over-broad, and/or non-actionable:

  • Incomplete data is a dataset that lacks information necessary to convey a whole and complete picture. For an example from the employee-benefits space, none of the resources for benchmarking data that are publicly available provide an end-to-end analysis of all major package components covering medical, disability, life, leave and retirement – all of which can greatly impact the decision-making of current and prospective employees.
  • Over-broad data is information that lacks a level of specificity that would enable the drawing of direct comparisons between the collected data and the unique circumstances of an individual company. Most publicly available benefits benchmarking data is generic and rolled up across industries, location, and company size, but for data and the conclusions drawn from it to be meaningful, the analysis must be micro-targeted and customized to align with the attributes of your particular business.
  • Non-actionable data covers any data that is incapable of providing a solid analytical foundation that could support any particular decision or course of action as a result. Non-actionable data as a category includes a lot of both incomplete and overbroad data sets while also covering information that may be made up of valid survey results, for example, but an assessment of that information alone could not fairly be used as justification for making one choice over another.

The Biggest Problem With the Current State of Benefits Benchmarking

It’s also very important that companies recognize that while the technical, data-based issues of relevancy and bias are certainly considerable hurdles to overcome when evaluating benefit offerings, the far greater issue that most companies face is less a technical problem than a problem of perception and communication.

After all, even the best imaginable benchmarking dataset is of little value in terms of attracting and retaining quality employees if an employer is unable to effectively communicate the value of their benefit offerings in a way that is compelling to the specific prospective or current employees in question.

Consider this example provided by a fellow MployerAdvisor staff member:

I have a great friend whose company covers 100% of medical for all employees. She is evaluating taking a job with a 12% raise but has to pay for medical. At the end of the day, is that a pay raise? She doesn’t value the benefits being offered to her, but it’s not her fault. Her company is not able to communicate to her the value of the benefits and much less how that compares to the market.

In the example above, the employer does all the hard work and is offering a significant benefit but has failed to communicate the value they are providing and therefore the positive impact of that work in terms of employee retention is lost altogether.

It should also be noted that employees’ expectations and their impression of any given benefits package component can be significantly influenced not only by the information being provided (or not) by the employer but also information from outside sources can have a major impact as well. In a sense, employees sometimes undertake their own approximated benchmarking effort through social circles and their industry network, though the limited sample regularly leads to a skewed perception of where their benefits package may actually fall on the market spectrum.

Regardless of the reasons why employees may not fully appreciate the value of some benefits offerings, the most important takeaway is that in order for benefits packages to have their intended effect in terms of talent attraction and retention, those benefits must not only provide real value to current and prospective employees but that value must also be effectively conveyed so that it can be internalized and comprehended by the recipients on a practical level.

Benchmarking With Mployer Advisor

Given our encounters with the shortcomings of publicly available benefits benchmarking data, and given our data processing capabilities and our uniquely independent positioning in the industry, Mployer Advisor recognized that we have the opportunity to address the bias, relevancy, and communication issues hampering the industry by launching our own, independent benchmarking platform and accompanying resources.

Mployer Advisor was founded to address inefficiencies in the insurance and brokerage marketplace and to support both employers and advisors with better information leading to better outcomes for everyone involved. Because our company generates revenue exclusively through advertising on our platform, which is an opportunity we offer exclusively to highly-rated insurance advisors, there are no concerns about any conflicts of interest in our data.

And relevancy is no issue since our benchmarking information is tailored for you down to the company size, geography and industry, and your custom snapshot is updated annually with information pulled from the largest benefit design database in the US processed through industry-first statistical modeling to provide the most granular, micro-targeted assessment the industry has ever had access to.

As with everything we do at Mployer Advisor, our goal in offering benchmarking and analytics information is simply to improve the employee benefit and insurance industries. We believe that better information and greater transparency lead to increased efficiency which leads to improved performance and more business.Click here to download your customized benchmark report.


Insurance Brokers
What Analytics Should I Expect From My Insurance Broker?
Insurance Broker & Carrier Analytics Access Introduction.
December 19, 2022

Insurance Broker & Carrier Analytics Access Introduction

The type, depth, and breadth of analytics that clients can expect to receive back from their insurance broker and insurance provider (in addition rate adjustments explanations, etc.) depends largely on the size of the client’s company, whether the client is fully insured or partially self-insured, the policies of the involved provider, and market trends. Depending on your relationship and structure, this can be frustrating for a number of senior executives.

Analytics clearly play a crucial role in the insurance business, from actuarial tables to market trends that can lead to rate adjustments for existing policies, but what analytics can you as a client reasonably expect to be made available to you?

As with most aspects of commercial insurance and even individual insurance, the answer to this question largely depends on a number of factors that can yield greatly varying results.

How Are Analytics Used and Why Are They Important?

In the insurance industry, analytics play a role of utmost importance in determining how rates are set and how they are adjusted over time as more information is gathered about the insurance needs and usage or individual companies, as well as developing trends of the markets as a whole.

One of the most significant and beneficial functions of a good insurance broker is using the available data and analytics in annual negotiations with the insurance carrier in order to keep rates increases lower (or bring them down) for you, the client.

  • For example, it’s common in a given year for a company to exceed the expected claims requests, at which point the carrier will typically increase the insurance rates to incorporate the new data showing that the previous year’s projections were too low. A good insurance broker, however, may be able to show that the cause of the increased claims were non-recurring events that do not need to be factored into long-term rate increases and thereby negotiate the rate increases down, if not eliminating them all together.
  • Similarly, if a broker sees rate increases coming down the pipeline from the carrier, he may be able to identify a specific cause that can be remedied with an adjustment in the policy terms instead of an adjustment through rate increases. For example, if the cause of the proposed rate increase is what appears to be a trend of emergency room visit abuse among the employee population that is driving up costs, the broker may be able to propose policy revisions that include a higher deductible or copay for such visits which can help curb the abusive behavior, thereby removing the need for a rate increase across the board.

Primary Factors That Determine Client Access to Analytics

There are 3 main factors that will determine whether or not you, as a client, will be privy to the analytics that are used to set and adjust your insurance rates, and what level of access you may be able to reasonably expect.

Additionally, it’s important to be aware of the distinction between the raw numbers upon which the analytics are based vs. the process through which those analytics are computed, both of which may allow for different levels of access.

  • Company Size: Possibly the main factor that will influence whether or not clients are able to access the data and analytics underlying their insurance policy rates and adjustments is the size of the client company itself. Companies with over 1,000 employees, for example, have a significantly greater likelihood of having access to such data. At first glance, this may seem merely a result of the power dynamic at play with larger companies holding more influence when requesting that data, but the greater effect of a large employee population is adding statistical significance to the data analytics that can’t be established among smaller employee populations.
  • If your company has fewer than 100 or 200 employees, expect little to no data sharing whatsoever, primarily for the above stated reason that there is limited mathematical significance to the data for such a small employee pool. In such cases, carriers make rate and adjustment calculations based largely on market trends or what’s known as ‘blended credibility,’ which is a combination of market trends and credibility tables (a type of actuarial table created based on your company’s specific data).
  • Proprietary Analytical Methods: Whereas employee population size is a relevant factor because of math, the proprietary nature (or lack thereof) for any given broker and insurance carrier is of course imposed by the insurers on their own behalf. Such limitations on access to information is usually justified in order to protect trade secrets and other information that the insurance company believes is necessary to keep private in order to maintain a competitive advantage in the marketplace or for other strategic reasons. If access to this kind of data and analytical processing is important to your company, the presence or absence of such proprietary limitations is something that should be addressed as early as possible in the process of vetting new insurance brokers and insurance carriers.
  • Fully Insured vs. Wholly or Partially Self-Insured: The breadth of involvement your company has with a single insurance broker or carrier can also be a relevant factor as to whether or not your company will be able to access data and analytics. At the risk of overstating the obvious, the more data that a given broker or carrier is able to collect on your company, the more likely they will be to be able to provide statistically significant feedback on that data, which in turn makes that data more likely to be shared than data from pools that are too small to be independently valuable. For example, even if a company has more than 1,000 employees – if that company is self-insured and/or only seeks outside catastrophic insurance from a traditional carrier, then that carrier is unlikely to be able to collect enough data to properly analyze that data on a per-company level. Therefore, the carrier is less likely to be able to share that data with the company. Of course, in cases of self-insurance, the company in question already has access to their own data, making the issue moot.

Client Insurance Analytics and Data Access Conclusion

As with almost all aspects of acquiring or changing commercial insurance, the best time to address issues of analytics and data sharing is as early as possible in the process of vetting potential carriers and business insurance brokers.

Whether or not you will be able to access the data relevant to your company and the methods by which that data will be used to set and adjust your rates (and whether or not such access is important to you) are decisions that need to be made on a case-by-case basis. These decisions are typically made in conjunction with a trusted advisor or broker who can take into account the specific needs of your company.

For help finding such a broker, advisor or employee benefits consultant to assist in evaluating your company’s needs, search Mployer Advisor. Our database shows ratings, areas of expertise, employer reviews and more, making it easy for you to search for and compare top-rated brokers in your area.

Mployer Advisor's goal is to add transparency to the insurance brokerage industry and highlight top performers to ultimately benefit you, the employer, and your employees.Search Top-Rated Brokers Near You

About Mployer Advisor

At Mployer Advisor, our focus is creating transparency in the insurance and insurance broker, consultant and advisor space to the advantage of the employer. Analytics is our core and we will bring to light new information, tools and resources to aid employers in making more cost-effective decisions. As a phase I, we are here to help employers find the right broker or consultant and the right insurance company for them. Giving choice and initial transparency is a first step in creating an employer centric insurance marketplace.

HR Compliance
Human Resources vs. Human Capital – and Why It Matters
One of the most common misconceptions among modern business organizations is that human resources and human capital are the same thing.
Author:
Abbey Dean
December 19, 2022

Human Resources vs. Human Capital

One of the most common misconceptions among modern business organizations is that human resources and human capital are the same thing. Some organizations historically have used the terms interchangeably, and there remains a great deal of overlap between them. However, the modern understanding of these terms as distinct concepts is more than a vocabulary lesson; it is critical to the optimization of both.

How Are They Similar & How Are They Different?

The broadest area of overlap between human resources and human capital, as the nomenclature suggests, is that they are primarily concerned with the people who make up an organization. But while human resources involves the employees themselves and their role within the hierarchy of the organization, human capital management is about the intangible assets that each employee brings to their role in the organization.

To put it another way, for any goal that an organization may hope to accomplish, human resources covers the ‘who’ in terms of who will be responsible for defining, delegating, executing and accomplishing that goal. Human capital covers the ‘how’ in terms of the tools, such as creativity, problem-solving, experience, network and authority, that each human resource within the organizational hierarchy will put to use toward seeing the organizational goal achieved.

Another feature that human resources and human capital management share is a difficulty being precisely quantified. While somewhat rudimentary if not crude as a metric, human resources can at least be measured on the balance sheet in the form of salaries and benefits.

Human capital, on the other hand, is even more difficult to represent in figures – though theoretically at least, that human capital should be equally represented in the same salaries and benefits earned by the human resources that embody that human capital.

Why Does It Matter?

This is where the distinction between human resources and human capital management becomes significant. It is standard practice within most organizations to associate salary and benefits directly with the concept of human resources. This is because the core salary and benefits package is perceived as being baselined by the title or position within the organizational hierarchy, and then adjusted according to the skills, experience, value and advantages (or lack thereof) brought to the role by the individual employee hired to fill that position.

In other words, salary and benefits are conceptually understood as primarily a function of the titled position within the organizational structure, which then potentially can be modified up or down depending on other factors including the perceived human capital that a prospective hire might bring to their new position.

What is a PEO and Is It Right for My Company?

Can Human Resources and Human Capital Be Quantified?

It should be noted that this perception of human resources as an independent variable with human capital as subordinate is entirely rational given that human capital is so difficult to identify and measure – even more so in the interview and acquisition process. Certainly, abstract human capital assets like talents, good business practices and habits, and creative problem-solving skills are incredibly difficult to value in advance of a thorough on-the-job performance evaluation, which is rarely if ever possible (in outside hire scenarios at least) and is difficult to consistently value even then.

Even more difficult to properly value than the human capital assets that are contained within a single human resource (e.g. talents, skills, individual experience) are the human capital assets that interconnect the employees, teams and divisions. More than just collectively creating the culture of an organization, the individual human capital that each member brings to their role indelibly shapes the systems and processes around them.

Two Types of Human Capital Assets

Accordingly, there are really two separate classes of human capital assets: those you bring with you to the company (in the case of new hires) or to the new position (in the case of promotion from within) and those human capital assets that develop within the company, ideally representing interconnections, symbioses, and complementary abilities among the organization members.

Put another way, there is one class of human capital assets that employees bring with them when they come and also take with them when they go – along with the new experience and knowledge they’ve gained during the course of their tenure with the organization.

The second separate class of human capital assets represents the footprint that remains embedded within the organization when a member of that organization and their individual class 1 human capital assets no longer fill that space.

Making It Work For Your Business

With all that in mind, how then can an organization best apply these conceptualizations of human resources and the two classes of human capital assets when valuing employees in terms of salary and benefits packages?

As discussed above, salary remains a rational means for evaluating and rewarding value to an organization, especially in new hire and promotion scenarios. However, it is not the only nor necessarily the ideal tool by which talent can be retained. Further, talent (and other class 1 human capital assets) are not the only human capital assets that the organization has an active interest in preserving.

Salary alone has its limitations as an effective retention tool in today’s highly competitive talent retention environment. In fact, many organizations are turning to creative benefits and incentives structures to better reward employees for the often undervalued footprint that their intangibles make on the organization.

While salary for any given skillset or set of experiences can always be met or exceeded by an outside offer with the flick of a pen, uniquely tailored benefits packages designed to optimally fulfill the needs of an employee can be a much more difficult offer to match and can better align the employee’s incentives in accordance with the size of their intangible footprint.

Knowing the difference between human resources and the human capital management can be a helpful consideration to account for when evaluating those resources and capital assets.

Even more so, when determining how best to compensate employees for the intangibles they bring to and create within the organization, revitalized benefits packages are an effective way to properly align the incentives of both the employee and the organization as a whole.

With a vast variety of benefits options and insurance brokers combined with the current technological search capabilities to nearly instantly find the best fit for your organization, there is no reason not to make sure your current benefits and incentive options aren’t neglecting the human capital assets on which your organization depends.

Start searching today on Mployer Advisor.

About Mployer Advisor

At Mployer Advisor, our focus is creating transparency in the insurance and insurance broker, consultant and advisor space to the advantage of the employer. Analytics is our core and we will bring to light new information, tools and resources to aid employers in making more cost-effective decisions. As a phase I, we are here to help employers find the right broker or consultant and the right insurance company for them. Giving choice and initial transparency is a first step in creating an employer centric insurance marketplace.


Health Insurance Trends
What is Critical Illness Insurance?
The article provides an overview of critical illness insurance, explaining what it is and how it works. It also discusses the benefits and drawbacks of this type of insurance policy and who may benefit from it.
December 19, 2022

Critical Illness Insurance Overview

Critical illness insurance provides a lump sum payment to policyholders who experience one of a few serious medical conditions, like a debilitating stroke or certain cancers, that are specified in the policy. These medical conditions often create significant financial burdens beyond the costs that traditional health insurance will cover. For this reason, critical illness insurance is typically complementary to traditional health insurance coverage.Imagine a scenario in which a person is diagnosed with a potentially life-threatening illness. Even with the best possible health care coverage, that person is likely to experience additional financial strains that are well outside the scope of their traditional insurance policy.

For example, time away from work may lead to reduced or eliminated income. The illness itself may render the person incapable of taking care of dependents or even themselves, thereby requiring additional childcare and other assistance. Further, perhaps the treatment for the illness is not available locally and therefore requires extended travelling and accommodation expenses.

In the above scenario, critical illness insurance may serve as a crucial stopgap that enables a person who is experiencing unfortunate and often unfamiliar circumstances to maintain some semblance of financial security and normalcy, such as looking after their household and paying rent or a mortgage despite significant time away from their job or home.

How is Critical Illness Insurance Different from Traditional Health Insurance?

In some ways, critical illness insurance is similar to the traditional health insurance coverage that it supplements. For example, critical illness insurance policyholders will typically pay monthly premiums for coverage that extends to a finite list of conditions that are clearly outlined in the policy.

However, this is essentially where the similarities with traditional health insurance end. In fact, there are substantial differences in terms of what critical illness insurance covers as well as when and how claims are paid out.

Premiums

The premiums for critical illness insurance tend to be considerably smaller than the more expensive premiums that accompany traditional health insurance.

Depending on the size of claims payment outlined in the policy, premiums for critical illness coverage may only cost 10% or less of what a policyholder's traditional health insurance coverage costs.

Of course, the cost of the monthly premium is relative to the potential maximum claims pay out, with lower premiums earning lower maximum claims payouts while higher monthly premiums lead to larger maximum claims payouts.

Term of Coverage

Critical Illness policies are more akin to term life insurance policies than traditional health insurance when it comes to the policy term. For critical illness insurance, many if not most policies will only remain active until the policyholder reaches a certain age, at which point the policy will expire. This is often 70 to 75 years old.

Scope of Coverage

The list of conditions that critical illness insurance will cover is significantly smaller than the range of ailments that traditional insurance will cover, sometimes only including a handful of conditions.

Ailments and conditions that are commonly covered in critical illness insurance policies include:

  • Organ failure or replacement complications
  • Certain cancers
  • Cardiovascular problems
  • Strokes
  • Lou Gehrig’s disease
  • Other serious though not chronic conditions

Chronic conditions are typically excluded from critical illness insurance policy coverage because the continuing nature of such maladies is better served by types of insurance with other claims payout structures beyond the capped, lump-sum payout structure of critical illness policies.

Payment on Claims

Capped Lump-Sum Payments

Unlike traditional health insurance which typically pays out claims directly to health care providers, critical illness insurance pays out claims directly to policyholders in a lump sum once the policyholder has been diagnosed with a covered condition and has met the policy requirements.

Paying out critical illness insurance policies in lump sums allows policyholders to choose how best to allocate those financial resources to best meet their individual needs, which can include anything from paying a high deductible on their traditional insurance to taking a vacation if they deem rest and relaxation to be a prioritized step toward their recovery.

How the lump sum is spent is entirely in the policyholder’s discretion.

The amount of the lump sum can vary significantly from one policy to the next depending on the cost of the monthly premiums (higher premiums = higher lump-sum claims payouts) and the specific conditions that are covered by the policy. The size of capped payouts may range from $10k up to $100k and possibly even more in some circumstances.

There is a maximum amount for each lump-sum payout per condition that is covered under the policy. For example, assume that a given critical illness policy has a maximum payout of $30k and covers 5 conditions including strokes and coronary bypass. If a policyholder has a stroke and receives the full 30k lump sum payout, and then the same policyholder has a heart attack and needs a coronary bypass, most critical illness policies will then payout an additional 30k lump sum for the heart condition and treatment.

However, should that same policyholder then experience a second qualifying stroke or heart attack, the policy will no longer pay out a lump sum for those conditions. The policy would still pay out for the other 3 remaining conditions for which the policyholder had not yet made a claim.

Proportional Payouts Relative to the Severity of the Condition

Even when a patient experiences one of the handful of conditions that are covered by a critical illness insurance policy, full payment of the maximum lump sum requires that the condition in question meets a requisite degree of severity, as outlined in the policy.

For example, if cancer is covered in a critical illness policy that has a maximum lump-sum payout of $50k, that policy will likely stipulate that it will only pay out $10 to $15k if the cancer is stage 1 or stage 2, whereas stage 3 or stage 4 cancer might garner the maximum payout.

If a proportional payout is made due to the limited severity of the condition experienced by a policyholder, the policy will still pay lump sums for that same condition up to the amount of the capped maximum lump sum.

For example, assume a given policy has a $10k maximum capped lump sum for certain cancers, but will only pay out 10% of the maximum lump sum in cases where the cancer is in stage 1. In this instance, if a policyholder is diagnosed with stage 1 of a qualifying cancer, they would then be paid out $1k. However, if that same policyholder is later diagnosed with stage 4 cancer, they could then be paid out the remaining $9k to reach the amount of the maximum capped lump sum in accordance with the policy.

Timing of Payouts

Even when a policyholder is diagnosed with or experiences one of the conditions explicitly covered in a critical illness insurance policy, the lump-sum payment, proportional to severity or otherwise, may not necessarily be immediately forthcoming.

For example, some critical illness insurance policies have explicit delays in payment to make sure that the policyholder survives the initial onset of the condition (i.e. stroke victims may have to wait a period of several weeks as outlined by the policy to ensure they survive their stroke before their claim will be paid out).

Do I Need Critical Illness Insurance and Should I Offer it to My Employees?

A 2018 article from the Society of Human Resource Management states that 25% of employers offer some form of critical illness insurance as an opt-in benefit for their employees. This was 8% higher than the number of employers that offered critical illness insurance in 2017 and 10% higher than 2014.

Given the trend, it’s likely that even more employers are offering CI benefits today.

There are many advantages to critical illness coverage, including relatively cheap premium payments for what can be a windfall of financial support when it’s needed most. Further, that financial support is flexible in terms of allowing the policyholder to focus those resources where they are most needed.  

The most obvious negative aspect of critical illness coverage, however, is that the small number of conditions that a given policy will cover means that there are a wide variety of significant and sometimes catastrophic medical issues that a policyholder may experience for which their critical illness insurance policy will be of absolutely no help whatsoever.

That said, from the perspective of the employer, there is little downside to offering critical illness insurance on an opt-in, voluntary basis.

Given the relatively low premiums, these policies are typically affordable both for the employer (in the somewhat rare event that employers are making contributions) and for the employees, even if they’re paying their own premiums entirely out-of-pocket.

Top Questions You Should Ask Your Broker about Critical Illness Insurance

  • What conditions does this policy cover?
  • How does the severity of each condition affect the lump sum claims pay out?
  • What are the monthly premiums?
  • How much is the maximum capped lump-sum claims payout for each condition?
  • When does the critical illness insurance policy term expire?
  • What triggers the expiration?
  • How long after a covered condition is diagnosed or a claims-triggering event occurs before the claim can be filed and paid out?
  • Will higher maximum lump-sum claims payment policies require any additional family history or medical examination requirements for policyholders?

How to Get Critical Illness Insurance

To get critical illness insurance, you should start by talking to your insurance broker. Ask them the questions above to ensure you receive the policy that best fits your specific needs.

If you don’t have a broker already or need a broker who has experience and expertise with critical illness insurance, Mployer Advisor can help. We make it easy to find and compare top-rated insurance brokers in your area.

Search for brokers with critical illness insurance expertise near you, and see reviews, ratings and more to help you find the best fit. Start your search now on Mployer Advisor.Find Insurance Brokers Near You

About Mployer Advisor

At Mployer Advisor, our focus is creating transparency in the insurance and insurance broker, consultant and advisor space to the advantage of the employer. Analytics is our core and we will bring to light new information, tools and resources to aid employers in making more cost-effective decisions. As a phase I, we are here to help employers find the right broker or consultant and the right insurance company for them. Giving choice and initial transparency is a first step in creating an employer centric insurance marketplace.