AI benefits intelligence for leading
brokers, consultants, employers, and carriers.
An AI-native platform for plan ratings, claims analytics, market intelligence, and compliance, all built on the industry's largest, proprietary data asset.
Supporting Benefit & Insurance Leaders Across Their Workflows
On One Data Foundation.
Independent benefits benchmarking and plan ratings
- ✓Objective plan score benchmarked to a custom cohort matched by industry, location, and size
- ✓Pillar-level detail across medical, ancillary, and more
- ✓Presentation-ready output to walk into any renewal with a defensible story
Simple-to-use, consolidated client reporting across claims, Rx, stop loss, and more.
- ✓Upload any benefits and carrier docs for done-for-you, presentation-ready output
- ✓Structured report that carries your firm's brand, not ours
- ✓Built-in assistant answers questions about the numbers
Market analytics and prospecting
- ✓Search every employer by plan design, carrier, incumbent broker, and renewal timing
- ✓See who holds each account across commercial P&C and retirement, in one view
- ✓Send qualified accounts straight to your CRM
On-demand HR, compliance, and content for advisors and their clients.
- ✓A steady stream of HR and benefits content, branded for your firm
- ✓Compliance kept current for you, no compliance lawyer on staff
- ✓Share to clients in a few clicks, no marketing team required
Provide compliance, claims analytics and benchmarking directly to your employers
- ✓Fully white-labeled, so clients see your brand, not Mployer
- ✓AI support that answers questions on real plan data in seconds
- ✓Analytics, documents, compliance, census, and your team in one place
An expert AI agent, trained on over 2B+ unique data points, serves you across each solution and step.
Start utilizing Mployer now — for free.
Get started today and take your market analytics and partner consulting to the next level.
Built on one unified, secure foundation.
Mployer's AI is driven by proprietary internal data assets — not generic internet content. For trusted, benefits-grounded strategy and advice, Mployer's platform is the industry leader.
One data foundation, 24M+ unique data points
Benefits, workers' comp, ancillary, leave design, pharmacy, and beyond — the broadest, deepest recurring benefits data in the industry, powering every product from one source of truth.
AI-native, not bolted on
Reach Mployer's data through the AI tools your team already uses. Purpose-built for benefits, not general-purpose AI.
Enterprise-grade security
SOC 2 compliant, with enterprise SSO, encryption at rest and in transit, and role-based, least-privilege access across every product. Independent penetration tests and security audits run annually, backed by continuous monitoring, formal incident response, and rigorous vendor and access reviews.
AI Safety
Specialized agents access only the data they need, with guardrails, custom evals, and human oversight — so answers stay grounded, accurate, and safe.
Access Mployer Directly Inside the AI You Already Use
Connect Mployer's proprietary benefits data to the assistants your team already works in. Ask in plain language and get trusted, benchmarked answers — no new tool to learn.
Empowering brokers and their employer partners to attract and retain.
You offer great benefits — make sure you're using it as a competitive advantage.
Great benefits make a measurable difference. Companies earning Mployer's benefits awards see it in the metrics that matter most.
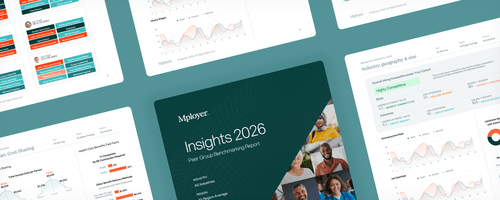
See how 2026 benefits look nationally
Download Mployer Insights 2026 to see how trends across the nation — medical, ancillary, leave, and retirement plans — are changing. All of this data is available at the industry, region, and size level.
Recent market trends
See more posts →

FAQs
Mployer is an employee benefits intelligence platform for brokers, consultants, and employers. It turns 24M+ unique data points into plan ratings, market visibility, claims analytics, and compliance tools on an AI-native platform, with products including Insights+, Catalyst, Vista, Pulse, and Atlas. Mployer is a company name, not the word “employer” — it is not a recruiting or hiring tool.
Employee benefits are one of an employer's largest expenses, yet most benchmarking relies on small survey samples or a single consultant's book of business. Mployer replaces that guesswork with objective, data-driven answers: rate any plan, benchmark it against real peer employers, and surface the market and claims intelligence brokers and employers need to make defensible decisions.
Traditional benchmarking depends on periodic surveys with limited participation. Mployer is built on proprietary data pooled across hundreds of thousands of real employer benefit plans, refreshed continuously and delivered through an AI-native platform. That means benchmarks down to industry, location, and size, available on demand rather than once a year.
Mployer's benchmarks are built on proprietary employer benefits data pooled across hundreds of thousands of plans, spanning medical, ancillary, pharmacy, leave, and retirement. This pooled data asset is what powers plan ratings, market intelligence, and claims analytics across every product.
Mployer serves benefits brokers and consultants, insurance carriers, and employers. Brokers use it to rate plans, win and retain accounts, and deliver client-ready reporting; employers use it to see how their benefits compare and where to improve.
Mployer offers five products: Insights+ (plan ratings and benchmarking), Catalyst (market analytics and prospecting), Vista (claims and financial reporting), Pulse (branded HR and compliance content), and Atlas (a white-label client portal). The broker directory on the site is a public research asset, not a product.
Yes. Mployer is SOC 2 compliant, with enterprise SSO, encryption of data at rest and in transit, and role-based, least-privilege access. Independent penetration tests and security audits are performed annually.
Mployer is led by Founder & CEO Brian Freeman, CFO Mark Ryan, CRO Neil Fisher, CTO Steve Strickland, and CGO Anthony Waters. The company was founded in 2020 and is headquartered in Nashville, Tennessee. Meet the leadership team →
Brokers and employers can request a walkthrough of the platform to see how Mployer's data applies to their book of business. Book a demo →
Create your account to see the answer.
Your free Mployer account unlocks the free tier across Insights+, Vista, Catalyst, Pulse, and Atlas.
Create free account →
.svg)
.svg)
.svg)
.svg)