

.svg)
One of the most common misconceptions among modern business organizations is that human resources and human capital are the same thing. Some organizations historically have used the terms interchangeably, and there remains a great deal of overlap between them. However, the modern understanding of these terms as distinct concepts is more than a vocabulary lesson; it is critical to the optimization of both.
The broadest area of overlap between human resources and human capital, as the nomenclature suggests, is that they are primarily concerned with the people who make up an organization. But while human resources involves the employees themselves and their role within the hierarchy of the organization, human capital management is about the intangible assets that each employee brings to their role in the organization.
To put it another way, for any goal that an organization may hope to accomplish, human resources covers the ‘who’ in terms of who will be responsible for defining, delegating, executing and accomplishing that goal. Human capital covers the ‘how’ in terms of the tools, such as creativity, problem-solving, experience, network and authority, that each human resource within the organizational hierarchy will put to use toward seeing the organizational goal achieved.
Another feature that human resources and human capital management share is a difficulty being precisely quantified. While somewhat rudimentary if not crude as a metric, human resources can at least be measured on the balance sheet in the form of salaries and benefits.
Human capital, on the other hand, is even more difficult to represent in figures – though theoretically at least, that human capital should be equally represented in the same salaries and benefits earned by the human resources that embody that human capital.
This is where the distinction between human resources and human capital management becomes significant. It is standard practice within most organizations to associate salary and benefits directly with the concept of human resources. This is because the core salary and benefits package is perceived as being baselined by the title or position within the organizational hierarchy, and then adjusted according to the skills, experience, value and advantages (or lack thereof) brought to the role by the individual employee hired to fill that position.
In other words, salary and benefits are conceptually understood as primarily a function of the titled position within the organizational structure, which then potentially can be modified up or down depending on other factors including the perceived human capital that a prospective hire might bring to their new position.
What is a PEO and Is It Right for My Company?
It should be noted that this perception of human resources as an independent variable with human capital as subordinate is entirely rational given that human capital is so difficult to identify and measure – even more so in the interview and acquisition process. Certainly, abstract human capital assets like talents, good business practices and habits, and creative problem-solving skills are incredibly difficult to value in advance of a thorough on-the-job performance evaluation, which is rarely if ever possible (in outside hire scenarios at least) and is difficult to consistently value even then.
Even more difficult to properly value than the human capital assets that are contained within a single human resource (e.g. talents, skills, individual experience) are the human capital assets that interconnect the employees, teams and divisions. More than just collectively creating the culture of an organization, the individual human capital that each member brings to their role indelibly shapes the systems and processes around them.
Accordingly, there are really two separate classes of human capital assets: those you bring with you to the company (in the case of new hires) or to the new position (in the case of promotion from within) and those human capital assets that develop within the company, ideally representing interconnections, symbioses, and complementary abilities among the organization members.
Put another way, there is one class of human capital assets that employees bring with them when they come and also take with them when they go – along with the new experience and knowledge they’ve gained during the course of their tenure with the organization.
The second separate class of human capital assets represents the footprint that remains embedded within the organization when a member of that organization and their individual class 1 human capital assets no longer fill that space.
With all that in mind, how then can an organization best apply these conceptualizations of human resources and the two classes of human capital assets when valuing employees in terms of salary and benefits packages?
As discussed above, salary remains a rational means for evaluating and rewarding value to an organization, especially in new hire and promotion scenarios. However, it is not the only nor necessarily the ideal tool by which talent can be retained. Further, talent (and other class 1 human capital assets) are not the only human capital assets that the organization has an active interest in preserving.
Salary alone has its limitations as an effective retention tool in today’s highly competitive talent retention environment. In fact, many organizations are turning to creative benefits and incentives structures to better reward employees for the often undervalued footprint that their intangibles make on the organization.
While salary for any given skillset or set of experiences can always be met or exceeded by an outside offer with the flick of a pen, uniquely tailored benefits packages designed to optimally fulfill the needs of an employee can be a much more difficult offer to match and can better align the employee’s incentives in accordance with the size of their intangible footprint.
Knowing the difference between human resources and the human capital management can be a helpful consideration to account for when evaluating those resources and capital assets.
Even more so, when determining how best to compensate employees for the intangibles they bring to and create within the organization, revitalized benefits packages are an effective way to properly align the incentives of both the employee and the organization as a whole.
With a vast variety of benefits options and insurance brokers combined with the current technological search capabilities to nearly instantly find the best fit for your organization, there is no reason not to make sure your current benefits and incentive options aren’t neglecting the human capital assets on which your organization depends.
Start searching today on Mployer Advisor.
At Mployer Advisor, our focus is creating transparency in the insurance and insurance broker, consultant and advisor space to the advantage of the employer. Analytics is our core and we will bring to light new information, tools and resources to aid employers in making more cost-effective decisions. As a phase I, we are here to help employers find the right broker or consultant and the right insurance company for them. Giving choice and initial transparency is a first step in creating an employer centric insurance marketplace.


August Release Notes: Catalyst and Insights
Welcome to our latest release. We are excited for you to try the new features. This release focused on four things: making Mployer AI available throughout every product, rebuilding each product's home page to put the AI assistant front and center, adding new filters in Catalyst to help you find more opportunities, and opening free tiers on all products. Below is a summary of the major changes.
Mployer AI throughout Catalyst
The Mployer AI panel is now available on every Catalyst search grid: Employer, Commercial P&C, Broker, Carrier, Company, PEO, and Retirement. You can ask questions about your results without leaving the search.
The home page search bar has been replaced with the same AI chat. You can ask about companies, OSHA data, or benefits in plain language from the top of the page, and your chat history is retained on your device.
All AI surfaces in Catalyst, including the in-app chatbot and home page search, now run on an updated MCP backend, making every assistant significantly smarter.
Commercial Search
Experience Mod, carrier relationship, modeled payroll, and premium are now available as filters and columns in Commercial Search. OSHA and DOT records show violation gravity, the number of employees exposed, and 12-month trend direction across violations, crashes, and drivers. P&C brokers can now build prospect lists around financial exposure and compliance risk directly in the grid.
PEO Search
PEO Search, Snapshot, and Company Snapshot now show a single view of an employer's most recent PEO affiliation, with full switching history available from the same place. Previously, multiple affiliations could appear as separate records. Filters, columns, and exports now include Filing Source, PEO status, Benefits and Overall Rating, Most Recent Filing, EIN, and NAICS, bringing PEO Search in line with Employer Search.
Export and contact visibility
The export modal now shows your remaining credit balance and the actual record count and cost after exclusions, before you confirm. The "Exclude Previously Exported" option now covers the past 12 months rather than your full export history.
Contact records display an email verification status at all times, and you can filter contacts by that status when prioritizing outreach.
Mployer AI on the Insights home page
You can now ask questions about your book of business directly from the Insights home page. An AI assistant sits alongside your submissions and works against your client data, so you can ask which clients scored below benchmark, which reports are complete, which clients qualify for an award, or "show me completed reports where voluntary STD is offered," and get the answer without building filters by hand.
You can filter submissions by benchmark score, lifecycle state, and award eligibility, run reports from the same view, and export any filtered result to CSV.
Free tiers on all products
Every product now includes a free tier. We encourage you to try out all the resources now available to you.
AI panel on Insights+ reports
The Mployer AI panel on Insights+ HTML reports has been redesigned to match the AI panels in the rest of the platform, with the same layout, controls, and prompt patterns. Generate recommendations and ask any questions about the report and data, and get answers instantly.
Help Center
A new Help Center is live, with a home page, per-product detail pages, and a video tutorial library. Webinars, product updates, a glossary, and FAQs will be added within the same structure.
If you have questions about any of these changes, contact Partner Success or reach us through the Help Center.

The Likely Fastest-Growing Line in Your Benefits Budget
Modern medicine has produced remarkable advances. Cancer therapies that were not available five years ago are now extending and saving lives. Treatments for autoimmune diseases, multiple sclerosis, and rare genetic conditions are giving employees and their families real options where few existed before. As an employer, providing access to these treatments through your benefit plan is one of the most meaningful things your organization does for the people who work there.
It also comes with a financial reality that every benefits decision maker needs to understand clearly. Over 25% of total employer health benefit expenses are now driven by prescription drugs, and within that figure, a small number of specialty drugs account for an outsized share of the cost. A single covered employee on an oncology therapy can generate $100,000 to $170,000 or more in annual drug spend. A handful of members on these treatments can represent a larger budget impact than the entire pharmacy spend of the rest of your workforce combined. The goal is not to restrict access to these medications. The goal is to understand how the system works, how costs flow, and how to structure your plan so that both your employees and your organization are best positioned for the long term.
This piece covers how the pharmacy benefit system works, how your plan’s tier structure determines who pays what, how stop-loss insurance interacts with high-cost drug claims, and what employers can do to manage this exposure thoughtfully.
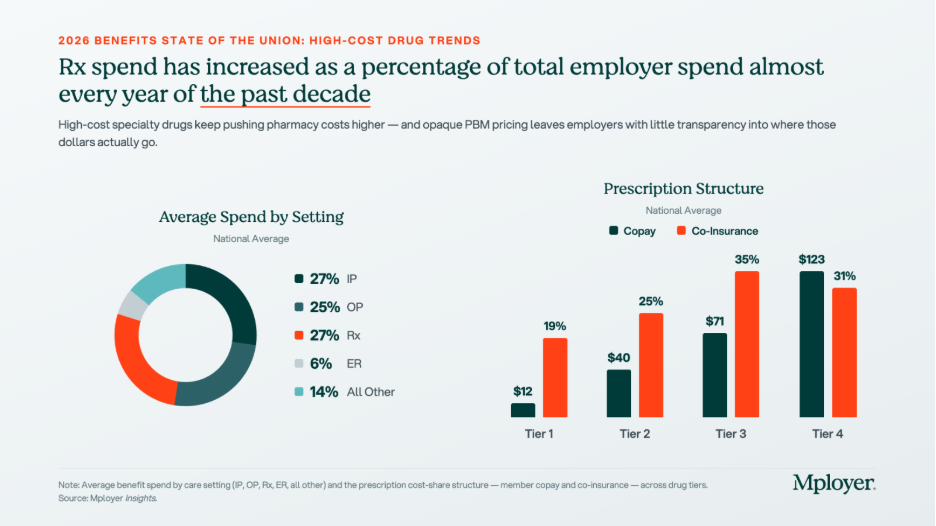
The tier structure in the chart above reflects how plans already account for the cost complexity of specialty drugs. Tier 4, which is where specialty biologics and injectables are typically placed, carries significantly higher cost-sharing than the other tiers: an average employee copay of $123 and coinsurance requirements in 31% of plans. But Tier 4 behaves very differently from the other tiers. On Tier 1, 2, and 3 drugs, cost-sharing is relatively predictable and manageable. On Tier 4, the combination of high drug cost and percentage-based coinsurance can generate out-of-pocket exposure that approaches or exceeds a patient’s annual out-of-pocket maximum in a single month of therapy. How Tier 4 is structured, what controls are in place, and how the plan manages cost is one of the most consequential design decisions an employer makes.
Understanding Your Benefit Plan’s Pharmacy Options
How Pharmacy Benefit Managers Work
Most employer health plans do not manage pharmacy benefits directly. That function is delegated to a Pharmacy Benefit Manager, or PBM, which acts as the intermediary between the health plan, the pharmacy, and the drug manufacturer. The PBM builds and maintains the formulary, negotiates drug prices and rebates with manufacturers, contracts with pharmacy networks, and processes pharmacy claims. The three dominant PBMs, Express Scripts (owned by Cigna), CVS Caremark (owned by CVS Health / Aetna), and OptumRx (owned by UnitedHealth Group), together manage the pharmacy benefits of approximately 80% of covered lives in the United States. Each is affiliated with a major carrier, meaning that employers who use an ASO medical arrangement often default to the carrier’s affiliated PBM without realizing it. Independent PBMs such as Capital Rx, Navitus, and MedOne Pharmacy Benefit Solutions operate on transparent, pass-through pricing models that return all rebates to the plan rather than retaining them as PBM revenue. PBMs are compensated through administrative fees, spread pricing (charging the plan more than the pharmacy receives and keeping the difference), manufacturer rebates in exchange for formulary placement, and specialty pharmacy margin. For any employer managing meaningful specialty drug spend, understanding which of these revenue sources applies to your contract is essential.
How Drug Tiers and Cost-Sharing Work
Every pharmacy benefit plan organizes covered drugs into tiers, with cost-sharing that increases as you move from Tier 1 generics (avg. $12 copay) through Tier 2 preferred brands ($40), Tier 3 non-preferred brands ($71), and into Tier 4 specialty drugs ($123 copay, with coinsurance in 31% of plans). The tier placement of a drug affects both what the employee pays and, indirectly, what the plan pays, since tier placement drives utilization patterns. Plan sponsors have real levers here: step therapy (requiring a patient to try a lower-cost drug first), prior authorization, specialty pharmacy channel mandates, and formulary exclusions all affect Tier 4 cost without eliminating clinical access. These controls require balancing cost management with the reality that for many specialty drugs, no lower-cost alternative achieves the same clinical outcome.
How Stop-Loss Insurance Interacts with High-Cost Drug Claims
For self-funded employers, specialty drug claims are now among the most common triggers for individual stop-loss reimbursement. A single employee on a cancer therapy or rare disease treatment can generate pharmacy claims that exceed the plan’s specific stop-loss deductible, which averages $141,938 nationally for self-insured plans, within a single plan year. The mechanics: the employer pays all claims up to the deductible threshold, and the stop-loss carrier reimburses costs above it. Several dynamics are specific to high-cost drugs. At renewal, stop-loss carriers may laser a known high-cost member by raising their individual deductible or excluding them from coverage. Some carriers now specifically carve out GLP-1 medications or other high-utilization drug categories from stop-loss reimbursement, so employers adding new drug coverage should verify what their contract covers. Specialty drugs can also be administered under either the pharmacy benefit or the medical benefit depending on whether they are self-administered or clinic-administered, and some stop-loss contracts apply different terms to each channel. Employers should model their actual specialty drug cost distribution against their stop-loss deductible at every renewal to understand where the plan’s real exposure sits.
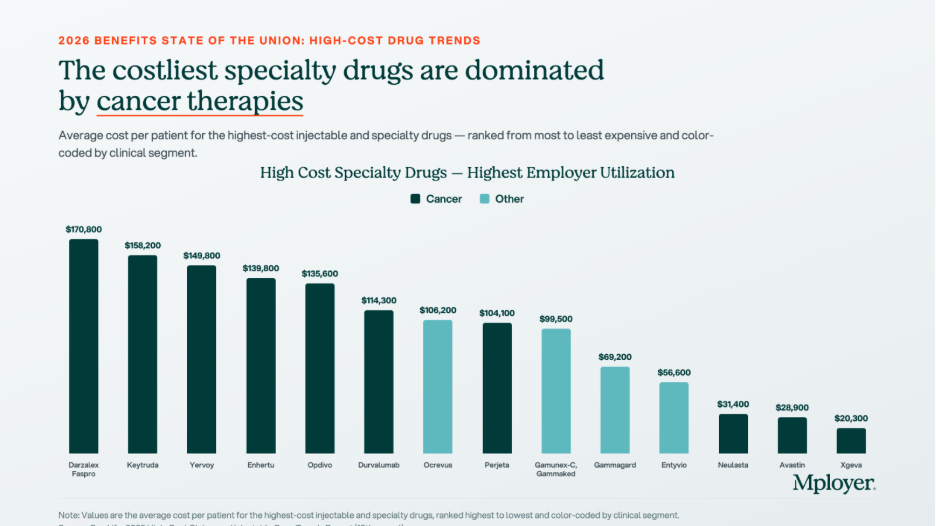
The Costliest Specialty Drugs: What They Treat and What They Cost
The chart below shows the highest-cost specialty and biologic drugs by average cost per patient, ranked from most to least expensive. Cancer therapies dominate the top of the list, but treatments for autoimmune conditions, MS, and inflammatory disease also appear, reflecting how broadly specialty drug spending is distributed across a workforce.
Biosimilars: The Cost Opportunity Most Employers Are Not Fully Using
A biosimilar is a biologic drug that is highly similar to an already-approved reference biologic, with no clinically meaningful differences in safety, purity, or potency. Biosimilars are not generic drugs in the traditional sense, because biologic drugs are complex proteins manufactured from living cells and cannot be chemically replicated exactly. But they go through an FDA approval pathway that confirms their clinical equivalence to the reference product, and they cost significantly less. The biosimilar market has expanded rapidly as major biologic patents have expired. Humira, the world’s best-selling drug for much of the past decade, now has multiple biosimilar competitors in the U.S. Stelara has followed. The oncology biosimilar pipeline is maturing, with more approvals expected in the next two to three years.
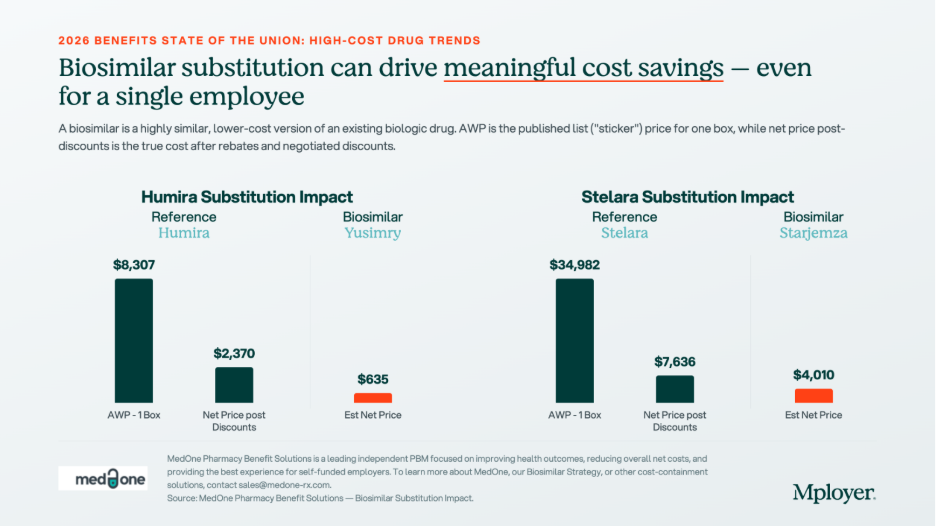
The chart above shows what biosimilar substitution looks like in dollar terms. For Humira, the net price after rebates and negotiated discounts is $2,370 per box. The biosimilar Yusimry has an estimated net price of $635, a 73% reduction. For Stelara, the reference drug net price is $7,636 per box. The biosimilar Starjemza has an estimated net price of $4,010, a 47% reduction. For an employee on monthly Humira therapy, the difference between the reference drug and the biosimilar is approximately $21,000 per year in net plan cost. For a Stelara patient, the annual difference is approximately $43,500. Across even a small number of members on these therapies, biosimilar substitution is one of the highest-return cost management interventions available.
Plan sponsors have four main tools to drive biosimilar adoption: preferred formulary placement (putting the biosimilar on a lower tier and the reference drug on a higher tier), step therapy for new patients, automatic substitution where state law permits, and formulary exclusion of the reference drug entirely. The most important variable in any biosimilar strategy is whether your PBM has a financial incentive to keep the reference drug preferred. A PBM earning a large rebate on Humira has a direct financial reason to keep Humira on the preferred formulary, even when the biosimilar costs the plan less on a net basis. Independent PBMs operating on pass-through pricing remove this conflict entirely, because all rebates return to the plan and formulary decisions are made without a competing financial interest.
What Employers Should Be Asking About Their Pharmacy Benefit
High-cost drug management requires active decisions about PBM contract structure, formulary design, specialty pharmacy strategy, and stop-loss alignment. The questions worth asking at every renewal:
Know How Your Pharmacy Benefit Compares
Pharmacy is now one of the two or three most consequential cost management decisions in health plan design. The employers managing it well are not restricting access to the medications their employees need. They are ensuring that the structure of the benefit, the PBM contract, the formulary design, and the stop-loss coverage work together in the plan’s interest, and that every dollar spent on high-cost drugs is spent as efficiently as possible.
Mployer’s benefits rating evaluates pharmacy benefit design as part of the Medical pillar score, benchmarked against a custom cohort matched by size, region, and industry. Knowing where your pharmacy benefit stands relative to employers who actually look like you is the starting point for making better decisions.
See how your benefits package compares to your custom cohort at MployerAdvisor.com.
Sources
Mployer Insights: Average Spend by Setting, Prescription Structure, and High-Cost Specialty Drugs. Source: Mployer Insights analysis.
MedOne Pharmacy Benefit Solutions: Biosimilar substitution impact data for Humira/Yusimry and Stelara/Starjemza. MedOne is a leading independent PBM focused on improving health outcomes and reducing net costs for self-funded employers. [email protected].
Mployer 2025 and 2026 Employee Benefit Plan Design Study, covering 50,000+ employer plans. Individual stop-loss avg $141,938 self-insured.
Consolidated Appropriations Act of 2021, Section 202: broker/consultant compensation disclosure requirements for group health plans.
FDA Biosimilar approval framework: 42 U.S.C. Section 262(k).
Parental and Maternity Leave: What Employers Need to Know
If there is one area of employee benefits where employer decisions signal values as loudly as economics, it is parental leave. How an organization treats employees who are growing a family, both during the leave itself and in how it structures the financial support, tells candidates and employees a great deal about whether the organization means what it says about supporting its people.
This is Part 2 of our leave benefits series. Part 1 covered the foundations: vacation, paid holidays, sick leave, consolidated vs. non-consolidated plans, workplace flexibility, and the federal and state legal framework. This post goes deeper on maternity and parental leave specifically: what the terms mean, how the programs are structured, what federal and state law requires vs. what employers choose to provide, and how the data from 50,000+ employer plans describes the current state of the market.
The data in this post is at the national all-employer average. The variation beneath that headline, by industry, employer size, and region, is significant. A technology employer in a major metro area competing for mid-career talent faces a very different parental leave benchmark than a regional manufacturer or a healthcare employer in a mid-size market. Both contexts are worth knowing. The national benchmarks in this post show where the floor and the ceiling are. Knowing where your specific cohort sits requires a custom comparison.
Key Terms Every Benefits Decision Maker Should Know
What the Law Requires: Federal and State Baseline
Federal FMLA
Federal FMLA, covered in depth in Part 1, provides the baseline: up to 12 weeks of unpaid, job-protected leave for the birth, adoption, or foster placement of a child. This applies to employers with 50 or more employees. The critical word, again, is unpaid. FMLA does not require the employer to pay anything during parental leave. It only requires that the job be protected and that group health insurance continue during the leave period on the same terms as if the employee had not taken leave.
FMLA also applies to both parents, which is a point often overlooked. The non-birth parent, whether an adoptive parent, a same-sex partner, or a non-birth parent of any kind, is entitled to the same 12 weeks of unpaid job protection under federal FMLA as the birth parent, assuming all eligibility requirements are met.
State Paid Family Leave Programs
The paid leave piece, when it exists at state level, comes from state paid family and medical leave programs. These are state-administered insurance programs that pay a wage replacement benefit, typically 60 to 90 percent of the employee’s wage up to a weekly cap, to employees on qualifying parental or family leave. The most established programs are in California, New Jersey, New York, Washington, Massachusetts, Connecticut, Oregon, Colorado, Rhode Island, and the District of Columbia, with additional states phasing in programs in the coming years.
These programs are funded through payroll contributions, typically deducted from employee wages, sometimes matched by employers. The benefit is paid by the state program, not directly by the employer, though the employer is responsible for administering eligibility, managing payroll deductions, and coordinating the state benefit with any employer-provided leave. Employers in states with paid leave programs should understand how the state benefit interacts with their own leave policy, including whether employees are required or permitted to use accrued PTO concurrently with state paid leave.
Pregnancy Discrimination and PUMP Act
Two additional federal laws shape the employer’s obligations around pregnancy and parental leave. The Pregnancy Discrimination Act prohibits employers with 15 or more employees from discriminating against employees on the basis of pregnancy, childbirth, or related conditions. The PUMP for Nursing Mothers Act, enacted in 2022, requires employers to provide reasonable break time and a private space for nursing employees to express breast milk for up to one year after the child’s birth. These are separate from FMLA and apply to a broader range of employers.
Maternity Leave: What the National Data Shows

68% of employers nationally offer dedicated maternity leave beyond statutory short-term disability. 32% do not, meaning those employees rely entirely on STD for any paid income during leave, typically six to eight weeks at whatever percentage the disability plan covers. Among the 68% who do offer dedicated maternity leave, eight weeks of additional paid leave is the most common duration at 31%, with twelve weeks close behind at 26%. Together those two categories account for more than half of all programs. 16% of employers offer thirteen or more weeks of additional paid leave, placing them at the generous end of the market nationally.
Reading this data correctly requires understanding what these weeks represent. The duration bars in the chart show the additional paid leave added on top of disability coverage, not the total leave period. An employee at an employer offering eight weeks of additional leave on top of a six-week STD benefit has fourteen weeks of paid leave total before any unpaid FMLA job protection kicks in. That total is what candidates and employees are actually comparing when they evaluate a parental leave program.
Disability Payment Rates and Top-Off: The Variables That Define Generosity
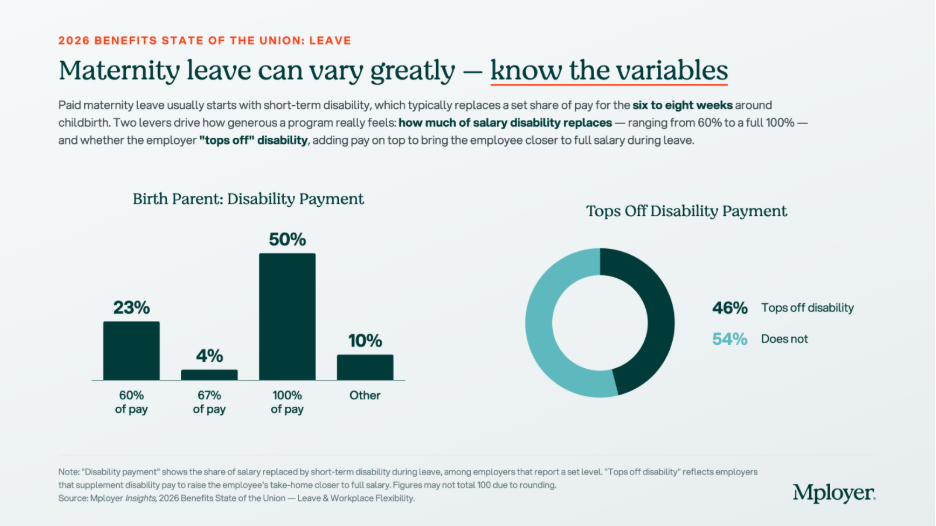
The chart above tells the real story of how financially supportive maternity leave programs are. On the disability payment rate, the market has split sharply: 50% of employers with a defined disability payment rate pay 100% of salary during the disability period, while 23% pay the traditional 60% of salary. The gap between these two is meaningful. An employee earning $80,000 per year on a six-week disability period at 60% of pay receives approximately $5,538. At 100% of pay, she receives $9,231. That $3,693 difference is real money for a new parent.
The top-off picture is similarly divided. 46% of employers supplement the disability benefit to bring the employee closer to full salary. 54% do not. An employer who pays STD at 60% of salary and does not top off is providing the minimum financial support that a standard disability plan delivers. An employer who pays 100% of salary or who tops off a 60% plan to full pay is making a meaningfully different statement about how much they value employees during one of the most important transitions of their lives
The combination of these two variables, disability payment rate and top-off, is what candidates from competitive talent markets are increasingly asking about directly. It is not enough to say your company offers paid maternity leave. The question they are asking is: how much will I actually receive, and for how long?
Non-Birth Parent Leave: A Growing Expectation, Not Yet a Standard

41% of employers nationally offer dedicated non-birth parent leave, meaning leave specifically provided for partners, fathers, adoptive parents, and same-sex parents who are not the birth parent. 59% do not. Among those who do offer non-birth parent bonding leave, twelve weeks is the most common duration at 32%, with six weeks next at 23%. The 30% in the Other category reflects the wide variation in how these programs are structured, including tiered policies, programs that vary by tenure, and policies that provide different durations based on the type of parental event.
The gap between maternity and non-birth parent leave offer rates, 68% vs. 41%, reflects the historical pattern of parental leave being designed primarily around biological motherhood and disability recovery. That framing is shifting. Candidates across generations, and particularly millennial and Gen Z candidates who are entering or approaching family formation years, are increasingly evaluating parental leave as a package: not just what the birth parent receives, but whether the partner can also be present. An employer offering generous maternity leave but no paternity or bonding leave is offering a program that structurally assumes only one parent takes significant time away, which does not match how many families today want to organize the early months of a child’s life.
Non-birth parent leave also has a practical retention implication. Employees who take bonding leave and feel supported by their employer during it are more likely to return to work and remain engaged. The data on parental leave and retention consistently shows that leave policies affect long-term retention rates, not just initial job acceptance.
Fertility and Adoption Benefits: Rare but Rising

28% of employers nationally offer IVF coverage as part of their medical or family-building plan. 11% offer adoption assistance. Both numbers reflect concentrated adoption among larger employers and in specific geographies and industries, particularly technology, financial services, and professional services employers in major metropolitan markets. Coverage terms, lifetime maximums, and eligibility criteria vary widely among the minority of employers who offer these benefits, making direct comparisons difficult without plan-level detail.
IVF treatment costs can reach $15,000 to $30,000 or more per cycle, with most patients requiring multiple cycles. For employees who need IVF to build a family, employer coverage is not a luxury benefit. It is a financial necessity that directly affects whether they can afford to pursue treatment at all. For employers, IVF coverage is a high-signal benefit: it communicates investment in the full arc of an employee’s family life, not just the period after a child arrives. Among employers competing for talent in industries where IVF coverage has become a common offering, its absence is noticed.
Adoption assistance typically covers qualified adoption expenses such as legal fees, agency fees, home study costs, and travel, up to an annual maximum that varies by employer. The IRS allows employers to provide up to $17,280 in adoption assistance per child tax-free in 2026. Adoption leave policies, separate from adoption assistance, are covered under FMLA for qualifying placements and under many state paid leave programs as well.
Parental Leave as a Talent and Retention Strategy
Parental leave is one of the most emotionally charged benefit decisions a candidate makes. It is also one of the most concrete. Unlike dental coverage or life insurance multiples, parental leave generates direct, personal financial calculations: how much will I receive, for how long, and what will that mean for my family’s finances and my ability to be present during a period that does not repeat?
Employers who have invested in a strong parental leave program and are not talking about it are leaving one of their best recruiting assets on the table. A program that offers twelve or more weeks of additional paid leave, a top-off to full salary, and bonding leave for non-birth parents is well above the national market on all three dimensions. That is a specific, documentable competitive advantage in candidate conversations, offer letters, and employer brand communications. It does not require marketing language. It requires knowing what your program provides and being willing to state it clearly.
Employers who are uncertain about where their program stands face a different challenge. If you are not sure whether your maternity leave duration, your disability payment rate, your top-off policy, and your non-birth parent bonding leave compare favorably to the employers recruiting against you, you cannot use those elements as differentiators, and you cannot address them strategically at renewal. The national benchmarks in this post give you the market context. The custom cohort analysis Mployer builds from employers matching your industry, region, and size gives you the specific comparison that matters for your talent market.
Parental leave policy is not static. The market has moved meaningfully in the past five years and continues to move. Employers who last reviewed their parental leave program three or more years ago are likely benchmarking against a standard that has already shifted. Knowing where you stand today is the starting point for deciding whether to maintain, improve, or actively use your program as a recruiting asset.
See how your parental leave and full benefits package compare to your custom cohort at MployerAdvisor.com.
Sources
Mployer Insights, 2026 Benefits State of the Union: Leave & Workplace Flexibility. Source: Mployer Insights analysis of 50,000+ employer benefit plans. All Nation Average.
Family and Medical Leave Act of 1993 (FMLA), 29 U.S.C. Section 2601 et seq. Applies to employers with 50+ employees.
Pregnancy Discrimination Act, 42 U.S.C. Section 2000e(k). Applies to employers with 15 or more employees.
PUMP for Nursing Mothers Act (2022), amending the Fair Labor Standards Act. Applies to most employers.
State paid family leave programs: California (SDI/PFL), New Jersey (TDI/FLI), New York (NY DBL/PFL), Washington (WA PFML), Massachusetts (MAPFML), Oregon (OPFML), Colorado (FAMLI), Rhode Island (TCI), Connecticut (CTPFML), District of Columbia (DC PFML).
IRS adoption assistance exclusion 2026: $17,280 per child, per IRS Notice 2025-61.

.svg)


.svg)
.svg)
.svg)