June's product updates are here, and there's a lot to be excited about. We're continuing to build on the foundation we've established across Catalyst and Insights benchmarking, with this month's updates focused on giving users more precision in how they search, prospect, and manage data.
Author:
June 2, 2026
June's product updates are here, and there's a lot to be excited about. We're continuing to build on the foundation we've established across Catalyst and Insights benchmarking, with this month's updates focused on giving users more precision in how they search, prospect, and manage data.
On the Catalyst side, that means expanded AI assistant capabilities, more flexible export controls, and deeper CRM customization. For benchmarking, we've added AI-powered recommendations and made meaningful improvements to the report experience, including how you access completed reports and how data flows through the submission wizard.
Read on for the full details.
Catalyst
Proximity-Based Geographic Search — The AI assistant now supports radius-based company searches around a city, so territory prospecting works the way territories actually do — not just by state, city, or zip.
Product Line Gap Queries — Ask the AI assistant which product lines — Stop Loss, EAP, Voluntary, TPA — an employer has or is missing. Cross-sell identification now happens in a conversation, not a spreadsheet.
Headcount Milestone Flags — The AI assistant can surface employers who've recently crossed key thresholds: 50, 100, 500 employees. Growth signals and compliance triggers, surfaced automatically.
Flexible Export Range Selection — When exporting data, users can now choose the current page, a page range, or a specific record count. Providing precise control without bumping into system limits.
Experience Mod Data on Account View — Experience Modification data now appears directly on the Company Overview and Commercial P&C tab, so risk context is right there when you need it.
Custom CRM Field Mapping — Account admins can now map platform fields to custom CRM fields, including custom schemas. Providing full control over how data flows in without overwriting existing records.
Retirement Search: Total Assets Filter — The Retirement Search Assets filter now filters on Total Assets.
Insights+
AI-Powered Recommendations in Insights+ Users can now access AI-generated recommendations directly within Insights+. The new recommendations tool surfaces actionable guidance across four categories. Highest Impact, Cost Strategy, Coverage Gaps, and Underwriter Notes, giving users a faster path from report data to next steps.
Completion Email Links to HTML Report — When your report is ready, the notification email now links directly to the interactive HTML report including Mployer AI and all report tools, instead of a PDF download.
Redesigned Chart Layout — Plan Score and Cohort Market Data sections are now clearly differentiated, and Dental and Vision pages consolidate their left-side tables. Easier to read, faster to interpret.
Report Opens Without Losing Your Place — Clicking a company name in the Request History Grid now opens the HTML report in a new tab, so your search state stays exactly where you left it.
Rate Availability Edits No Longer Clear Rate Data — Adjusting Rate Availability selections mid-wizard no longer wipes Medical, Dental, or Vision rate and contribution data previously entered. No more lost work.
Age-Banded Entry Hidden When Not Applicable — When 'Use employee contributions only' is selected, Age-Banded rate entry is no longer shown — cleaner form, fewer distractions.
That's a wrap! Stay tuned for what's coming next month.
There are very few mechanisms in the U.S. benefits system that are truly triple tax-advantaged. The Health Savings Account is one of them. Contributions go in pre-tax, grow tax-free, and come out tax-free when used for qualified medical expenses
Author:
The Tax Advantage Most Employers Are Leaving on the Table
There are very few mechanisms in the U.S. benefits system that are truly triple tax-advantaged. The Health Savings Account is one of them. Contributions go in pre-tax, grow tax-free, and come out tax-free when used for qualified medical expenses. For employers, an HSA is also a funding tool: a way to offset the cost impact of pairing employees with a high-deductible health plan while creating real, measurable value that employees can carry with them.
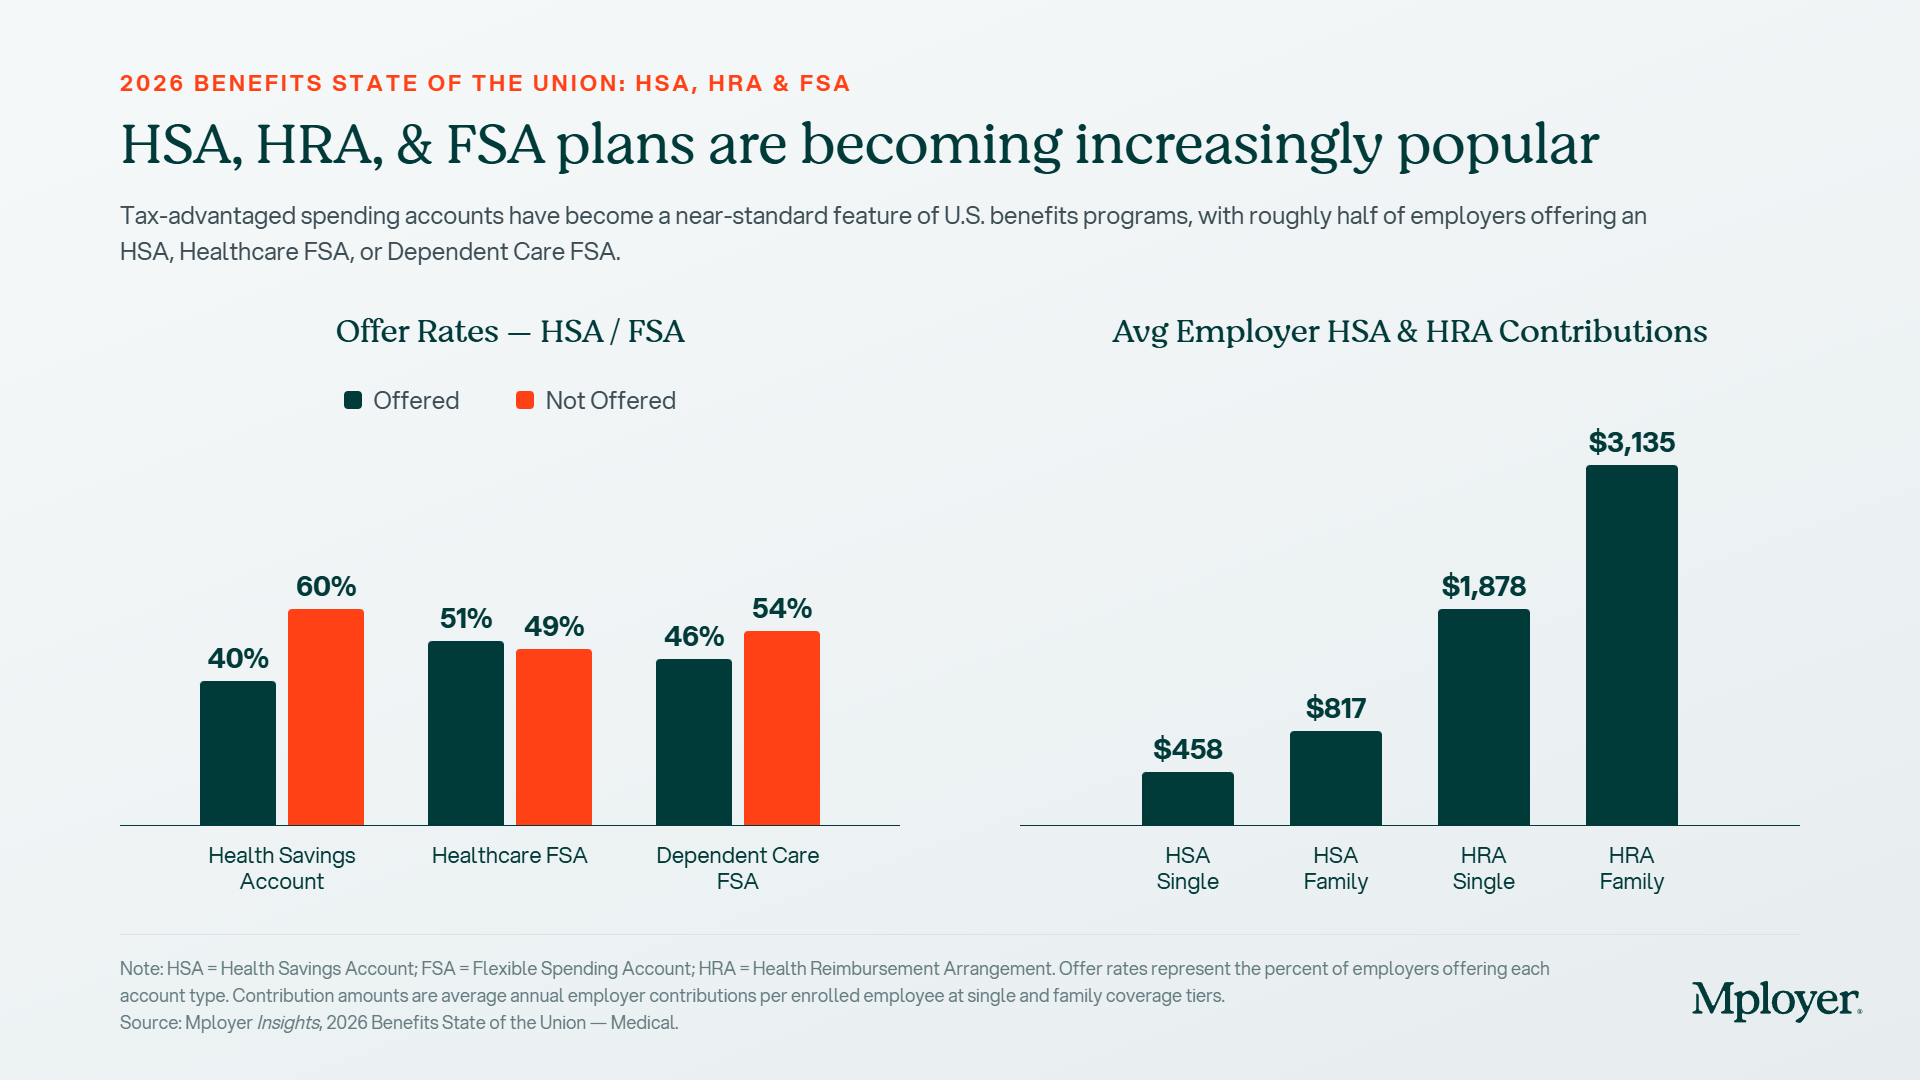
And yet, only 40% of employers currently offer an HSA. That means six out of ten are not providing access to one of the most tax-efficient benefits tools available; in many cases because they’ve defaulted to a PPO or HMO structure without modeling what a consumer-directed health plan paired with meaningful employer HSA funding would look like competitively.
This is not a promotion for HSAs and HRAs, the only goal is to provide a more detailed understanding of how they work and their adoption to date. This covers what HSAs and related cost-sharing vehicles actually are, how they interact with plan design, what employers are contributing nationally, the key vendors in the space, and what separates employers who use these tools strategically from those who don’t.
HSA, HRA, FSA: What Each One Actually Is
These three accounts are often grouped together but they work very differently. Understanding the distinctions matters before designing a benefits strategy around any of them.
Health Savings Account (HSA)
An HSA is an individually owned, portable savings account available only to employees enrolled in a qualified High-Deductible Health Plan (HDHP). Contributions can come from the employer, the employee, or both, up to IRS annual limits ($4,400 single / $8,750 family for 2026). Funds roll over year to year, can be invested, and remain with the employee if they leave. The triple tax advantage (pre-tax in, tax-free growth, tax-free out for qualified expenses) makes this the most valuable account structure of the three.
Key rules to know:
Must be paired with an IRS-qualified HDHP (2026 minimums: $1,700 single / $3,400 family deductible; OOP maximums: $8,500 single / $17,000 family)
Employee cannot be enrolled in Medicare, claimed as a dependent, or have other disqualifying coverage
Unused funds roll over indefinitely, there is no use-it-or-lose-it provision
After age 65, funds can be withdrawn for any purpose (ordinary income tax applies, like a 401k)
Employer contributions are not subject to payroll tax, a savings of ~7.65% on every dollar contributed
Catch-up contribution for employees age 55+: additional $1,000 per year (unchanged for 2026)
Health Reimbursement Arrangement (HRA)
An HRA is employer-owned and employer-funded. Unlike an HSA, the employee never receives or holds the funds, rather the employer reimburses eligible expenses up to a set annual limit. Unused balances can be carried over at the employer’s discretion or forfeited at year-end. Because the employer retains unused funds, HRAs are particularly attractive for employers who want to offer meaningful financial support to employees while limiting their actual cash outlay to claims incurred.
Key rules to know:
Employer-funded only, employees cannot contribute
Can be paired with any plan type, including PPO and HMO (unlike HSA)
Employer decides what qualifies as a reimbursable expense
ICHRA (Individual Coverage HRA) allows employers to reimburse individual market premiums, a growing alternative to group coverage
Forfeitures return to the employer, making this a lower actual-cost vehicle than the stated contribution amount
Excepted Benefit HRA (EBHRA) limit for 2026: $2,200 per year (up from $2,150 in 2025)
Flexible Spending Account (FSA)
An FSA is an employer-sponsored, employee-funded account for pre-tax healthcare or dependent care expenses. The Healthcare FSA is offered by 51% of employers and is the most widely available of the three accounts. However, the classic “use it or lose it” rule applies: unused funds are generally forfeited at year-end, though employers may allow a grace period or a limited rollover. FSAs can be paired with PPO and HMO plans but cannot be used alongside a standard HSA.
Key rules to know:
Employee-funded via pre-tax payroll deductions (employers may also contribute)
Healthcare FSA 2026 employee contribution limit: $3,300 per employee (unchanged from 2025)
Dependent Care FSA is separate and covers childcare and elder care (46% of employers offer this)
Use-it-or-lose-it: forfeitures stay with the employer unless a rollover or grace period is offered
Limited Purpose FSA can be used alongside an HSA for dental and vision expenses only
How Plan Design and HSA Eligibility Connect
The most important design constraint for employers to understand: an HSA is only available to employees enrolled in a qualified HDHP. That connection makes HDHP plan design decisions and HSA funding strategy inseparable.
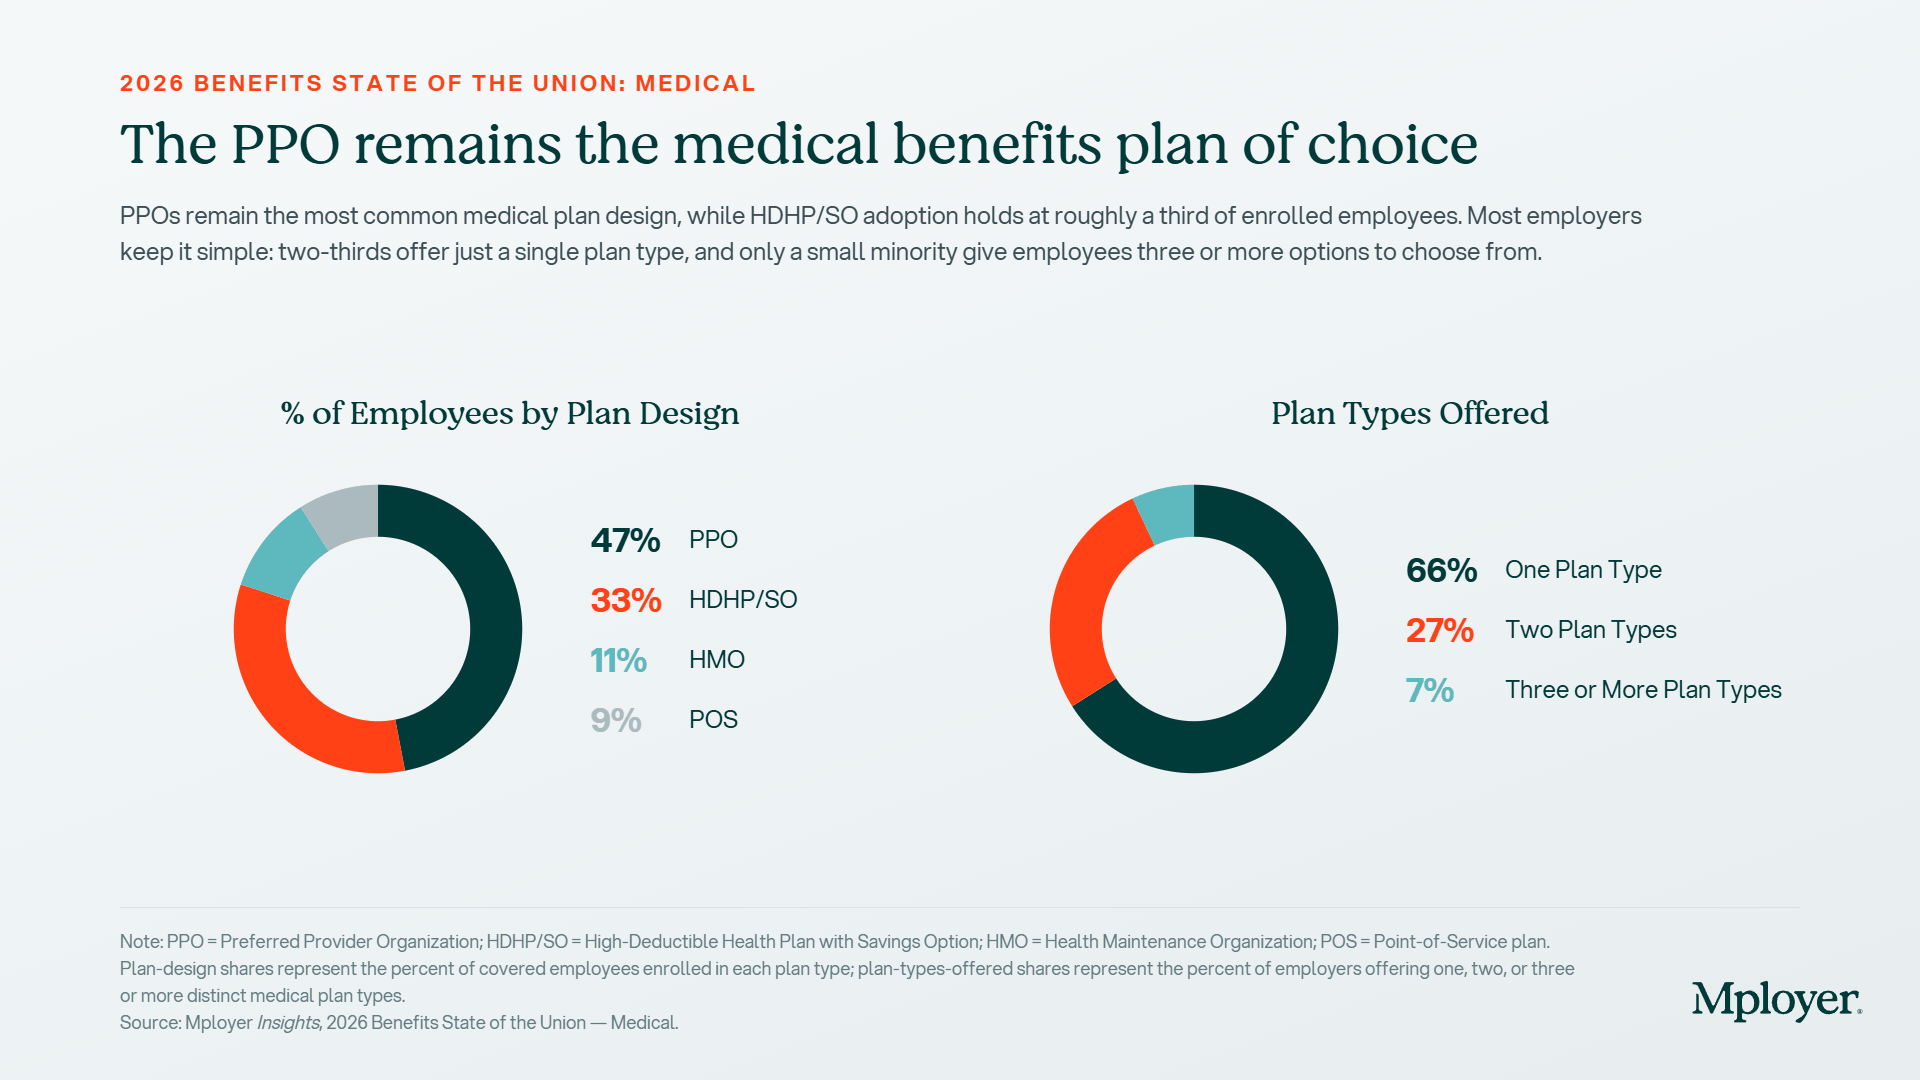
Currently, 33% of employees nationally are enrolled in an HDHP/SO plan, compared to 47% in a PPO. HDHP deductibles average $3,460 for single coverage and $8,273 for family, meaningfully higher than PPO averages of $1,857 single and $1,638 family aggregate. For 2026, the IRS minimum HDHP deductible is $1,700 for single coverage and $3,400 for family, with an out-of-pocket maximum of $8,500 single / $17,000 family. That deductible gap is the core employee concern with HDHPs, and it’s precisely where employer HSA contributions come in.
When an employer pairs an HDHP with a meaningful HSA contribution, they are effectively offsetting a portion of the employee’s deductible exposure upfront, making the high-deductible plan significantly more attractive. An employer contributing $458 toward a single employee’s HSA reduces the net deductible that employee faces from $3,460 to roughly $3,000. An employer contributing nothing leaves that gap entirely to the employee, making the HDHP structurally punishing compared to a PPO.
A PPO does not qualify employees for HSA contributions. PPO plans can be paired with an HRA (employer-funded only) or a Healthcare FSA (employee-funded, pre-tax). This is an important distinction for employers offering multiple plan types, the account strategy differs depending on which plan the employee selects.
What Employers Are Actually Contributing: The National Benchmarks
The gap between HSA and HRA employer contribution levels is striking. According to Mployer’s plan data covering 50,000+ employers:
Average employer HSA contribution: $458 for single coverage / $817 for family coverage
Average employer HRA contribution: $1,878 for single coverage / $3,135 for family coverage
Only 40% of employers offer an HSA at all, 60% do not
Healthcare FSA offer rate: 51%
Dependent Care FSA offer rate: 46%
The HRA contribution averages are substantially higher than HSA averages for a structural reason: HRAs are employer-owned accounts, and employers have full control over what is actually paid out. Because forfeitures return to the employer, the stated contribution amount overstates the actual cost. Employers using HRAs strategically understand that the funded amount and the realized cost are different numbers and that gap can be significant depending on utilization patterns.
For employers offering HSAs, the question is not just whether to contribute, but how much. An HSA employer contribution of $0 foregoes payroll tax savings on every dollar that could have been contributed, and removes a key differentiator for employers whose HDHP deductibles are above market. The 2026 IRS maximum contribution is $4,400 for single coverage and $8,750 for family; meaning the average employer contribution of $458 single represents just 10% of what employees could potentially receive tax-free.
Copays, Cost-Sharing, and How They Interact with Account-Based Plans
One of the most common points of confusion for employees, and plan sponsors, is how copays work in the context of HDHPs and HSAs.
In a traditional PPO or HMO, employees typically pay a flat copay at the point of service: $27 for a PCP visit under a PPO, $26 under an HMO, $29 under a POS plan (national averages from Mployer’s data). These copays do not count toward the deductible in most cases and take effect immediately regardless of whether the deductible has been met.
In a true HDHP, IRS rules generally prohibit first-dollar coverage, meaning copays cannot apply before the deductible is met (with limited exceptions for preventive care). The employee pays the full negotiated rate for services until the deductible is satisfied, at which point coinsurance or copays kick in. This is a fundamentally different employee experience, and one that drives the perception that HDHPs are always worse for employees. The reality depends on the employer’s HSA funding strategy and where the employee lands on the utilization curve.
Employer decisions about hospital cost-sharing further shape this picture. For inpatient hospital services under HDHP plans, 70% of employers use copayment structures; for outpatient, 74% use copayments. Under PPO plans, hospital cost-sharing is more evenly split between copayments and coinsurance. These structural choices, combined with deductible levels and HSA funding, determine the real cost experience for employees across plan types.
The Vendor Landscape: Who Administers These Accounts
Setting up and administering HSAs, HRAs, and FSAs requires a third-party administrator. The vendor landscape is well-developed but fragmented, and the right choice depends on employer size, plan complexity, and whether investment options are a priority.
HSA Custodians
Fidelity: the largest HSA provider by assets; no account fees, strong investment options, integrates with payroll
HealthEquity: major HSA custodian with employer-facing administration tools and HDHP carrier partnerships
HSA Bank: bank-based custodian offering FDIC-insured accounts and investment options through TD Ameritrade
Optum Financial: UnitedHealth-owned platform with strong integration into UHC medical plans
WEX Health: multi-account platform covering HSA, HRA, and FSA administration in one system
HRA Administrators
PeopleKeep: specializes in ICHRA and QSEHRA for small and mid-size employers; strong compliance support
Take Command Health: ICHRA-focused platform with employee-facing marketplace integration
Businessolver: enterprise benefits administration platform with integrated HRA management
Most major TPAs (Benefitfocus, bswift) offer HRA administration as part of broader benefits admin
FSA Administrators
WEX: one of the largest FSA administrators; covers Healthcare FSA, Dependent Care FSA, and transit accounts
Flores & Associates: independent FSA/HRA administrator with a strong employer service model
Ameriflex: mid-market focused FSA/HRA/COBRA administrator with a clean debit card experience
PayFlex (Aetna): integrated with Aetna medical plans; common in employer groups already on Aetna
For employers setting up an account-based plan for the first time, the most common path is to start with the HSA or FSA administrator recommended by their medical carrier or broker. While convenient, this is not always the lowest-cost or highest-value option. Employers with self-funded plans or significant HSA-eligible populations should evaluate custodians independently, particularly investment options, account fees, and payroll integration.
How the Strategy Is Evolving
The account-based benefits landscape has expanded meaningfully since 2020. The introduction of ICHRAs (Individual Coverage HRAs) gives employers a new tool: instead of offering a group health plan, they can provide a defined dollar contribution that employees use to purchase individual market coverage. For distributed workforces, part-time heavy employers, or organizations in markets where group plan design is always a compromise, ICHRAs are increasingly worth modeling.
HSAs are also increasingly being positioned as a retirement health savings vehicle. Employees who contribute to an HSA and invest the balance, rather than spending it down each year, can accumulate a meaningful reserve for post-retirement healthcare costs. Fidelity estimates that a 65-year-old couple retiring today will need approximately $315,000 to cover healthcare costs in retirement. An HSA is one of the only accounts that can address that liability with pre-tax dollars.
IRS contribution limits for 2026: $4,400 for self-only HDHP coverage and $8,750 for family coverage, with an additional $1,000 catch-up contribution for those age 55 and older. HDHP minimum deductibles are $1,700 single / $3,400 family, with out-of-pocket maximums of $8,500 single / $17,000 family. Employers who set their HSA contribution strategy once and don’t revisit it annually may be leaving employees with a funding gap as limits increase each year.
Know How Your HSA Strategy Compares
Most employers know what they contribute to an HSA. Few know how that contribution compares to what their peers (same industry, location, and size) are contributing. An employer contributing $200 to a single employee’s HSA may feel like they’re offering something meaningful. Against a cohort where the average is $458, they’re below market in a category employees increasingly compare.
Mployer’s benefits rating evaluates HSA and HRA funding levels as part of the Medical pillar score (alongside deductibles, premiums, and plan design) to show employers exactly where their cost-sharing strategy sits relative to their custom cohort.
Benefits are one of the most powerful weapons in your people strategy. Used well, they help you attract candidates who would otherwise choose a competitor, retain employees who might otherwise leave, and signal to your workforce that you’re invested in them beyond the paycheck. Used poorly, or just blindly, they drain budget without delivering on any of those goals.
Author:
The Blind Spot at the Center of Your People Strategy
Benefits are one of the most powerful weapons in your people strategy. Used well, they help you attract candidates who would otherwise choose a competitor, retain employees who might otherwise leave, and signal to your workforce that you’re invested in them beyond the paycheck. Used poorly, or just blindly, they drain budget without delivering on any of those goals.
Here’s the uncomfortable truth: most employers are using this weapon without knowing if it’s loaded.
According to the U.S. Bureau of Labor Statistics, benefits represent nearly 30 cents of every compensation dollar for private industry employers — $13.79 per hour worked, against $32.36 in wages. For a company with 200 employees, that’s often $3 million or more in annual benefits spend. Yet almost no employer can answer the most basic strategic question about that investment: are we contributing too much, too little, or exactly right to achieve our people goals?
Are you overspending on a medical plan that employees don’t value relative to peers? Underspending on leave in a market where competitors have pulled ahead? Offering a life insurance benefit that looks generous on paper but ranks below market against companies actually competing with you for talent? Without a true benchmark, you don’t know. And without knowing, you can’t make a strategic decision, you can only make an annual one.
Why Accurate Benefits Benchmarks Are Hard to Come By
Getting a meaningful benefits benchmark is genuinely difficult, even for the best brokers in the market. The challenge isn’t effort or intent. It’s data. The two most commonly cited industry sources, Mercer and Kaiser, each contain approximately 2,000 employer plans distributed across eight major industries. Filter further by region and company size, the only way to get a more accurate comparison, and you’re benchmarking against five or six peers.
That’s not a benchmark. That’s a conversation at a conference.
The best brokers know this, and they look for better data. Mployer aggregates and rates benefit plans for over 75,000 employers, drawing from direct employer surveys, broker-shared plans, public filings, and claims data. That’s the sample size required to build a custom cohort that actually reflects your market: your industry, your region, your size. Not a national average. Not an approximation. A real peer group.
Every Benefits Package Falls on a Bell Curve
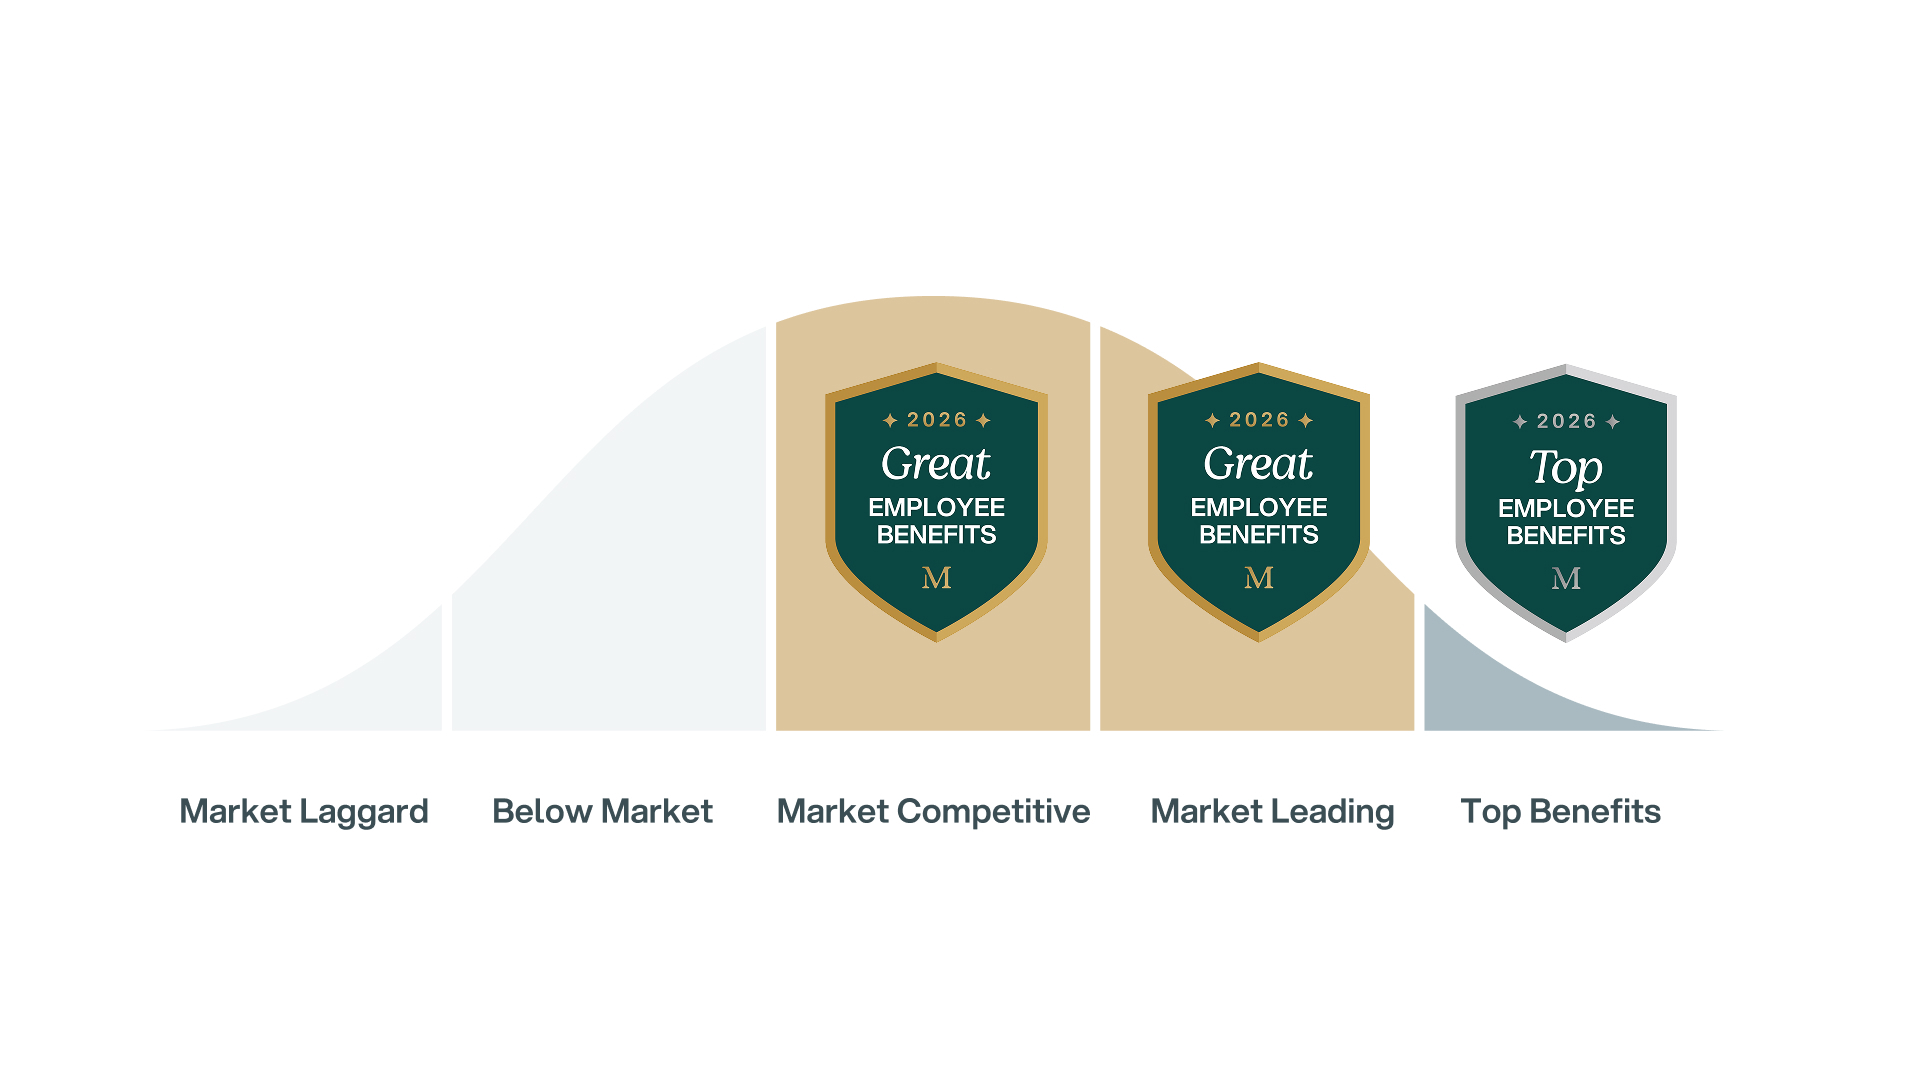
Benefits competitiveness follows a normal distribution. When you plot tens of thousands of employer plans against each other, a bell curve emerges, and every employer lands somewhere on it.
Mployer rates plans across five tiers:
Top Benefits — An elite package surpassing industry standards. Strong retention and recruitment tool, though likely at a higher cost to the employer.
Market Leading — Materially above market. Demonstrates a meaningful commitment to employee well-being.
Market Competitive — Solid, in line with industry norms. Balances employee needs with cost.
Below Market — Modest compared to peers. May create headwinds in recruiting.
Market Laggard — Below industry norms. Employers here will face measurable challenges retaining and attracting talent.
Like any bell curve, employers are distributed across all five tiers — from those offering standout packages to those with room to grow. The question isn’t which tier you hope you’re in. It’s which tier you’re actually in.
Our Plan Evaluation Methodology
Mployer aggregates employer investment and scores across four pillars of your benefits package, combining them into an overall rating benchmarked against your custom cohort.
Medical — Your largest cost driver.
Monthly premium (single and family), employer contribution percentage, deductible (single and family), maximum out-of-pocket, HSA/HRA employer contribution, plan type mix (PPO, HDHP, HMO, POS), and funding structure (fully insured, level-funded, or self-funded).
Ancillary — The supporting benefits employees notice more than employers think.
Dental offer rate and employer contribution percentage, vision offer rate and contribution, life insurance as a multiple of salary, short-term disability percentage of salary and maximum weekly benefit, and long-term disability percentage of salary and maximum monthly benefit.
Leave — Increasingly a deciding factor for candidates.
Total vacation days by tenure, paid sick days, paid holidays, parental leave (birth and non-birth parent), paid family leave, and flexible or remote work availability.
Retirement — A long-term signal of how much you invest in your people.
401(k) offer rate, employer match percentage, vesting schedule, auto-enrollment, and auto-escalation features.
Each data point is measured against employers who look like you. A PPO deductible that’s competitive for a technology company on the West Coast may be below market for a manufacturing company in the Midwest. Context is everything. National averages erase it.
Your Employees Are Watching
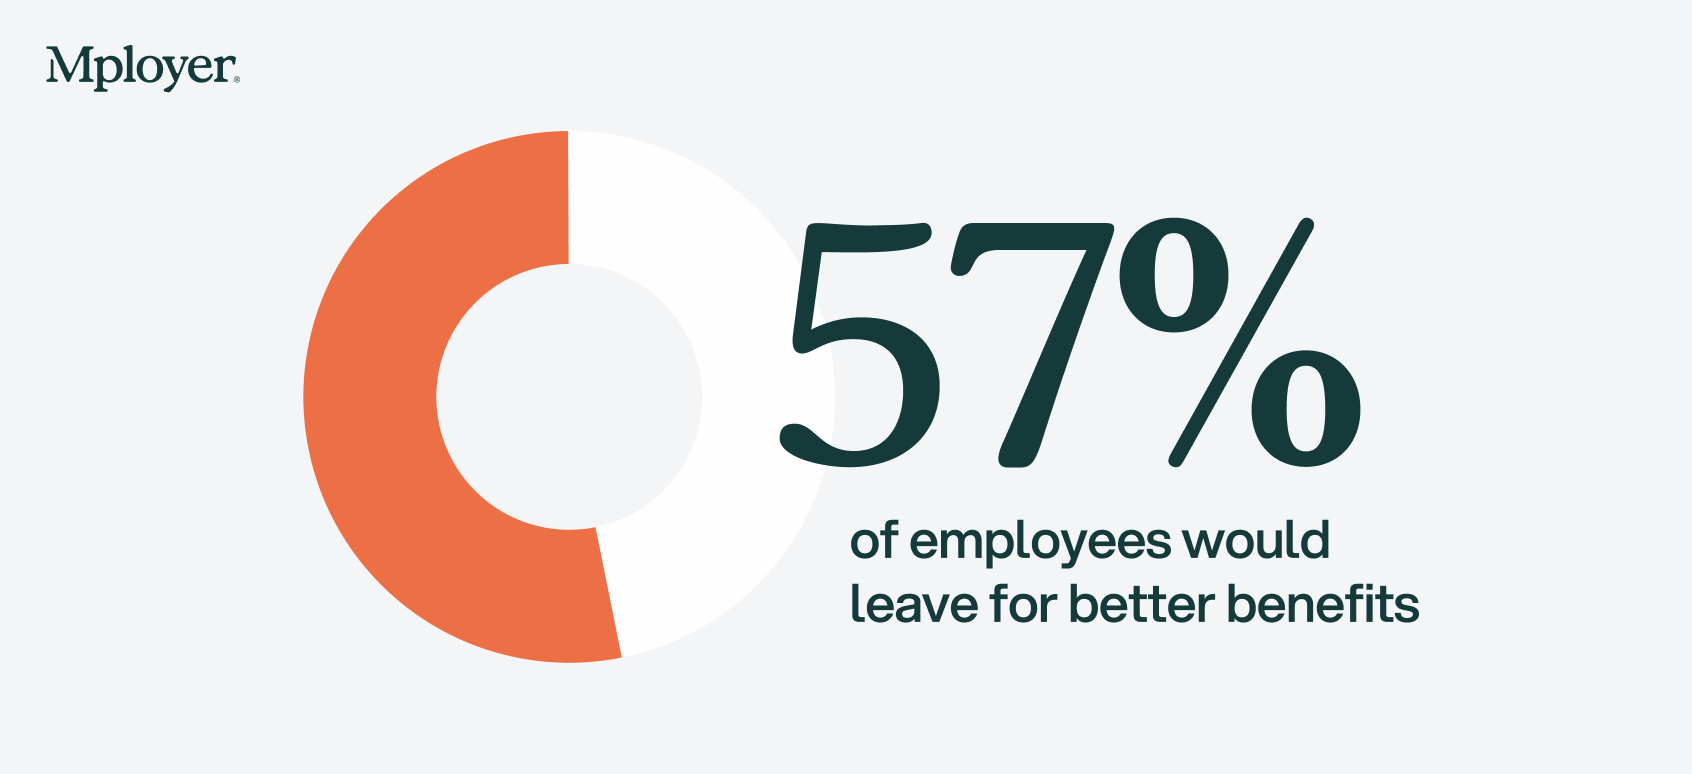
More than half of employees (57%) say they would leave their current job for one with better benefits. Nearly one in three say they would accept lower pay in exchange for a richer benefits package. These aren’t survey artifacts — they show up in time-to-fill metrics, turnover rates, and exit interview data.
Benefits aren’t soft. The cost of a mis-positioned benefits package shows up on your income statement — in recruiting fees, onboarding time, and lost productivity. It just rarely gets traced back to the source.
Know Where You Stand. Put It to Work.
Thousands of employers — from growing mid-size companies to large national organizations — use Mployer to rate their benefits package and understand exactly where they stand. The rating is free, covers all four pillars, and is built against a cohort matched to your industry, region, and size.
Employers who receive a Market Competitive, Market Leading, or Top Benefits rating gain access to a suite of ready-to-use recognition materials: offer letter language, employee-facing benefits guides, social media assets, and digital badges for careers pages and job postings. Independent validation of your benefits quality is a recruiting signal that most employers don’t have — and the data shows what happens when they use it: 9x more candidates when the rating is included in job postings, 25% faster time-to-fill, and 15% lower voluntary turnover.
Employers with room to improve get something equally valuable: a precise, pillar-by-pillar picture of what’s affecting their score and where a targeted investment would move the needle most.
Either way, you leave knowing something most employers don’t: exactly where you stand.
Sources
U.S. Bureau of Labor Statistics, Employer Costs for Employee Compensation, December 2025.
Mployer 2025 and 2026 Employee Benefit Plan Design Study, covering 50,000+ employer plans.
Selection Sunday has just wrapped up. Brackets are officially out. March Madness has always been one of the few moments where everyone at work — finance, sales, HR, leadership — is talking about the same thing. And this year we thought: why not make it a little more meaningful for the HR and employer community?
Author:
Selection Sunday has just wrapped up. Brackets are officially out. March Madness has always been one of the few moments where everyone at work — finance, sales, HR, leadership — is talking about the same thing. And this year we thought: why not make it a little more meaningful for the HR and employer community?
So we launched the Mployer $1M Bracket Challenge and we want to give it to you.
It’s simple. Join our private ESPN group, submit your bracket, and follow along with weekly leaderboard updates.
If someone, somehow picks a perfect bracket, Mployer will contribute $1 million toward that person’s company employee benefits.
And if no one nails perfection, the best overall bracket still wins $1,000.
This isn’t meant to be serious. It’s meant to be fun. But it does highlight something that is very real for employers right now.
Employee benefits costs keep climbing. Across the U.S., employer health costs continue to rise faster than inflation and wages. The average cost of employer-sponsored health insurance now exceeds $17,000 per employee per year according to recent employer surveys. (Mercer)
Family coverage is even more dramatic. The average annual premium for employer-sponsored family coverage reached nearly $27,000 in 2025, with employers covering the majority of that cost. (KFF Files)
And the trend isn’t slowing down. Many employers are projecting health plan cost increases of roughly 8%+ in the coming year, some of the steepest growth seen in more than a decade. (Mercer)
For HR leaders and benefit teams, that reality shows up every year during renewal season.
How do you keep offering competitive benefits?
How do you protect employees from rising out-of-pocket costs?
How do you design plans that actually support your people strategy while managing budgets that keep expanding?
That’s the problem Mployer exists to help solve.
Our goal is to create more transparency for employers into their benefit plans so they can lower costs and design plans that better support their people strategy.
But sometimes it’s also good to step back and do something that simply brings the employer community together.
That’s what this bracket challenge is about.
It’s a chance for HR leaders, benefits teams, and employers across the country to join the same pool, follow the same leaderboard, and root for their picks together during one of the most fun sports tournaments of the year.
And who knows, maybe someone in HR finally cracks the code and picks the perfect bracket.
If that happens, we’ll happily write the $1M contribution toward their company’s employee benefits.
Until then, we’ll be watching the leaderboard every day with everyone else.
If you’re an employer, join the challenge and submit your bracket.
One bracket per person. Unlimited participation per company.
We are hoping your bracket is the one that prevails!
Employee benefits have never mattered more. In a labor market shaped by rising healthcare costs, changing workforce expectations, and increased transparency, employers are under pressure to offer programs that truly support their people. That’s exactly why the Mployer Benefits Award exists. The award isn’t based on opinions, sponsorships, or self-reported marketing claims. It’s built on independent data, consistent scoring, and a clear definition of what “great benefits” actually look like in today’s market.
Author:
Inside Mployer’s Benefits Award Methodology
Employee benefits have never mattered more.
In a labor market shaped by rising healthcare costs, changing workforce expectations, and increased transparency, employers are under pressure to offer programs that truly support their people.
That’s exactly why the Mployer Benefits Award exists.
The award isn’t based on opinions, sponsorships, or self-reported marketing claims. It’s built on independent data, consistent scoring, and a clear definition of what “great benefits” actually look like in today’s market.
This post pulls back the curtain on:
How Mployer determines top-tier benefits
What happens behind the scenes in scoring
Why independent validation matters for employers
How Mployer Determines Top-Tier Benefits
At the core of the Benefit Award is a simple principle: great benefits should be measurable.
Mployer evaluates employer-sponsored health plans using the largest, independent dataset available that reflects real plan design, cost structures, and coverage value across the market. Instead of relying on surveys or subjective rankings, the methodology compares each employer’s offering directly against relevant peers.
This allows Mployer to answer critical questions like:
How competitive is this plan compared to similar employers?
Are employees receiving meaningful financial protection?
Does the structure promote long-term affordability and access to care?
Employers who earn Gold or Platinum recognition aren’t just “good for their size.” They are delivering objectively strong value within their competitive landscape.
Behind the Scenes: From Data to Recognition
Behind every Mployer Benefits Award is a structured, data-driven evaluation designed to turn complex benefit information into clear, trustworthy recognition.
The process begins with real plan data by analyzing cost structures, coverage value, and employer investment across a large independent market dataset. Each employer’s benefits are then compared against relevant peers to determine how their offering truly performs in context, not just in isolation.
From there, Mployer applies a standardized scoring model that translates plan performance into an objective, comparable result. This ensures that recognition reflects measurable value delivered to employees, rather than marketing claims or subjective interpretation.
The final award levels are intentionally simple:
Gold recognizes employers delivering strong, competitive benefits that meaningfully outperform many peers.
Platinum represents the highest tier of benefits that provide exceptional value, protection, and investment relative to the market.
What makes this approach unique is its consistency. Every employer is evaluated using the same methodology, the same benchmarks, and the same independent data foundation.
The outcome is recognition employers, employees, and partners can trust because it’s earned through performance, not participation.
Why Independent Validation Matters
For years, employers have had limited ways to prove the strength of their benefits.
Most recognition programs are:
Self-submitted
Survey-based
Influenced by sponsorships or marketing participation
Mployer’s Benefits Award is different because it is independently calculated using real market data.
The Business Impact for Employers
Independent validation isn’t just about recognition, it delivers real strategic value.
Talent Attraction & Retention
Candidates increasingly ask: “How good are our benefits really?”
An objective award provides instant credibility and differentiation in a competitive hiring market.
Broker & Partner Alignment
Recognition signals that an employer’s benefits strategy is working, which strengthens relationships with advisors, carriers, and leadership stakeholders.
Confidence in Investment Decisions
Healthcare spending is one of the largest line items for employers. Independent scoring confirms whether that investment is translating into meaningful value for employees.
Raising the Standard for Employee Benefits
The broader mission behind the Mployer Benefits Award is simple: bring transparency and accountability to the benefits market.
When employers can clearly see how their plans compare, the entire system improves.
Better benchmarking leads to:
Smarter plan design
More efficient spending
Stronger employee outcomes
Recognition is just the visible result of a much bigger goal: making high-quality benefits the norm, not the exception.
See Where Your Benefits Stand
Whether an employer earns Gold, Platinum, or is still improving, the most important outcome is clarity. Because once you can measure benefits objectively, you can make them better.
Upload you plan documents to get your free benefit rating here: https://portal.mployeradvisor.com/employerprocess
Industries in the Hospitals subsector offer a variety of medical, diagnostic, and treatment services. This includes physicians, nursing, and other health services, providing both inpatient and outpatient medical care.From general medical and surgical hospitals to psychiatric and substance abuse hospitals, competition for qualified, competent employees has never been higher. However, staffing approaches can have a significant influence on benefits and structure, with some part time shifts being the norm. Additionally, a higher rate of females in child bearing age means a higher demand for quality short term disability benefits as well as maternity and paternity leave benefits. Oftentimes, additional education is required and student loan assistance may be a differentiator. Work related injuries can be more common as there is physical labor involved in many of the roles dealing with patient care.As active participants in the healthcare sector, those in this industry are likely to be somewhat higher users and have a higher general health education.
Author:
Industries in the Hospitals subsector offer a variety of medical, diagnostic, and treatment services. This includes physicians, nursing, and other health services, providing both inpatient and outpatient medical care.
From general medical and surgical hospitals to psychiatric and substance abuse hospitals, competition for qualified, competent employees has never been higher. However, staffing approaches can have a significant influence on benefits and structure, with some part time shifts being the norm. Additionally, a higher rate of females in child bearing age means a higher demand for quality short term disability benefits as well as maternity and paternity leave benefits. Oftentimes, additional education is required and student loan assistance may be a differentiator. Work related injuries can be more common as there is physical labor involved in many of the roles dealing with patient care.
As active participants in the healthcare sector, those in this industry are likely to be somewhat higher users and have a higher general health education.
The Hospital Industry Employment Summary
There are about 7,000 hospitals nationwide, employing over 6 million people. Each hospital is quite large, with an average of 855 staff, and the industry is female-dominated, with only 26% of employees identifying as male. The median employee age is 42 years old.
Hospital Industry Benefits Comparison
72%
What percentage of hospitals offer medical insurance?
72% of hospital employers offer their employees access to medical insurance. This is above the national average of 69%.
These businesses provide an average monthly employer premium of $1,118 for family coverage. This is in line with the national average of $1,121.
Additionally, these businesses provide an average monthly employer premium of $484 for individual coverage. This is also right in line with the national average of $458
37%
What percentage of hospitals offer short and/or long-term disability insurance?
37% of hospitals offer short-term disability insurance, and 39% provide a long-term disability option. This is lower than the national average of 42% and 34%, respectively.
60%
What percent of hospitals offer life insurance?
60% of hospitals offer life insurance coverage. This is slightly above the national average of 56%.
26%
Do hospitals provide access to paid family leave?
26% provide access to paid family leave. The national average is 20%.
91% provide access to unpaid family leave. The national average is 88%.
67% offer consolidated leave plans. The national average is 44%.
Summary
Generally speaking, hospital employers are in line with the national standard for providing all-inclusive hospital employee benefits packages. There are a few opportunities for improvement, such as providing more in-depth short-term and long-term employee benefits packages and increasing the number of paid vacation days. Once these adjustments are made, hospitals will notice how strong benefits packages are a prime factor in attracting staff and retaining them in the future.
As Mployer continues to grow, our visual presence needs to grow with it. For 2026, we redesigned our award badges to better reflect the credibility and trust behind the recognition they represent. The new designs use platinum and gold to add hierarchy and clearly differentiate rankings at a glance, making them easier to understand and more effective in real-world use. The result is a cleaner, more premium look that reinforces the value of the data and insights behind every badge.
Author:
As Mployer continues to grow, our visual presence needs to grow with it. For 2026, we redesigned our award badges to better reflect the credibility and trust behind the recognition they represent. The new designs use Platinum and Gold to add hierarchy and clearly differentiate rankings at a glance, making them easier to understand and more effective in real-world use. The result is a cleaner, more premium look that reinforces the value of the data and insights behind every badge.
The new badge design is part of a broader effort to create a more cohesive Mployer brand. As our platform, reports, and Insights+ offerings continue to evolve, it’s important that every touchpoint feels connected and intentional. These badges now align more closely with our overall visual system, reinforcing recognition and trust wherever Mployer appears.
While the look of the badges has evolved, the foundation behind them has not. The methodology, data quality, and standards used to determine each award remain exactly the same, and the definitions of “Great” and “Top” categories are unchanged. The redesign simply brings the visual expression of the award in line with the rigor and credibility that have always defined Mployer recognition.
A Quick Reminder: What Mployer Awards Measure
Every Mployer award is rooted in independent, data-driven benchmarking.
We evaluate an employer’s full benefits investment, not just medical coverage. That includes:
Medical plans
Ancillary benefits (dental, vision, life, disability, and more)
Leave and PTO
Retirement benefits
Each plan is benchmarked against a custom cohort of similar employers, matched by:
Industry
Company size
Geography (region and state)
From there, plans are force-ranked to determine where they truly sit in the market - no surveys, no opinions, no pay bias.
This allows us to answer a simple but powerful question:
How strong are your benefits compared to employers like you?
Introducing New Tiers: Gold and Platinum
With the badge update, we wanted the visual system to match how people already think about excellence.
That’s why we now use:
Gold to represent Market-Leading and Market-Competitive Benefits
Platinum to represent Top Benefits
Here’s what that means in practice.
Gold: Great Benefits (Market-Leading and Market-Competitive)
A Gold badge signifies that an employer’s benefits are materially above market.
These organizations:
Intentionally invest more than peers in benefits
Offer strong, well-rounded plans across multiple categories
Use benefits as a competitive advantage for hiring and retention
Platinum: Top Benefits
Platinum is reserved for the very top of the market.
Employers earning a Platinum badge:
Rank at the highest end of their peer group
Offer exceptionally rich, comprehensive benefits
Often exceed industry norms across medical, leave, and retirement
Treat benefits as a long-term investment in people
Why This Matters
Benefits are hard to explain, and even harder for employees and candidates to compare.
Our updated badges are designed to:
Instantly communicate where your benefits stand
Reinforce trust through independent validation
Make benefits easier to talk about internally and externally
Help employers show that they invest in their people
The redesign prioritizes clarity and legibility across all of these environments, ensuring the badge reads quickly and holds its credibility whether it’s seen on a website, in a LinkedIn post, or embedded in a presentation.
.svg)
.jpg)
.jpg)


.jpg)


.svg)
.svg)
.svg)
.svg)