Health Insurance Trends
The PBM Challenge in Today's Market
With Mployer's Insights+ platform, employers can now evaluate their 401(k) offering with the same rigor as salary benchmarking, leading to a powerful edge in recruiting and retention.
June 16, 2025

The PBM Challenge in Today's Market

(An easy to understand guide)

Prescription drug costs have surged dramatically in recent years, placing increasing strain on employer-sponsored health plans. Between 2000 and 2020, retail prescription drug spending in the U.S. nearly doubled (a 91% increase) and continues to climb—outpacing most other healthcare cost categories. The rise stems from two primary factors: expensive new specialty therapies (like weight-loss and biologic treatments) and the opaque role of Pharmacy Benefit Managers (PBMs) in setting prices. What makes matters worse is that Americans pay dramatically more than people in other high-income nations—U.S. drug prices average 2.78 times higher than in 33 comparable countries, and brand-name drugs can cost more than four times as much. This steep cost trajectory and global overpayment emphasize why understanding and managing PBMs has become essential for employers aiming to control healthcare spend and protect employees.

How PBMs Actually Work

When an employer designs its health plan, it either chooses a PBM directly or selects a carrier that already has a PBM embedded in its plan. From there, the PBM takes control of the prescription drug benefit. They build the formulary—the list of drugs that are covered—and negotiate with manufacturers to decide which drugs make the list. By narrowing coverage to certain products, PBMs gain leverage to demand better deals. They also restrict which pharmacies are in-network, again concentrating volume to maximize bargaining power.

This means PBMs effectively set the market, costs, and tiers employees experience: whether a drug falls into Tier 1 with a $10 copay or Tier 4 with a 25% coinsurance is dictated by the PBM’s design. On the back end, PBMs collect rebates from drug makers. A rebate is essentially a kickback payment from the manufacturer to the PBM, offered in exchange for favorable placement of a drug on the formulary or higher expected utilization. For example, if two similar drugs treat the same condition, the manufacturer willing to pay a higher rebate is more likely to have their drug chosen. Some portion of these rebates is passed back to the employer to lower plan costs, but a significant share is often kept by the PBM—one of the biggest transparency concerns in the system

How Drug Tiers and Payment Structures Work

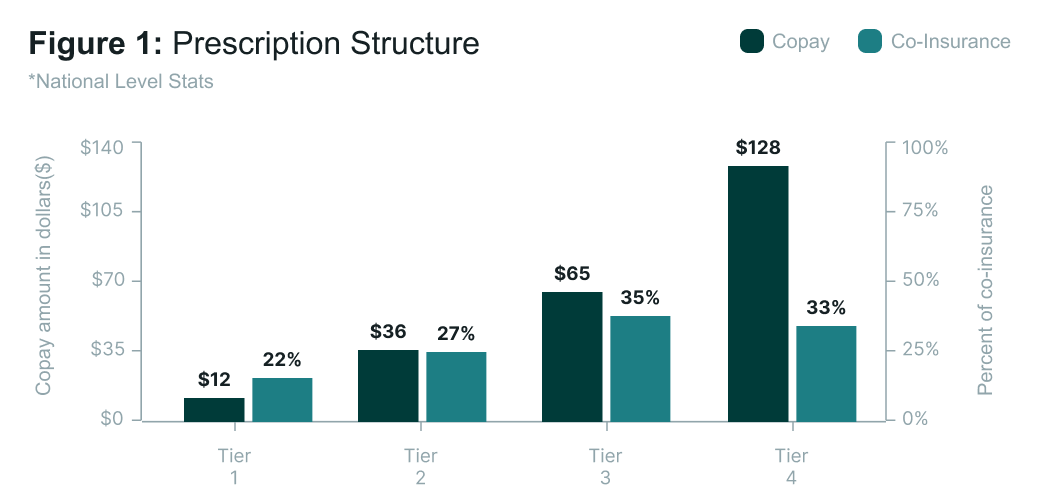
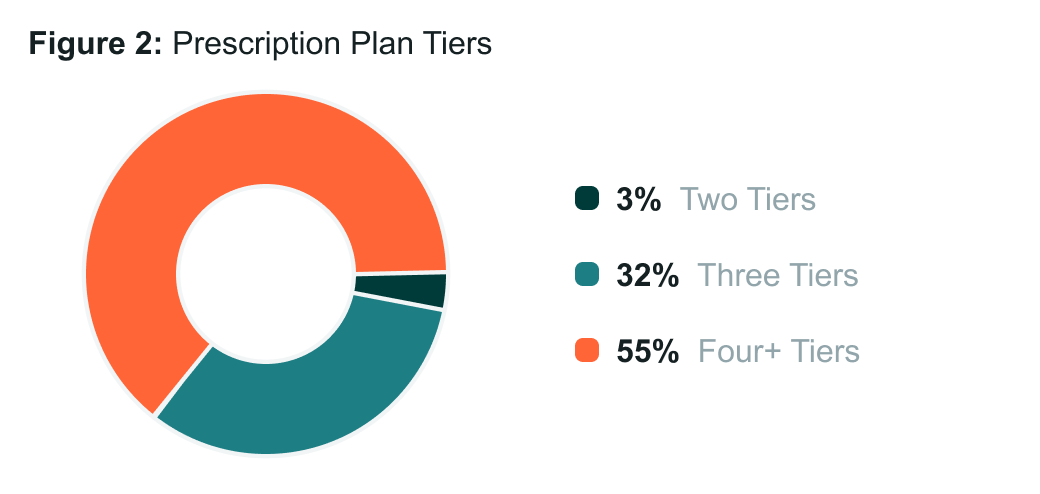
Most employer health plans organize prescription coverage into tiers, which determine both access and cost-sharing for employees.

  • Tier 1 (Generics): Lowest-cost drugs, usually just a $10–$20 copay. They are widely accessible and often encouraged as first-line therapy.
  • Tier 2 (Preferred Brands): Brand-name drugs that PBMs have negotiated discounts on. Employees typically pay $30–$50 copays or around 20% coinsurance.
  • Tier 3 (Non-Preferred Brands): Higher-cost brand drugs not favored on the formulary. Employees may owe 40%+ coinsurance, leading to hundreds in out-of-pocket costs.
  • Tier 4 (Specialty Drugs): High-cost therapies for serious conditions like cancer or hemophilia. These usually require coinsurance (20–30%), which can mean thousands of dollars per month. Although they make up less than 2% of prescriptions, specialty drugs drive nearly half of total drug spending.

Copays vs. Coinsurance

  • A copay is a fixed, predictable dollar amount per prescription.
  • Coinsurance is a percentage of the total drug cost until the deductible or out-of-pocket maximum is reached. While it helps share costs, it creates unpredictability—especially for specialty drugs, where 25% coinsurance could mean $250 on a $1,000 medication or much more on therapies costing thousands each month.

For employers, understanding how tiers and cost-sharing are structured is critical, since they directly affect both plan expenses and employee affordability.


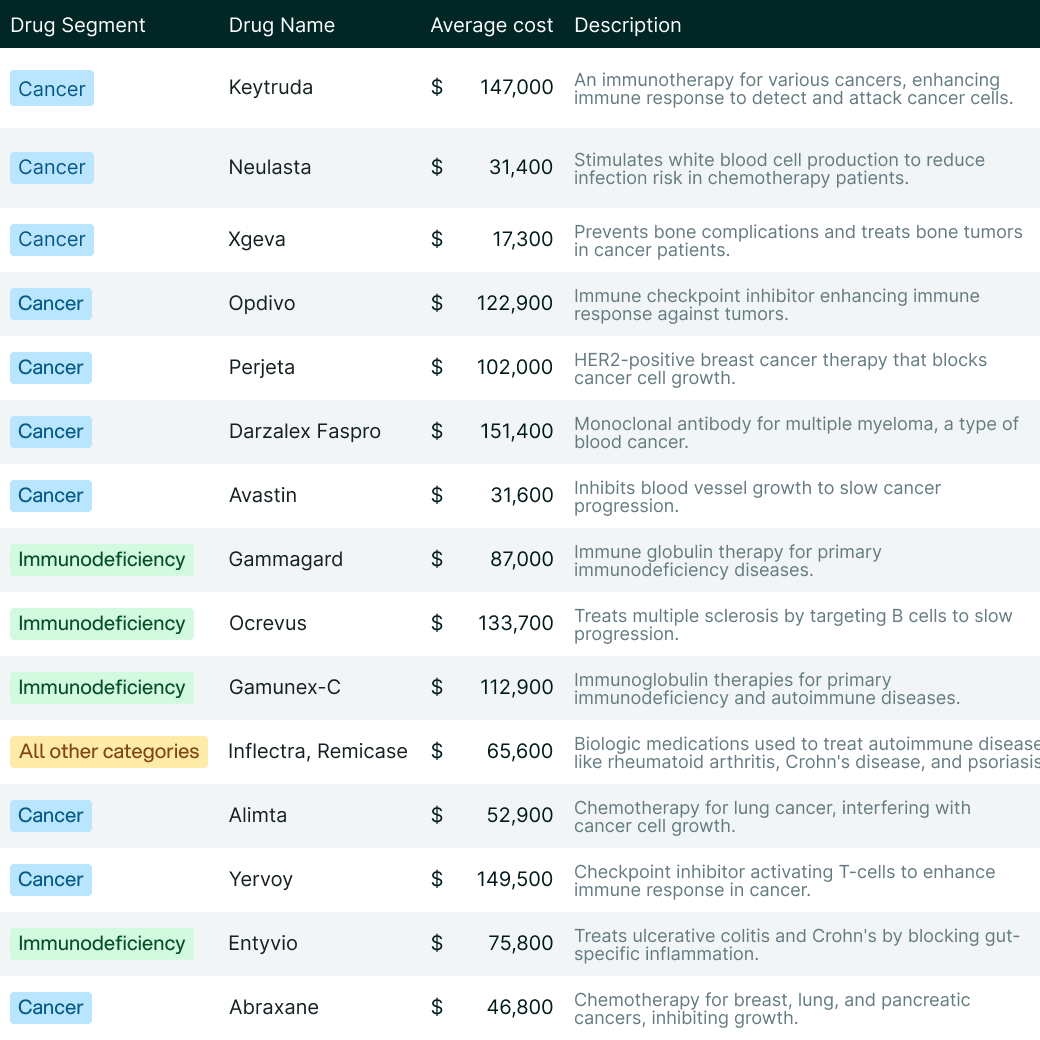
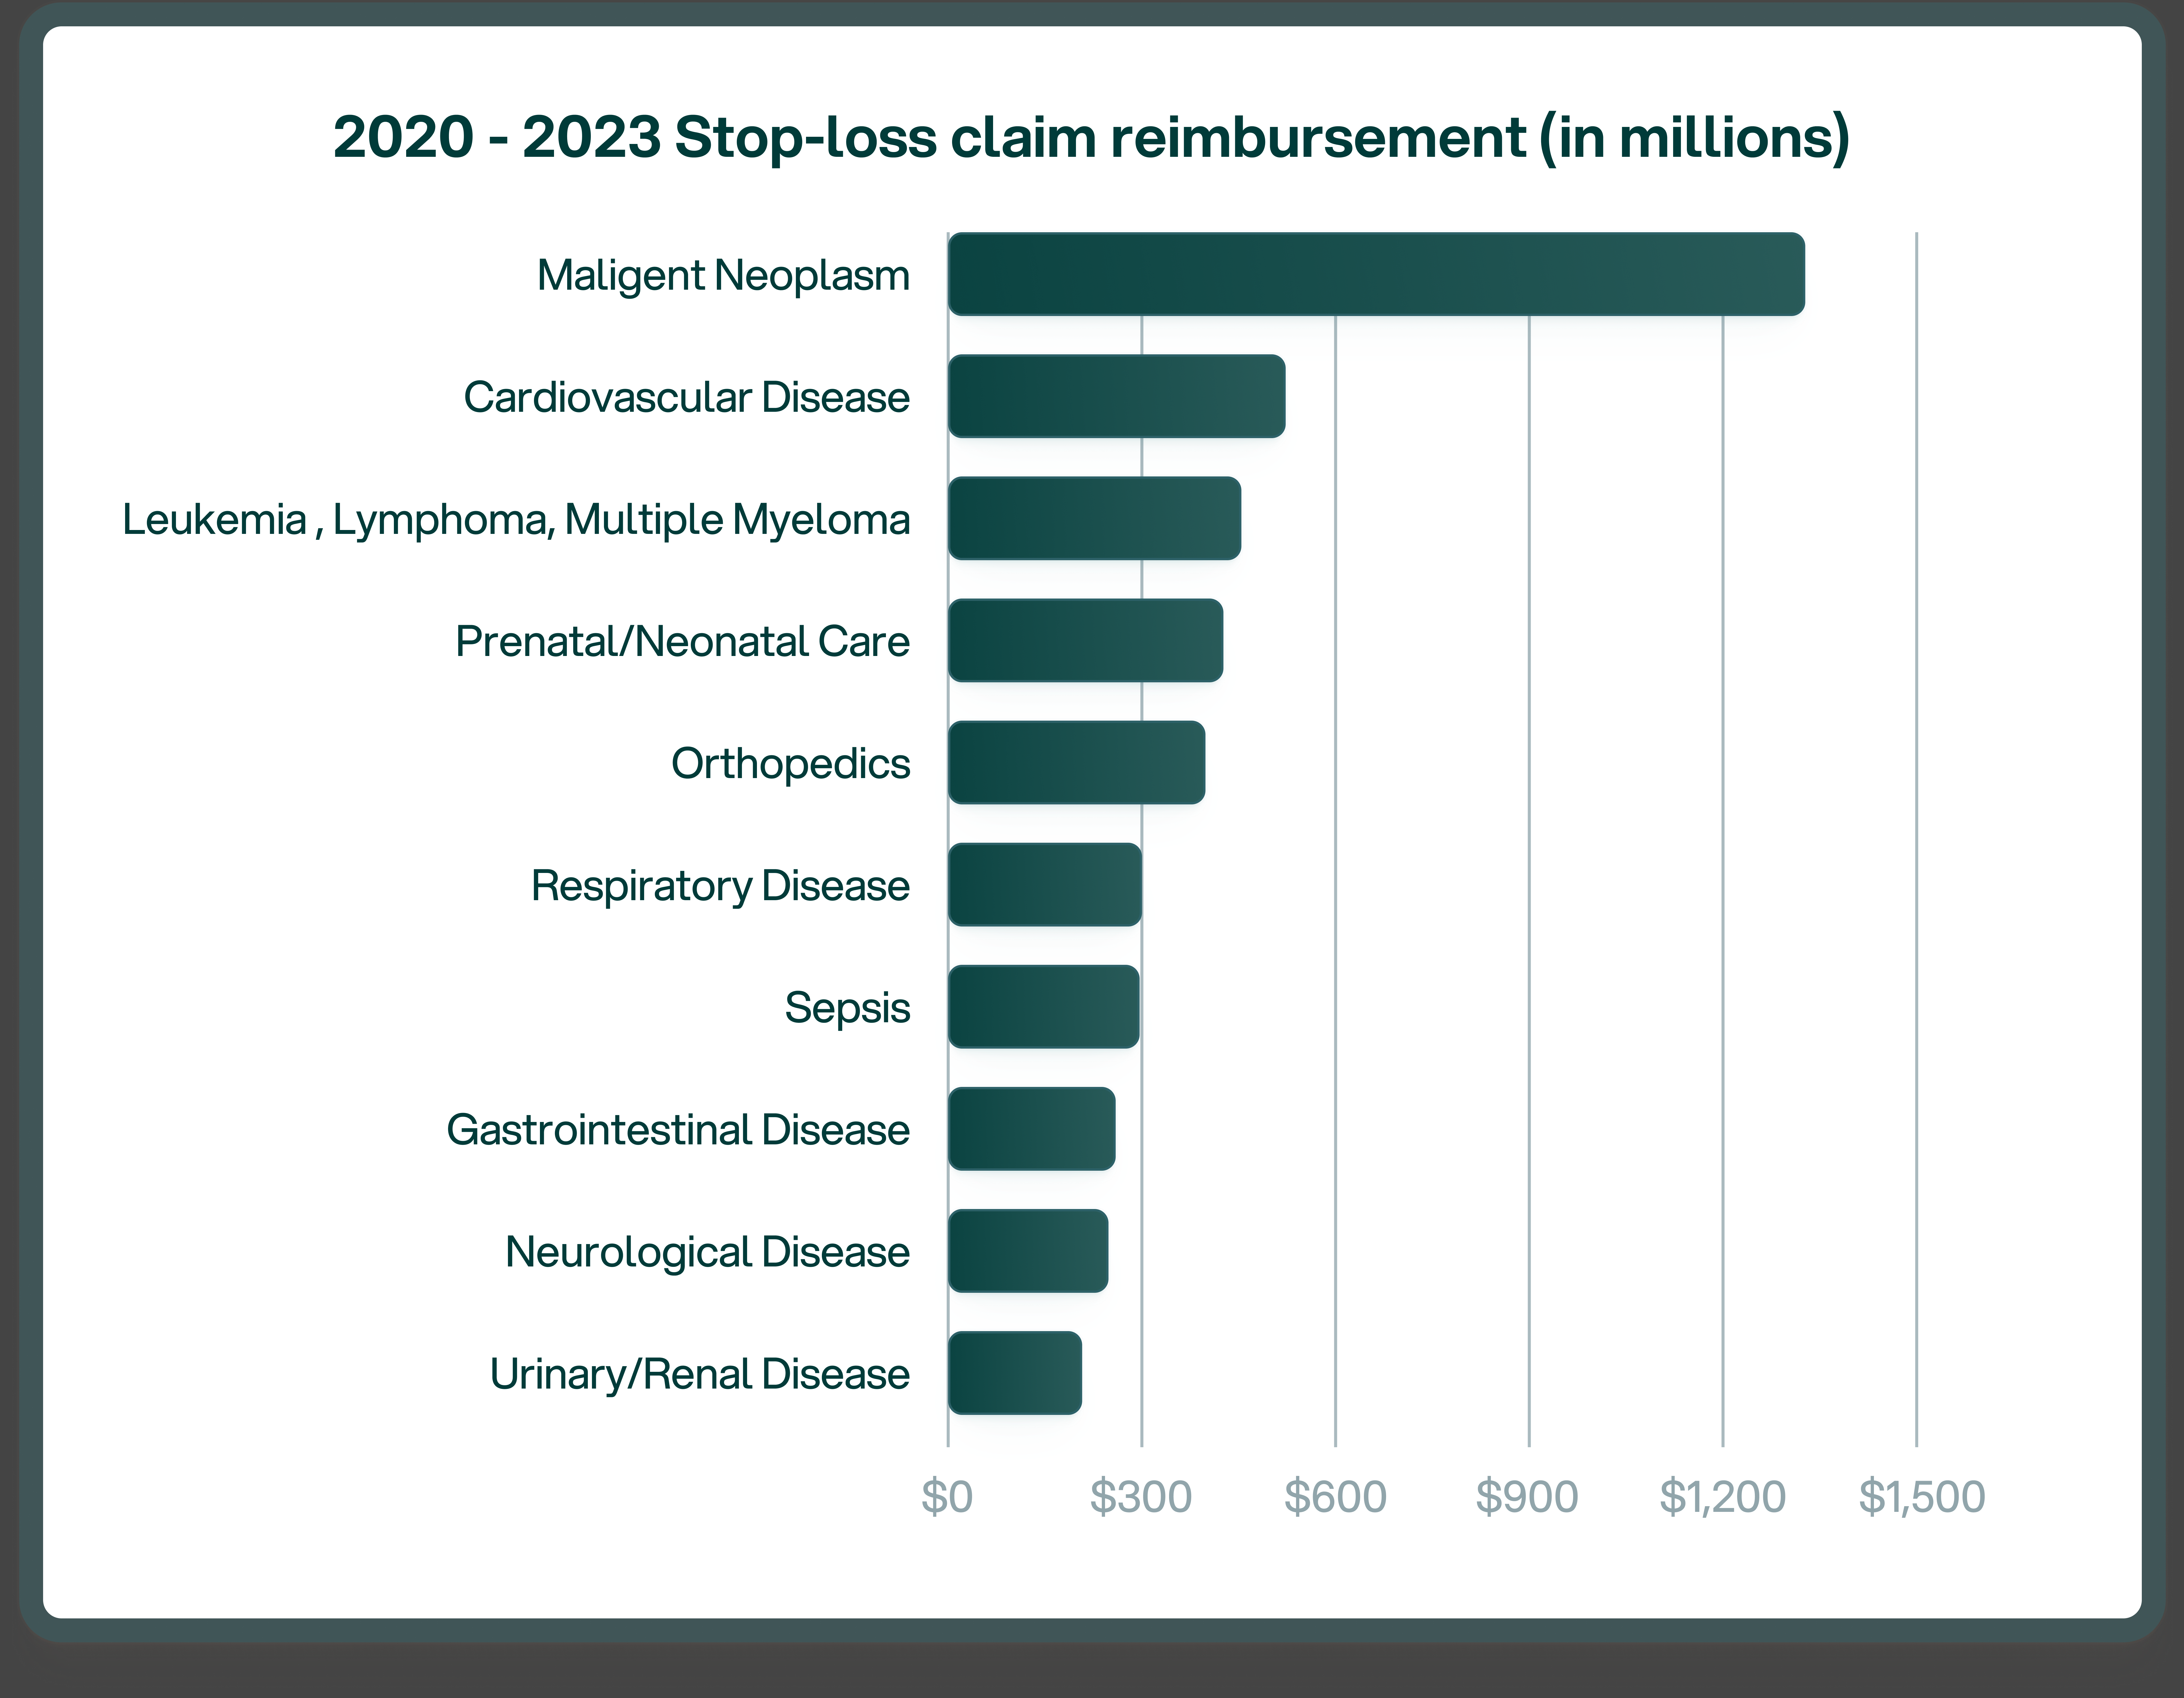
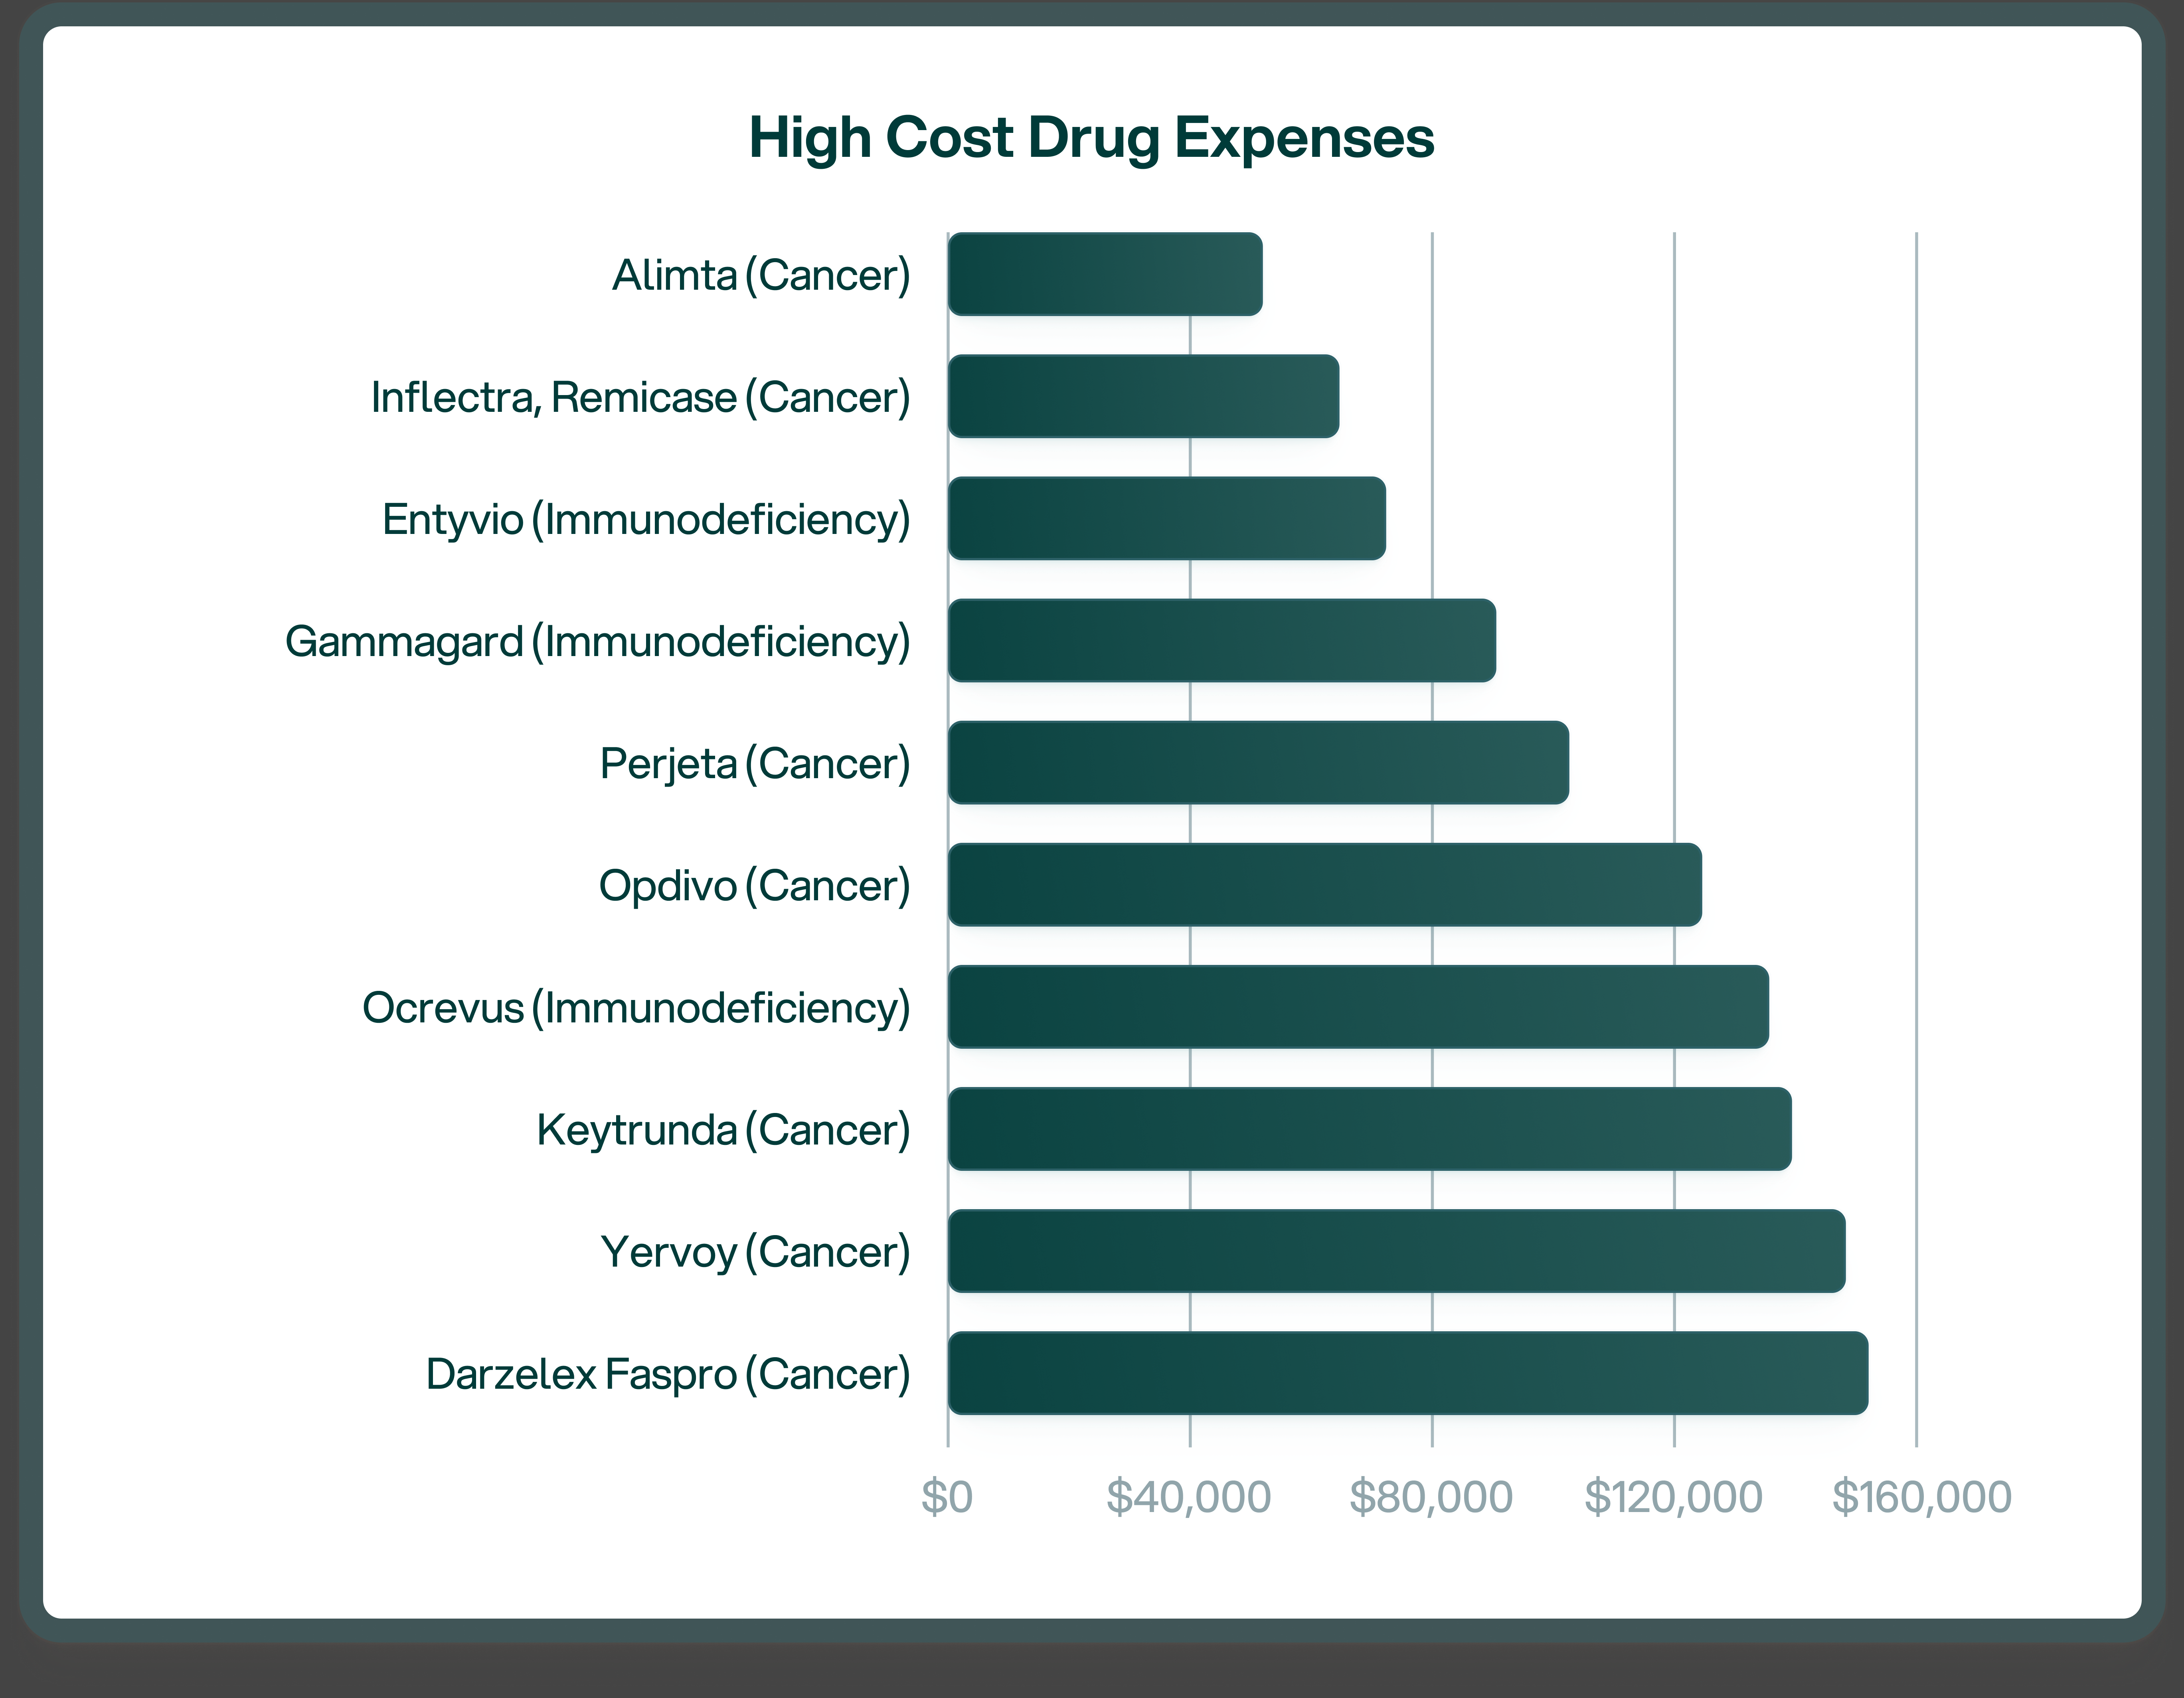
High-Cost Drugs and Their Outsized Impact

While high-cost drugs represent only a small fraction of total prescriptions, their impact on employer health plans is staggering. Specialty medications—such as those for cancer, hemophilia, and autoimmune disorders—account for less than 2% of prescriptions but drive close to 50% of all drug spending. Their costs have grown at double-digit rates year over year, fueled by new biologics, gene therapies, and infusion-based treatments that can run into hundreds of thousands of dollars annually. According to Sun Life’s High-Cost Claims Report, in many catastrophic claim categories like hemophilia or leukemia, prescription drugs make up more than 90% of the total cost of care. For employers, this means a single claimant on a specialty drug can dramatically shift overall plan spend, making pharmacy benefits one of the most volatile and financially significant areas to manage.

How Carriers Handle High-Cost Drugs

Carriers cover most FDA-approved specialty drugs but tightly manage access and cost. They use formularies to decide which drugs are included (and on what tier), require prior authorization or step therapy before approving treatment, and often restrict dispensing to their own specialty pharmacy networks. Coverage is generally limited to drugs deemed medically necessary, while experimental or non-formulary drugs are excluded unless appealed. For employees, this can mean higher coinsurance, delays in approval, and fewer choices on where prescriptions can be filled.

Who Controls the PBM Market—and Who’s Challenging It

Today, most carriers are tied to the “Big Three” PBMs, which together control more than 75% of the market:
  • Aetna/CVS → CVS Caremark
  • Cigna → Express Scripts
  • UnitedHealthcare → OptumRx
  • Anthem/Blue Cross (varies by region) → Caremark or Express Scripts

This consolidation means that for many employers, pharmacy benefits are automatically bundled with one of these large PBMs, leaving little room for visibility or flexibility.  

The remaining 25% is made up of disruptors offering more transparent models. Players like SmithRx (pass-through pricing with detailed reporting), MedOne (independent PBM with customizable formularies and full rebate pass-through), and Mark Cuban’s Cost Plus Drugs (a direct-to-consumer model selling drugs at cost plus a small margin) are challenging the status quo. For employers, knowing which PBM their carrier relies on—and whether a carve-out to one of these disruptors is possible—can be a critical step in controlling pharmacy costs.

Legislation and Reform Efforts

In recent years, lawmakers have increasingly targeted the opaque practices of PBMs, introducing multiple federal bills like the Pharmacy Benefit Manager Transparency Act (S. 127, 2023) and the PBM Transparency Act of 2025 (S. 526). These aim to ban spread pricing, require full rebate pass-through, and mandate detailed reporting—but none have passed into law yet. Similarly, a 2025 House bill dubbed the PBM Reform Act proposes greater transparency around Medicare Part D contracts and delinking PBM compensation from drug prices, but it remains pending in committee.

At the state level, all 50 states have enacted some degree of PBM regulation. Few states have gone further: for example, Iowa is considering a law imposing minimum pharmacy dispensing fees, and Arkansas passed legislation curbing PBMs’ ownership of pharmacies—though that law has been temporarily blocked by a federal judge

In short: there's plenty of activity at both federal and state levels—but no sweeping reforms have become law yet, leaving employers to manage PBM challenges proactively on their own.

Be Educated: Key Questions to Ask Your Broker

  1. Who is our PBM, and is it bundled with our carrier?
  1. Do we receive 100% of rebates, or are they retained?
  1. Can we carve out our PBM given our size and funding model?
  1. Which high-cost drugs are driving our spend?
  1. Do we get claim-level reporting from our PBM? (often not)
  1. What specialty drug management strategies are in place?
  1. How does our plan compare to industry peers?

Closing Thoughts

Prescription drug costs are no longer a side issue—they’re a central driver of employer healthcare spend. The combination of high-cost specialty therapies and the opaque role PBMs play in setting formularies, controlling access, and managing rebates makes this one of the most complex and consequential areas of benefit management. For employers, the path forward starts with awareness: knowing which PBM you’re tied to, how rebates flow, which drugs are shaping your spend, and what levers you have to push for transparency or carve out alternatives.

While legislation at the federal and state levels may eventually bring more clarity and accountability to the PBM market, employers cannot afford to wait. By asking sharper questions, exploring disruptive PBM models, and partnering with brokers who understand this space, employers can take meaningful steps today to control costs and support employees more effectively.

Bottom line: Prescription drug costs are only going up. Employers that engage now—by digging into the details and holding PBMs and carriers accountable—will be best positioned to protect both their budgets and their people.

Employee Benefits
Mployer Launches Sun Life Stop-Loss Data Integration
Mployer Launches Sun Life Stop-Loss Data Integration, Enhancing Access to Stop-Loss Insights for Leading Consultants & Employers. This partnership introduces Sun Life’s multi-year claims analytics, including detailed stop-loss patterns, trends in high-cost conditions and high cost drug utilization, directly into Mployer’s benchmarking and reporting features. With this addition, consultants and brokers can better anticipate risk patterns and deliver stronger, data-driven guidance to clients.
May 22, 2025

FOR IMMEDIATE RELEASE 

Mployer Launches Sun Life Stop-Loss Data Integration, Enhancing Access to Stop-Loss Insights for Leading Consultants & Employers 

Nashville, TN – May 22nd, 2025

Mployer, the nations’ leading employee benefit ratings platform, has partnered with Sun Life U.S. to bring expanded stop-loss analytics into its Mployer Insights platform — giving leading consultants, brokers and employers more powerful tools to navigate rising healthcare costs with clarity.

This partnership introduces Sun Life’s multi-year claims analytics, including detailed stop-loss patterns, trends in high-cost conditions and high cost drug utilization, directly into Mployer’s benchmarking and reporting features. With this addition, consultants and brokers can better anticipate risk patterns and deliver stronger, data-driven guidance to clients. 

“Mployer and Sun Life are partnering on new ways to bring valuable stop-loss information and other cost-containment strategies into the hands of employers and leading brokers,” said Brian Freeman, CEO at Mployer. “We are excited to work with leading benefits advisors supporting their work in turning complex claims trends into smarter strategies for their clients.”

The new Sun Life-powered features are available now, with more updates and data expansions to follow later this year. 

“This partnership strengthens our mission to provide clear, actionable insights that help brokers guide their clients through complex healthcare and benefit decisions,” said Brian Freeman, CEO at Mployer. 

The updated Insights platform is available now, with additional data sources and enhancements planned throughout 2025. To access sample reports or request more detail, go to MployerAdvisor.com.  

About Mployer

Mployer is redefining the industry standard for benefits analytics by empowering employers, employees, and benefits consultants to easily assess, rate, and communicate the value of employee benefits. Driven by rising employer costs and increasingly competitive hiring markets, Mployer brings transparency to an industry that affects the over 160 million Americans on employer-sponsored health plans. 


About Sun Life 

Sun Life is a leading international financial services organization providing asset management, wealth, insurance and health solutions to individual and institutional Clients. Sun Life has operations in a number of markets worldwide, including Canada, the United States, the United Kingdom, Ireland, Hong Kong, the Philippines, Japan, Indonesia, India, China, Australia, Singapore, Vietnam, Malaysia and Bermuda. As of December 31, 2024, Sun Life had total assets under management of C$1.54 trillion. For more information, please visit www.sunlife.com. 

Sun Life Financial Inc. trades on the Toronto (TSX), New York (NYSE) and Philippine (PSE) stock exchanges under the ticker symbol SLF. 

Sun Life U.S. is one of the largest providers of employee and government benefits, helping approximately 50 million Americans access the care and coverage they need. Through employers, industry partners and government programs, Sun Life U.S. offers a portfolio of benefits and services, including dental, vision, disability, absence management, life, supplemental health, medical stop-loss insurance, and healthcare navigation. Sun Life employs more than 8,500 people in the U.S., including associates in our partner dental practices and affiliated companies in asset management. Group insurance policies are issued by Sun Life Assurance Company of Canada (Wellesley Hills, Mass.), except in New York, where policies are issued by Sun Life and Health Insurance Company (U.S.) (Lansing, Mich.). For more information visit our website and newsroom. 

Employee Benefits
How To Know If You Offer Competitive Benefits
Job candidates and employees alike often want to know whether their benefits are ‘good’, but employers typically don’t have a particularly accurate understanding of how their benefits offerings compare with competitors' offerings.
May 18, 2025

Key Takeaways

  • Most employees drastically underestimate the value of their benefits—valuing them at $11,200 on average vs. a true value of $23,200
  • Employers lack a clear, credible way to showcase the value of their benefits or compare against the market
  • Proving you offer competitive benefits lead to lower voluntary turnover, shorter time to fill roles, and a 9X increase in quality applicants
  • Mployer’s Insights+ platform uses a proprietary, data-backed scoring methodology to benchmark your benefits across the four core pillars of employee benefits – medical, ancillary, leave and retirement
  • With access to the largest benchmarking dataset in the industry, Insights+ enables custom cohort comparisons and ratings by your by industry, region, and size
  • To see how your benefits compare to companies just like you, reply and let us know

The Perception Gap: Why Competitive Benefits Are a Strategic Advantage

Ask any employer if they offer competitive benefits, and you’ll likely get an awkwardly confident “yes.” But dig a little deeper—compared to who? Based on what? That’s where things break down immediately.

The reality is: employee benefits today are judged almost entirely based on perception, not proof.

Employees, on average, believe their benefits are worth about $11,200. In truth, employers are investing nearly $23,200 per employee per year per Mployer’s Insights+ 2025 study across companies representing over 1M employees. That’s a massive gap in perceived value—and one that significantly undermines retention, recruiting, and engagement.

When you can prove that your benefits are competitive—not just internally, but compared to your true market—you unlock a measurable strategic advantage:

  • Lower voluntary turnover
  • Faster time to fill roles
  • 9X improvement in qualified applicants

But proving benefit competitiveness takes more than guesswork or gut feel. That’s why we built Insights+—a first-of-its-kind platform that turns perception into data-backed proof.

Shape

Introducing Insights+: The Industry Standard for Benefits Benchmarking

At Mployer, we’ve spent years building Insights+ in partnership with the top insurance brokerages in the country. It’s the most advanced, statistically accurate benchmarking system on the market, designed to give employers a true understanding of their benefits competitiveness.

Here’s how it works:

  • We ingest your benefits guide or a quick intake form
  • Our engine scores your plan across four core components (more on that below)
  • We benchmark your plan against a custom peer group of employers like you, same industry, region and size —not a generic industry average.
  • You receive a full report and rating that you can share with your team, inclusive of:
    • An overall rating (it’s pretty great)
    • Strengths, weaknesses, and gaps
    • Comparison vs. peers on spending and participation
  • Plus, if your score ranks highly—you receive a recognition toolkit with ready-to-use materials for employee education, recruiting, and brand positioning

This isn’t a one-size-fits-all solution. It’s a proprietary methodology built on a 30,000+ employer dataset, kept current through direct employer uploads, broker partnerships, and more.

How We Score Benefits: The Four Core Components

Competitive benefits can’t be measured by a single number like "how much you spend" or whether you offer a 401(k). It takes a holistic view—and that’s what our four-pillar scoring system does.

These are the four foundational categories we use to assess the true competitiveness of a plan:

1. Medical

This includes everything from your monthly premiums to deductible levels, plan options, and employer contribution percentages. It’s typically the most expensive part of your benefits package—and the most scrutinized by employees. We evaluate depth of coverage, choice, affordability, and access and compare your plan to your cohort.

2. Ancillary

Dental, vision, disability, life and voluntary insurance fall here. Our methodology weighs plan richness, employer contribution for each individual line item. While often considered secondary, ancillary benefits play a big role in perceived value—and they’re a low-cost lever for improvement.

3. Leave

PTO, holidays, parental leave, and—critically—flexibility (remote, hybrid, compressed schedules). We evaluate not just what's offered, but how it compares to market expectations within your peer group. Leave policies are increasingly make-or-break in competitive industries.

4. Retirement

401(k), 403(b), ESOPs, and other savings mechanisms. We assess both participation structures (e.g., automatic enrollment, matching formulas) and actual dollar contributions compared to peers.

Our scoring system blends employee perception, plan design, cost, and participation data to generate a truly holistic and market-relevant evaluation.

No other system in the industry brings this level of depth, customization, and credibility.  Want to see how you compare? Let us know.

Benchmarking Against a Custom Peer Group

Forget comparing yourself to national averages or sample data from a survey two years ago. With Mployer, you benchmark against a precisely matched peer group.

We offer the largest and most granular dataset in the industry, covering over 30,000 employers and growing. This enables you to compare your benefits offerings against statistically valid cohorts based on:

  • 30+ Industries (from healthcare to logistics to tech)
  • 8 Organization Sizes (from <25 employees to 10,000+)
  • 8 U.S. Regions (ensuring geographic relevance)

Only with us can you create a peer group so tailored that it mirrors your recruiting market, reflecting what companies like yours—and hiring for the same roles—are doing.

Whether you’re a manufacturing firm in Ohio or a startup in Austin, your competitive landscape looks different. We ensure your comparison group matches reality, not abstraction.

Competitive Benefits as a Strategic Advantage

We say it often because it’s true: benefits are more than a cost center—they’re a strategic asset.

When your benefits are perceived as strong, you get:

  • More applicants (especially the ones you actually want)
  • Fewer people leaving for marginal improvements elsewhere
  • Stronger employee engagement and satisfaction

But all of that starts with knowing how you compare—and having the data to back it up.

Insights+ doesn’t just show you where you stand. It gives you the tools to improve, the proof to showcase what you already do well, and the recognition materials to ensure your benefits investment is seen and appreciated by the people who matter.

See How Your Benefits Stack Up

If you’re ready to move beyond guesswork and prove that your benefits are truly competitive, Insights+ is your next step.

You’ll get:

  • A customized, data-backed Benefits Competitiveness Score
  • Insights into where you're ahead or behind the curve
  • Benchmark comparisons across size, region, and industry
  • A recognition kit if you score well—complete with messaging tools, badges, and recruiting assets

Best of all? It’s free for employers to get started.

Let us show you what great benefits really look like—on paper, in practice, and in perception.

FREE Insights+ Reports For Qualifying Employers

Labor Market Insights
The Employment Situation for May 2025
The latest economic release from the Bureau of Labor Statistics reports that the U.S. job market added 177 thousand jobs last month while unemployment held steady 4.2%.
May 3, 2025

Editor's Note: This report is based on survey data from April 2025 that was published in May 2025. This is the most recent data available. (Source: Bureau of Labor Statistics)

The job market once again proved to be more resilient than economists were predicting, with US employers adding 177 thousand jobs over the course of April as the unemployment rate held steady at 4.2%.

That figure of 177 thousand new jobs significantly exceeds the approximate 135 thousand new jobs that economists had forecast and is on par with the prior month’s ultimate report of 185 thousand new jobs (revised down from an initially-reported and headline-grabbing 228 thousand new jobs).

The number of long-term unemployed people rose by about 180 thousand to reach 1.7 million people, which is an increase of almost 12%. Long-term unemployed people - those who have been out of work but seeking it for 27 weeks or more - account for almost one-quarter of all unemployed people. Long term unemployment has increased by more than one-third over the last 12 months, up from about 1.25 million in April of 2024.

There was little change across most other metrics over the course of the month, however, with the employment population ratio (60%), labor force participation rate (62.6%), the number of people working part time for economic reasons (4.7 million), and the number of people who want a job (5.7 million) all essentially holding steady over the month.

Of the 177 thousand net jobs added last month, the healthcare industry was responsible for the largest proportion, adding 51 thousand jobs over the course of April, which is just below the 52 thousand net new payroll entries averaged each month over the last 12. 

The transportation & warehousing industry had the next largest net job increase in April, increasing its ranks by abou 29 thousand, with the financial activities industry and the social services industry claiming the addition of 14 thousand net employees and 8 thousand net employees, respectively, as well.

While there was no significant change over the month in most other industries, federal government employment did register a noteworthy drop of 9 thousand employees, bringing the total number of net federal jobs lost in 2025 to 26 thousand, although that figure does not represent the entirety of the situation - more on that to come.

Average hourly pay rose by about 6 cents to an even $36.06 per hour (an increase of 0.2%) over the month while the increase was about 3.8% over the last year - up from $34.67 per hour for privately employed, non-farm workers. 

The length of the average workweek grew slightly over the month to 34.3 hours per week. 

Mployer’s Take

The headline story from the jobs report is the continued strength of the labor market even in the face of economic forces like the threat and/or implementation of sweeping global tariffs, but the labor market alone does not tell the entire story of the economic moment.

For one, the federal workforce reductions instituted by Elon Musk’s Department of Government Efficiency may be 10 times larger than the 26 thousand jobs that have so far registered in this data, but those numbers won’t show up until those employees severance/leave pay has expired. 

Even more importantly, the GDP dropped by .03% through the first 3 months of 2025, which is the first contraction of GDP in 3 years, and while looming tariffs and federal firings were certainly contributors, those factors are more likely to have an increasing influence over the economy as a whole in the coming months than a decreasing influence.

Still, despite the lag in capturing federal employees whose jobs were recently terminated in these data sets and despite the uncertainty surrounding both the tariffs and their impact, this jobs report indicates that employers are still carrying on hiring, which itself is a kind of vote of confidence for the continued resilience of the US economy.

Further, inflation is up only 2.3% from last year and the rate of increase is trending downward, which is another positive sign, yet many economists (and employers) remain pessimistic about our chances for avoiding economic downturn in the months ahead.

The Federal Reserve will soon be facing the decision again about what to do with interest rates, and although inflation is nearing the Fed’s stated target of 2% annualized inflation, in light of the potential inflationary pressure that tariffs are capable of producing, the Fed may be less eager to lower interest rates now than they otherwise may have been given the current inflation levels.

We’ll know more about the Fed’s short term plan for interest rates in just a couple days, but we are still a ways off from knowing the ultimate impact of tariffs and federal workforce restructuring. 

In light of the first quarter economic contraction, however, and in light of the fact that economic recession can be defined as two consecutive quarters of negative GDP growth, it’s entirely possible that the current economic conditions are retroactively labeled as a recession as soon as July, even with the labor market still humming along.

Check out the Mployer blog here.

HR Compliance
Legal/Compliance Roundup - May 2025
Each month, Mployer collects and presents some of the most relevant and most pressing recent changes in law, compliance, and policy in areas related to employee benefits, health care, and human resources.
May 1, 2025

Each month, Mployer collects and presents some of the most relevant and most pressing recent changes in law, compliance, and policy in areas related to employee benefits, health care, and human resources.

I-9 Form Update

US Citizenship and Immigration Services released a new I-9 form on April 2, 2025. Some of the updates include replacing the word “non-citizen” with “alien” and the word “sex” has replaced “gender.”

The previous I-9 forms - released on August 1, 2023 - remain valid until their listed expiration dates, in 2026 and 2027, respectively.

You can find the new forms here

State Updates

Tennessee: As of April 11, 2025, employers in Tennessee are required to pay out all owed earnings in the event of an employee’s death. Previously, Tennessee employers could cap those payments at $10,000. You can read more here

Washington: Beginning June 27, 2025, employees in Washington state will be permitted to use sick leave in order to address immigration-related issues. You can read more here.

The Washington state legislature has also updated several laws governing when minors are allowed to work, employee protections, health care worker rest breaks, and workplace safety measures in certain industries. You can find those bills here, here, here, and here, respectively.

Beginning July 27, 2025, Washington employers will no longer be able to require that employees have driver’s licenses unless driving is part of the job function and/or central to a legitimate business purpose. You can read more here.

As of May 1, 2025, minimum wage in the city of Bellingham, Washington increased to $18.66 per hour. You can read more here

Wisconsin: The Wisconsin Supreme Court ruled that state laws that protect job candidates and workers from arrest-record discrimination also apply to non-criminal offenses like civil violations. You can read more here

Colorado: Beginning July 1, 2025, Colorado employers that collect biometric data (e.g. fingerprints, retina scans, etc.) from employees and/or job candidates must follow the expanded guidelines laid out in the Colorado Privacy Act, which include implementing a written policy addressing biometric collection protocol and obtaining consent for the collection of biometric data. You can read more here

Beginning February 1, 2026 Colorado employers that use artificial intelligence to evaluate employees and job applicants will be required to take proactive measures to ensure that those platforms are not enabling discriminatory practices. You can read more here.

Massachusetts: Employers with more than 50 employees must post the new veterans services poster that was just released by the Massachusett Executive Office of Labor and Workforce Development. The poster must be conspicuously displayed in an area that is accessible to all employees. You can find the poster here

New York: As of  March 2, 2025, all New York employers are prohibited from requiring job applicants to provide a copy of their criminal history record, which closes a loophole employers had been exploiting to obtain such records despite restrictions regulating their access to those records.

As of March 22, 2025, all New York employers regardless of size are prohibited from requiring job applicants or employees from providing a copy of their criminal history report that was obtained via the New York State Division of Criminal Justice Services. 

Beginning May 8, 2025, NY employers with more than 3 employees must conspicuously post their lactation room accommodation policies and guidelines as well as the relevant state requirements both somewhere accessible by all employees and on the organization's intranet if applicable.

Beginning June 2, 2025, employers with 10 or more retail employees must have in place a written policy and training program for violence prevention measures and retail employers with 500 or more employees must install and/or maintain silent response buttons to alert authorities about emergencies. This legislation was originally slated to take effect March 4, 2025, But was amended to clarify employer responsibilities.

Further, as of January 1, 2025, New York employers are required to provide 20 hours of paid prenatal leave during a 52 week period. Also, as of the new year, the characteristics to which equal protection was extended via the New York State Human Rights Law and the resulting protections are formally enshrined in the New York State Constitution. Those characteristics include: age, disability, ethnicity, gender identity, gender expression, national origin, pregnancy, and anything else related to reproductive healthcare.

Oregon: As of January 1, 2025, Paid Leave Oregon provides leave for employees completing necessary legal steps associated with adopting and/or fostering children.

Minimum Wage For Federal Contractors Rescinded

On March 14, President Trump rescinded Executive Order 14026 - which Biden signed in 2021 and raised the minimum wage for federal contractors from $10.10 per hour to $15 per hour with mechanisms contained within the order to continue increasing this wage minimum over time. 

On January 1, 2025, in accordance with EO 14026, the minimum wage for federal contractors increased to $17.75 per hour, but now that Trump has rescinded EO 14026, it is unclear what the current minimum wage for federal contractors is.

You can read more here.

Alternative Manner For 1095-B & 1095-C Distribution

If your organization is using the alternative method for distributing 1095-B and 1095-C forms in accordance with the Paperwork Burden Reduction Act, your website must be in compliance from the first business day of March through at least October 15th. You can find guidance from the IRS about how to properly follow compliance protocols here.

DEI Executive Orders Paused

On February 21, 2025, a federal judge put a stay on Trump’s Executive Order limiting the ability of federal agencies and federal contractors to operate Diversity Equity and Inclusion programs. The court questioned whether the order violated free speech rights and potentially illegally restricted otherwise legal actions taken by private entities. You can find the decision here

Form 300A Submission Due

From February 1st to April 30th, non-exempt (low hazard) employers who had at least 11 employees at some point in 2024 must post in a conspicuous place a copy of OSHA Form 300A, Summary of Work-Related Illness and Injury, certified by a company executive.

For non-exempt employers that had 250 or more employees at some point last year and employers with 20 or more employees in specified high risk industries, OSHA requires electronic submissions, which are due by March 2nd, 2025. 

You can find the electronic submission platform here

Executive Orders

In his first days since returning to office, President Trump signed a series of executive orders dealing with labor and employment issues for federal employees and federal contractors, with more expected still to come.

While thus far these orders don’t apply to private employers in general - with the exception of those that accept federal funds and/or are federal contractors - these orders will not only affect a sizeable portion of the workforce directly, but they will also likely inspire some private employers to modify their practices and follow the example set by the executive branch.

The new rule that will most likely have the largest impact beyond the sphere of federal employees is Executive Order 11246, which makes it so that federal contractors no longer have to practice affirmative action in the hiring process for most protected classes. The only protected classes excepted from the order are veterans and individuals with disabilities, for whom affirmative action standards still apply. 

Although federal contractors will no longer be required to maintain affirmative action programs, Title VII of the Civil Rights Act remains in effect to prevent discrimination against protected classes like race, gender, sexual orientation, and national identity. 

You can read more here

Spence v. American Airlines

A Federal District Court Judge in Northern Texas ruled that American Airlines had breached its fiduciary duty by working with an investment manager that promoted ESG practices in a way that ran counter to the economic interests of the employee retirement fund beneficiaries.

The repercussions of this ruling could be industry-reshaping if upheld, although there were many additional conflicts of interest between American Airlines and their investment fund manager that may limit how broadly applicable the ruling will ultimately prove to be.

The judge has already found American Airlines in breach of their fiduciary duty, but he has yet to assess damages, which will influence the probability of appeal and the likelihood of copycat cases.

You can read more about this case here.

EAD Extension Formalized

As of January 13, 2025, the extension period for certain renewal Employee Authorization Document (EAD) applications filed on May 4, 2022 or later has been formalized at 540 days.

You can read more here.


IRS Mileage Reimbursement Rate Increased

As of January 1, 2025, the IRS mileage reimbursement rate for road miles driven for business purposes increased by 3 cents per mile from 67 to 70 cents per mile driven. 

PCORI Fee Increase

The IRS released a statement announcing a 25-cent increase in Patient-Centered Outcomes Research Institute fees for covered plan years ending on or after October 1, 2024, and before October 1, 2025. 

The new fee is $3.47 per covered life.

You can read more here

DOL Reinstates Simplified Tip Credit Rule

In response to a Federal Court of Appeals Decision that vacated the so-called 80/20/30 rule that was instituted in 2021, the Department of Labor officially reverted to the previous tip credit rule.

You can read more here.

Increased ACA Flexibility and Affordability Threshold

In the final days before Christmas a few weeks ago, the Employer Reporting Improvement Act both became law. 

As of January 1, 2025, the threshold for what qualifies as affordable coverage is now 9.02%, which means that an employee’s required contribution to the plan can be no more than 9.02% of their salary in order for the plan to be considered affordable and to avoid potentially paying the penalty. 

You can read more about the affordability threshold here.

EAP & Highly Compensated Exception Update

A federal court in Texas determined that the Department of Labor exceeded its authority last summer by increasing the minimum pay thresholds for employees to qualify under the executive, administrative, and professional and highly-compensated employee exceptions to minimum wage and overtime protections. 

Those minimum pay thresholds have reverted to their prior levels - back to $684 per week for the EAP exemption (down from $844 per week under the now defunct rule), and back to $107,432 per year for the HCE exemption (down from $132,964 per year under the now defunct rule). 

NLRB Says No Captive Audience Meetings on Unionization Issues

The National Labor Relations Board has issued a decision prohibiting employers from forcing employees under threat of punishment to attend meetings during which the employer will share views on unionization or its impacts. 

Employers are allowed, however, to convene employees and share their views on unionization and potential impacts so long as employees are not disciplined or adversely affected in any way for not attending (or leaving early). Employers should not even keep or maintain such attendance records.

You can read more here.

IRS Publishes 2025 Annual Retirement Plan Maximums

  • The 401(k) annual contribution limit increased from $23,000 to $23,500 in 2025.
  • The catch-up contribution limit stayed unchanged at $7,500 for participants aged 50 and over.
  • The SECURE Act 2.0 also instituted a new type of catch-up contribution, which enables participating people (age 60 to 63) to contribute up to $11,250 annually.

You can read more here

IRS Publishes 2025 Annual Benefit Maximums

  • The HFSA contribution max is $3,300 (maximum carryover is $650 for HFSAs with carryover features).
  • The QSEHRA max for total reimbursements is $6,350 for single coverage and $12,800 for family coverage.
  • The max employee tax credit for adoption assistance is $17,280, with additional conditions depending on employee salary range. 
  • The monthly parking and mass transit benefit max is $325. 

You can find the complete IRS 2025 benefit contribution limit list here.

ERISA Guidance for Long-Term Part-Time Employees

You can find guidance for ERISA 403(b) plan eligibility requirements for long-term, part-time employees according to the updated standards from the Secure ACT 2.0 here.

Health Insurance Trends
Employers’ Guide to Controlling High-Cost Healthcare Treatments & Conditions
Rising costs have been a chronic condition of the US healthcare system for decades, with out-of-pocket expenses adjusted for inflation approximately doubling over the last 50 years.
April 20, 2025

Key Takeaways

  • Nearly 9 out of 10 employers relied upon stop-loss insurance to cover a high-cost claim between 2029 and 2022.
  • The price of high-cost treatments was up 4.4% over the year in 2024, climbing to an average expense of about $421 thousand per claimant.
  • High-cost claimants typically make up less than 2% of plan membership but cost almost 30 times more than the average plan member, but there are many steps employers can take to better control costs associated with the most expensive conditions and treatments.

ARTICLE I Employers’ Guide to Controlling High-Cost Healthcare Treatments & Conditions

Rising costs have been a chronic condition of the US healthcare system for decades, with out-of-pocket expenses adjusted for inflation approximately doubling over the last 50 years.

Given that employers have largely been bearing the brunt of these increases while covering between about 67% and 85% of employee and employee family healthcare costs depending on the plan, it is especially understandable why many employers have been expressing an increasing urgency to get these costs under control.

As is often the case, however, better controlling healthcare costs is a task much more easily said than done, but one often overlooked place to find savings is improved management of particularly high-cost conditions, procedures, and pharmaceuticals, which are eating up an increasing proportion of employer healthcare budgets but also provide an opportunity for employers to make small changes that can have big, positive impacts on their bottom line.

High-Cost Claims By The Numbers

While there is no set definition of where to draw the line between regular health insurance claims and high-cost claims, just about half of surveyed employers (44%) define high-cost claims as those that cost $100 thousand or more.

According to data from Sun Life, between 2019 and 2022 there was an 87% chance that an employer would encounter a claim so expensive that it exceeded the threshold triggering stop-loss insurance in any given year.

An even greater proportion of employers (94%) expect to see an increase in high-cost claims over the next 3 years and 84% view high-cost treatments as a threat to their business, which are reasonable forecasts given that the number of health plan claims of $3 million or more than doubled between 2016 and 2020, and that was before the healthcare system absorbed the COVID shock and the associated spike in inflation.

According to the National Alliance of Healthcare Purchaser Coalitions, the cost of high-cost treatments was up 4.4% over the year in 2024, climbing to an average expense of about $421 thousand - an average that is in part inflated by extremely high-cost new treatments/technologies (i.e. ~$7 million gene therapy) as well as the longevity-increasing impacts of improved treatments/technologies that can abate chronic conditions over longer periods of time (e.g. $60 thousand per month cancer drugs).

Perhaps most concerning, high-cost claims are on the rise among the younger demographics which employers and insurers rely upon to pay more into the system than they take out in order for the system to remain solvent.

Historically, only 1.2% of plan members are high-cost claimants, but they cost about 29 times more than the average plan member, amounting to an average annual expense per high-cost claimant of about $122 thousand.

FREE Insights+ Reports For Qualifying Employers  

Highest-Cost Conditions/Treatments

Over the last 4 years, the conditions that have resulted in the greatest number of high-cost claims include malignant neoplasm, cardiovascular system issues, cancer, prenatal/neonatal care, musculoskeletal problems, respiratory issues, sepsis, gastrointestinal conditions, neurological problems, and urinary/kidney diseases.

The list grows even smaller when looking at the types of conditions/treatments responsible for the largest number of $1 million plus claims, such as sepsis, cancer, prenatal/neonatal, and cardiovascular disease.

Cancer:

  • Cancer is one of the most complex diagnoses, often requiring coordinated care from a number of different providers.
  • Improved cancer-fighting treatments can significantly increase longevity but also come with significantly increased costs, improving the relative ROI for prevention.
  • How can Employers reduce cancer-related costs?
    • Invest in cancer prevention efforts by prioritizing and rewarding both healthy lifestyle behaviors and early cancer screenings.
    • Offer employees help coordinating care and navigating the often confusing healthcare system by supplying case management assistance.
    • Consider exploring various new initiatives and cancer treatment pilot programs in order to determine which approach or approaches may be best for a given patient and/or type of cancer.
    • Standardize obtaining second diagnoses to limit the incidence of misdiagnosis.  

Sepsis:

  • Sepsis kills more in-patients in a hospital than any other affliction and hospital-acquired sepsis is one of the most preventable of the high-cost conditions.  
  • For every hour that medical attention is delayed, the survival rate for sepsis decreases by 7.6%.
  • How can Employers reduce sepsis-related costs?  
    • Educate employees about risk-reduction prevention and symptom identification.
    • Push healthcare system touchpoints to improve infection transmission protocols.
    • Collect & analyze claims data to identify patterns and improve prevention/minimization efforts.

Prenatal/Neonatal Issues:

  • More than 1 out of 10 births in the US are premature, which increases total healthcare costs by more than $26 billion each year.
  • Premature births can result in costs exceeding $600 thousand per baby and there is very little that can be done to promote prevention beyond the status quo.
  • How can Employers reduce prenatal/neonatal-related costs?
    • Utilize regular care management and hospital audits to ensure billing accuracy.
    • Provide managed fertility benefits to limit unwanted multiple births which have higher associated risks and costs than single births.  
    • Reduce costs through bundling maternity monitoring services and optimizing NICU utilization management.

Cardiovascular Disease:

  • Between 2020 and 2050 the risk factors associated with cardiovascular disease are expected to triple, and more than 1 in 3 US adults have already received care for a cardiovascular risk factor.  
  • The cost of cardiovascular disease to the US health system over that time frame is expected to increase from about $3.9 billion to $1.4 trillion - more than quadrupling over that 3-decade span.
  • How can Employers reduce cardiovascular disease-related costs?
    • Conduct work-site blood pressure screenings.
    • Encourage and reward heart-healthy lifestyle behaviors.
    • Educate employees about symptoms of cardiovascular conditions as well as measures to prevent the onset of some heart problems in order to improve early detection to limit their occurrence.

Gene Therapy:

  • Heart Disease, cancer, and blood conditions like hemophilia are among the many ailments that emerging gene therapies are being utilized to treat.  
  • Costs for many gene therapy procedures are heavily frontloaded as these treatments are often one-time events.
  • How can Employers reduce gene therapy-related costs?
    • Consider that many insurance carriers are reducing coverage for some rare diseases by adding conditional waivers for some conditions, as well as warranties, amortized payment schedules, and per-member per-month fees.
    • Consult an experienced benefits broker to become educated about the latest gene therapies to confirm the efficacy and necessity of such treatments.

Other High-Cost Specialty Drugs:

  • Specialty drugs account for more than 40% of net payer prescription costs.
  • Increasing competition for current biologic drugs will see increasing competition from generic and biosimilar drugs which will help keep costs down for employers and benefits managers who stay current.
  • How can Employers reduce specialty-drug-related costs?
    • Some employers are managing specialty drug costs by reducing access to them in the formulary, while other employers are addressing the challenge by instituting employee assistance programs for drug expenses that exceed a certain threshold (e.g. $5 thousand).
    • Monitor internal and external data to ensure the right patient receives the right dosage of the right drug at the right time in the right place at the right price.
    • Consider alternative strategies like contracting with drug manufacturers directly and evaluating less-costly medication options and or treatment facilities (e.g. facilitating in-home infusion over more expensive hospital infusion when possible).  

FREE Insights+ Reports For Qualifying Employers  

Mployer’s Take

There is little doubt among either experts or casual observers that there are systemic issues within the US healthcare system that will require system-wide solutions.

Individual employers - even those of substantial size - only have so much influence over rising healthcare costs that often seem more akin to a runaway train car than a properly functioning public and private health network.

Too often, however, employers misconstrued this limited control as though it were no control, which is when the train really starts picking up enough speed to jump the tracks.

In reality, there are many things that employers can be doing to exercise greater cost controls over their healthcare expenditures - and that is especially true for the highest-cost ticket items.

While employers historically have depended on the assistance of third-party administrators and pharmacy benefit managers to handle claims above a certain threshold, with these costs continuing to climb and no systemic relief currently in sight, forward-looking employers might be wise to take a more proactive approach in holding service providers to account and exploring cost-sharing approaches that don’t compromise quality of care.

There is no one solution to the high-cost claim issue, nor is there a one-size-fits-all solution that can be replicated and reapplied from one high-cost claim to the next, but there are many solutions - often starting with better data collection - that together can be form-fitted to cover the high-cost claim exposure of any given employer that recognizes the value of doing so, which will be an increasing number of employers as net costs for high-cost treatments keep rising.

Economy
The Employment Situation for April 2025
The latest economic release from the Bureau of Labor Statistics reports that the U.S. job market added 228 thousand jobs last month - greatly surpassing expectations - while unemployment ticked up by one-tenth of a point to 4.2%, matching the highest recorded national unemployment rate average since the Fall of 2021.
April 7, 2025

Editor's Note: This report is based on survey data from March 2025 that was published in April 2025. This is the most recent data available. (Source: Bureau of Labor Statistics)

US employers added 228 thousand jobs last month, far outpacing economic forecasts that predicted about 140 thousand new jobs. 

At the same time, the national unemployment rate ticked up to 4.2% - an increase of  0.1% - which is a minor lift, although 4.2% matches the highest the US unemployment rate has been since October 2021 when the US was still recovering from the pandemic-induced unemployment spike. 

Since November 2021, this report represents only the third time that US unemployment has hit 4.2%, the first of which was July 2024 followed by November 2024.

The labor force participation rate rose by one-tenth of a point from 62.4% to 62.5%, while the employment population ratio held steady at 59.9%, which is the third time this figure has been below 60% since November 2022.

After an 11% spike last month in the number of people employed part-time for economic reasons, that figure has come down significantly from about 4.94 million to 4.78 million, representing a reduction of about 160 thousand people - although this subset of the population has seen substantial growth over the last 12 months, increasing by about 11% in total.

The 228 thousand jobs added last month amount to an increase of almost 45% over the 155 thousand jobs added in the US on average in each of the last 12 months, further underscoring the resilience of the labor market even as it has cooled over the past year.

The healthcare industry added the largest number of new payroll entries last month with about 54 thousand jobs - just over the 52 thousand monthly average healthcare job additions over the last year.

The social assistance industry also had a strong month, adding 24 thousand jobs for an increase of more than 26% over the 19% monthly average recorded over the previous 12 months. 

Further, retailers added 24 thousand jobs last month, in part due to more than 20 thousand food and beverage workers returning to the job post labor strike, and the warehousing and transportation industry added a comparable 23 thousand jobs as well, which is almost a 92% increase.

The only industry to see a workforce reduction over the last month is the government, which fell by about 4 thousand workers, driven by a decrease of 11 thousand federal workers - although the loss of federal workers substantially undercounts the number of recent terminations conducted by the Department of Government Efficiency under Elon Musk that have not yet been captured by these surveys.

Average hourly pay rose by about 9 cents to an even $36 per hour (an increase of 0.3%) over the month while the increase was about 3.8% over the last year - up from $34.67 per hour for privately employed, non-farm workers. 

The length of the average workweek saw no significant movement over the month at 34.2 hours per week. 

Mployer’s Take

This report represents only the second set of complete monthly data collected under the second Trump administration.

With most incoming administrations, the first 100 days often moves at a frenetic pace as the new office-holder implements a number of policy changes that depart from those of their predecessor, and Trump’s latest stretch occupying the White House has been no different in that regard.

While many of the early actions undertaken since Trump was re-sworn in were focused on deregulation, deportation, and decreasing the size of the federal workforce, with just a few weeks left in the first 100 days of his second term, Trump focused his attention on tariffs and used executive orders and emergency powers in order to impose import taxes on goods arriving from nearly every international trading partner the US has. 

As we noted in the wake of last month’s employment situation report, many of the impacts of Trump’s early actions have yet to become overtly apparent in the labor market or economy at large as experienced by most Americans.

Those delayed effects are especially true for Federal layoffs which may exceed a quarter million workers based on some estimates, very few of which have shown up in the labor market data yet due to how these figures are counted and when.

Also, the Trump administration has been rehiring some inadvertently terminated personnel who work in sensitive areas like nuclear safety and infectious disease prevention, so the total number of federal employees who have lost their jobs in the last couple of months may still decrease.

That said, there are tens if not hundred of thousands of federal workers who are already or will soon be out of a job, and those results will certainly have an impact on the labor market, potentially increasing the number of unemployed people in the US by more than 3%, and that doesn’t account for all the complementary support jobs in the private sector that will be eliminated due to the smaller federal workforce.

It remains to be seen, of course, just how many jobs will be lost due to these cuts or what the broader economic and other impacts may be, and that will likely continue to be true for many months if not years to come.

All that to say, the delay and uncertainty surrounding the early actions of the second Trump administration will take some time to play out before the final outcomes can be known, and that is largely true for the latest tariff actions, as well - but the scale of the potential tariff-related repercussions may be much bigger, although, to be clear, those impacts are very much still in flux and subject to change as countries come to the negotiating table, reevaluate existing trade partnerships, and/or forge new ones.

After what Goldman Sachs described as the largest equity selloff in 15 years in just the first days since Trump announced and implemented this latest round of sweeping, global tariffs, the short-term economic impacts are likely to be considerably more pronounced than the short-term economic impacts caused by shrinking the federal workforce or disrupting the agricultural supply chain have been.

While the long-term impacts of these actions - especially the tariffs - will likely remain a subject of debate for years, there is much more agreement about the probable short-term impacts, which both supporters and opponents of the Trump administration believe will result in additional stress and strain on the US economy, leading to economic pain - the main questions are how severe it will be and for how long.

Check out the Mployer blog here.