Each month, Mployer Advisor breaks down the Bureau of Labor Statistics’ most recent State Employment and Unemployment Summary to highlight some employment trends across various markets. This is an overview of April’s report.
Editor's Note: This report is based on survey data from March 2024 that was published in April 2024. This is the most recent data available. (Source: Bureau of Labor Statistics)
The national unemployment rate average fell by one-tenth of a point last month, as US employers added more than 300 thousand new jobs.
Only 6 states recorded a statistically meaningful reduction in unemployment rate, however, led by Arizona at minus 0.3%.
Florida was the only state to register an increase in unemployment last month, while the remaining 43 states and Washington DC saw no meaningful change in their month-to-month unemployment figures.
Similarly, only 5 states saw a net increase in jobs over the month, led by Virginia which added almost 17 thousand new entries to in-state payrolls, while the remaining 45 states and DC essentially held steady on net.
There are 5 states plus Washington DC that have unemployment rates above the US national average, down from 6 such states last month plus DC, while 24 states boast unemployment rates below the national average.
Below is the breakdown of the Bureau of Labor Statistics’ (BLS) market employment summary for April 2024.
States With the Highest Unemployment Rates
California posted the highest unemployment rate for the second month in a row, holding steady at 5.3%, followed by Washington DC which ticked up a tenth of a point to 5.2% and swapping places with Nevada who ticked down a tenth of a point to 5.1%.
Rounding out the only other states with unemployment rates higher than the US average are Illinois, New Jersey, and Washington state - which each came in at 3.8% unemployment last month.
Florida, which saw its unemployment rate go up by one-tenth of a point, was the only state to record a statistically significant increase in unemployment last month.
Over the past 12 months, 29 states have recorded meaningful increases in unemployment, led by Rhode Island at plus 1.3%, followed by Connecticut at plus 1.1%, which were the only states that saw their unemployment rates increase by 1% or more over the year.
States With The Lowest Unemployment Rates
For the third straight month, North Dakota and South Dakota recorded the lowest unemployment rates among the states, both holding steady over the month at 2.0% and 2.1%, respectively.
Vermont was next on the list at 2.2% unemployment, followed by Maryland and Nebraska at 2.5% each.
Of the 6 states that recorded a net drop in unemployment rate last month, all but Arizona at minus 0.3% recorded a reduction of just one-tenth of a point. Those states are Maine, Montana, New York, Vermont, and Virginia.
Massachusetts saw its unemployment rate decrease by one-tenth of a percent over the course of the last 12 months, and it was in fact the only state to record a net decrease in unemployment over that time frame.
States With New Job Losses
No states saw statistically significant job losses last month.
States With New Job Gains
5 states in total saw the total number of jobs being worked in their states increase last month.
As a percentage, Arkansas and Kentucky saw the largest job gains at plus half a percentage point each, while Kansas and Virginia both registered 0.4% increases, rounded out by the 0.3% increase in Georgia.
Looking at the raw number of jobs added, however, Virginia had the biggest month, growing their in-state payrolls by 16,500. For context, that’s 10 thousand more jobs over the month than what Arkansas added.
Over the last 12 months, Idaho has seen the largest jobs gain in terms of percentage, with a 3.7% increase in payroll entries over the past year. Nevada isn’t far behind with a 3.4% increase over the same time period.
Mployer Advisor’s Take:
On the one hand, annualized inflation of 3.5% - as was recorded last month - is lower than inflation has been in all but 6 months out of the past 3 years.
On the other hand, inflation has ticked upward (albeit slightly) now 3 out of the last 4 months.
The latter trend is what Fed head Jerome Powell is pointing to while signaling that they will likely be delaying the planned interest rate decreases until 2025.
Perhaps even more concerning, Powell indicated that the Fed’s analysis shows that the cause of the lingering inflation may be linked to the increasing difficulty of insuring an economy that is being subjected to increasingly volatile forces, particularly with regard to natural disasters and weather related events.
We will dive further into the new outlook on how uninsurability may be driving inflation in future pieces and what it means, but suffice it to say for now, given the potential scope of the problem that Powell believes has prevented inflation from being tamped out thus far, plans for lower interest rates may as well be on hold indefinitely.
The latest economic release from the Bureau of Labor Statistics reports that the U.S. added 303 thousand new jobs last month, while the unemployment rate ticked down to 3.8%.
Editor's Note: This report is based on survey data from March 2024 that was published in April 2024. This is the most recent data available. (Source: Bureau of Labor Statistics)
US employers had another banner month on the hiring front, adding 303 thousand new jobs, while the unemployment rate ticked back down a tenth of a point to 3.8%.
Not only did these job figures exceed expectations, they did so by more than 50% over the approximate 200 thousand jobs that economists were forecasting.
It’s also worth noting that this report marks the 26th consecutive report with the US average unemployment rate below 4% - which is the longest such streak in nearly half a century.
The healthcare industry saw the largest number of new jobs added last month, with 72 thousand new payroll entries, which is a 20% increase over the 60 thousand new jobs the healthcare industry has averaged over the last 12 months.
Government jobs had the next largest increase adding 71 thousand new jobs, which was up by more than 30% above its 54 thousand average monthly job additions.
The construction industry also added a significant number of jobs at plus 39 thousand, which is more than two times its monthly average - a trend that was matched by the other services industry, which added 16 thousand jobs last month, doubling the monthly average it has recorded over the past year.
While the social assistance industry saw growth as well, the pace was much slower than usual with the addition of just 9 thousand new jobs last month relative to its monthly average of 22 thousand.
Perhaps most noteworthy of all the industries that recorded job growth last month, however, is the leisure & hospitality industry, which added 49 thousand jobs last month, beating its 12 month average of 37 thousand, and now finally fully recouping all the jobs the industry lost during the peak of the initial pandemic -4 years in h making.
There was no significant change in employment figures last month in the manufacturing, wholesale, transportation & warehousing, information, finance, professional & business services, mining, natural gas extraction, and quarrying industries.
Average hourly earnings rose by 12 cents to $34.69 last month, which is an increase of three-tenths of a percent. When accounting only for private sector, non-supervisory employees, however, the increase was only 7 cents per hour, bringing the average hourly earnings for this subset of the workforce up to $29.79.
The average workweek increased by one-tenth of an hour to 34.4 hours per week.
Mployer Advisor’s Take
Despite this significant job growth including a net upward revision of more than 20 thousand more jobs than were previously reported in January and February, the wage growth remains relatively slow and stable, which will help keep at bay some of concerns about what these strong economic reports will mean for the interest rate cuts that are expected before the end of the year.
This kind of dynamic of job growth without the corresponding wage growth is only possible because of the entrance (or reentrance) into the job market of more than 400 thousand people last month, bringing the labor participation rate up two-tenths of a point to 62.7%.
Still, the strength of this report undoubtedly increases the likelihood that the three interest rate cuts that the Federal Reserve has penciled in for 2024 will fall in the second half of the year, and any similarly strong reports that come over the next few months may very well push at least one of those cuts into 2025.
With prices increasing by a very historically reasonable 3.2% (albeit still above the Fed’s target of 2%) as of the most recent data available, continued strong job growth is a lot more likely to delay and/or decrease the forthcoming rate cuts than another flare up in inflation seems to be, which is a pretty great place for this economy to be in, all things considered
While the concept of a living wage has become an issue of increasing importance to both employers and employees in recent years, the number of workers actually earning a living wage has been steadily decreasing at the same time - though that decrease has not been experienced across industries and/or geographies in equal measure.
While the concept of a living wage has become an issue of increasing importance to both employers and employees in recent years, the number of workers actually earning a living wage has been steadily decreasing at the same time - though that decrease has not been experienced across industries and/or geographies in equal measure.
It may once have been easy to confuse minimum wage standards with living wage standards. In fact, the federal minimum wage was initially devised in part to ensure a living wage, those standards long ago diverged with cost of living significantly outpacing minimum wage increases on balance since the 1950s.
That said, the chasm between minimum wage and living wage seems to have become all the more stark in recent years, especially during the pandemic recovery when workers paid well above minimum wage found themselves unable to keep up as cost of living climbed faster than rising wages despite (and because of?) the historically labor-friendly labor market.
Inflation has largely been under control for the better part of a year now, with the last 9 months holding steady below 4% annualized, but cost of living remains high and the minimum wage remains exactly where it has been for the last 15 years - 7 dollars and 25 cents an hour.
That $7.25 an hour in 2009 would be worth $10.58 today accounting for inflation, etc. Meanwhile, as of 2022, the average living wage in the US according to MIT was just over $25 dollars an hour at the time, or $27.53 in today’s dollars.
With more workers than ever failing to secure a living wage, the repercussions of this situation are likely to be felt far beyond those who are personally affected, though not all industries are contributing equally to the issue nor are all cities/states/regions responding passively to the growing problem.
Industries With the Highest Living Wages
According to data from Revelio Labs, more than one third of workers (36%) employed by the top one thousand companies in the US are paid less than a living wage, defined here as a wage sufficient for two full-time workers to support themselves as well as two dependents. Even worse, nearly 1 out of 5 of those employees (19.2%) does not make enough money to meet basic needs.
As the following graphic illustrates, among the 10 largest industries in terms of total number of employees (which collectively account for 10% of the US workforce), the industries involving technology development dominate the upper end of the scale, with the software, computer services, technology hardware, and pharmaceuticals/biotech industries all paying more than 80% of their employees at or above the living wage threshold.
On the other extreme, both the restaurant and leisure as well as the retail industries pay living wages to fewer than 40% of their employees, while the commercial support services, medical equipment, banking, and industrial goods industries all pay living wages to about 70% to 80% of their employees.
Even when taking into account geographic variance in cost of living, the big picture doesn’t change much, although the following graphic seems to indicate a somewhat less favorable view of the tech industry’s propensity toward paying living wages when factoring for local cost of living, with the total percentage of employees that are paid a living wage in the software and pharmaceuticals/biotech industries dropping by between 3% and 4%, respectively.
Mostly, however, the information best illustrated by this graphic may simply be that industries like tech and media tend to gravitate toward areas with a relatively higher cost of living while the more industrial industries tend to be located in areas with a relatively lower cost of living compared to the national average.
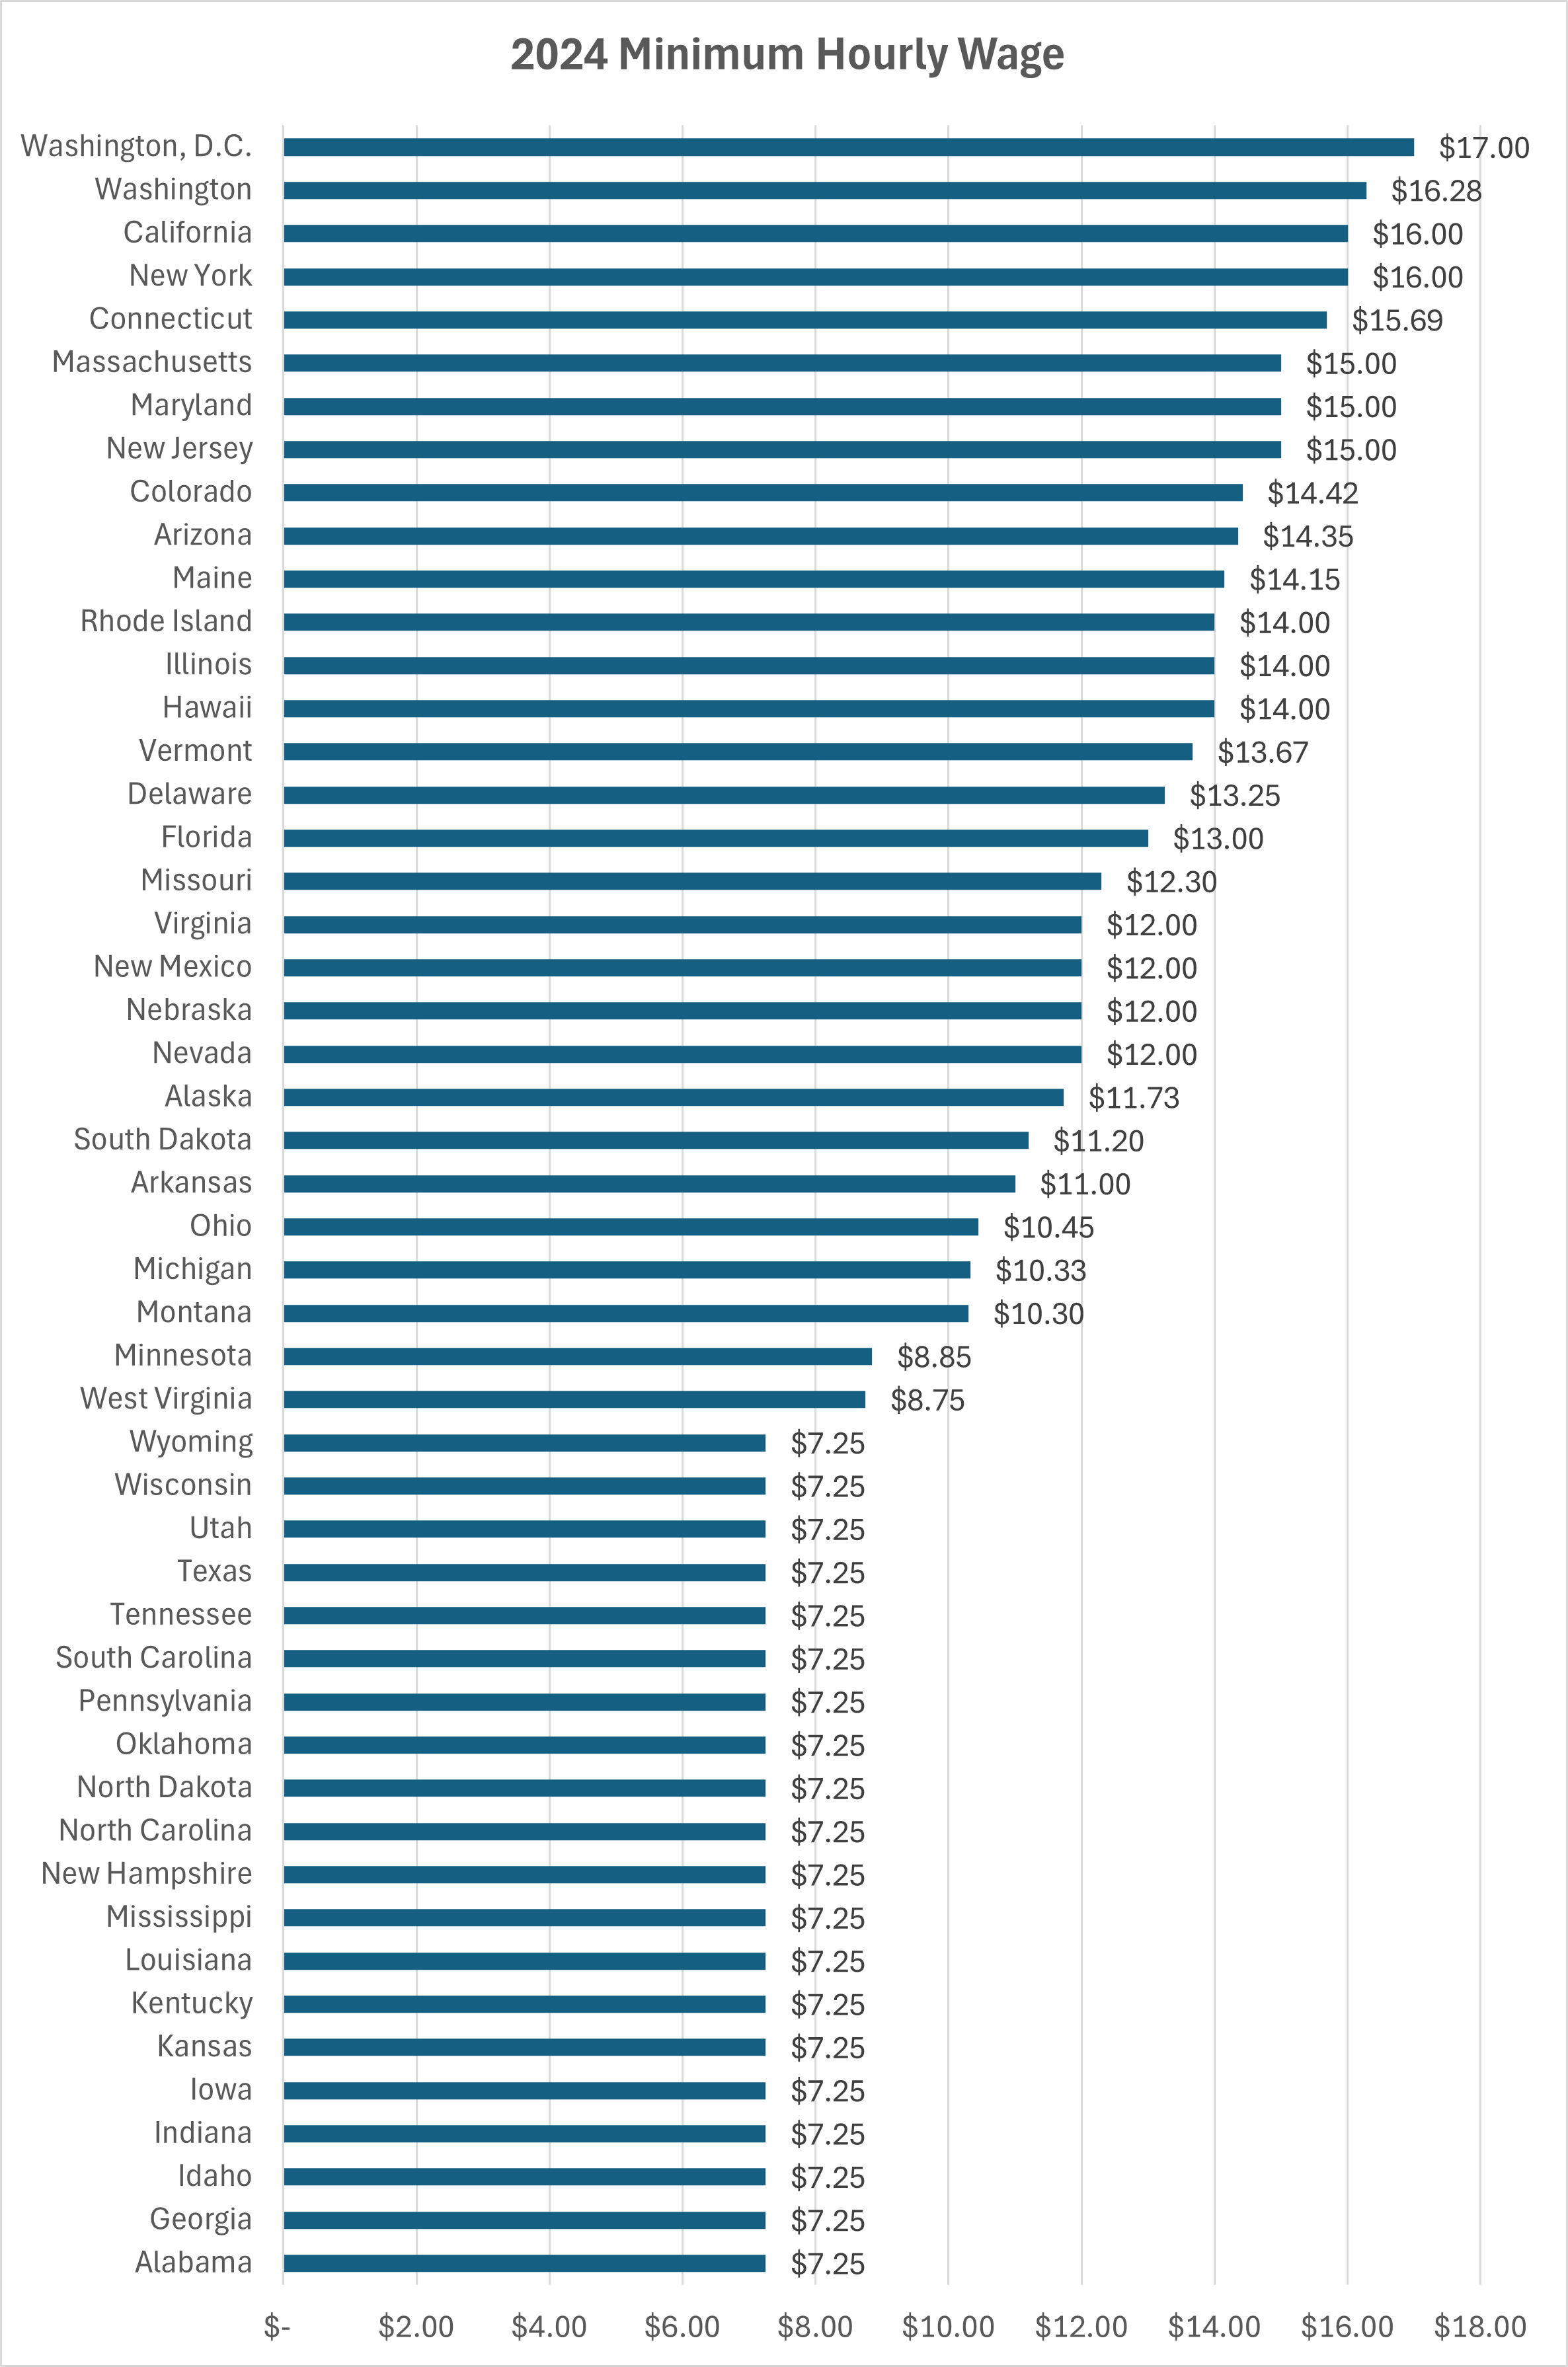
Minimum Wage Across States
According to the National Conference of State Legislatures, Washington DC currently has the highest minimum wage among ‘states’ at $17 per hour, followed by Washington state at $16.26, then California and New York at $16 each.
Beyond the 5 states that have no internally legislated minimum wage and are therefore subject only to the federal minimum wage standard (Alabama, Louisiana, Mississippi, South Carolina, Tennessee), there are 15 states that have set their minimum wage to the current federal level of $7.25 per hour - Georgia, Idaho, Indiana, Iowa, Kansas, Kentucky, New Hampshire, North Carolina, North Dakota, Oklahoma, Pennsylvania, Texas, Utah, Wisconsin, and Wyoming.
Average minimum wage across the remaining states is about $13 per hour.
Minimum Wage Increases Coming Soon
There are 9 states that currently have enacted increases to their current minimum wage thresholds that have not been enacted yet:
Delaware: Increase of $1.75 from $13.25 to $15 effective January 1, 2025
Florida: A series of three minimum wage increases of $1 each are set to occur on September 30th of each of the next three years, raising the statewide minimum wage from $12 up to $15 by October 1, 2026.
Hawaii: 2 minimum wage increases are currently planned, raising the current minimum wage of $14 per hour up to $16 per hour effective on January 1, 2026 followed by another $2 increase up to $18 per hour two years later, effective on January 1, 2028.
Illinois: $1 increase from $14 per hour up to $15 per hour effective on January 1, 2025.
Michigan: Annual rate hikes are planned for January 1 of each of the next 6 years, increasing the statewide minimum wage from $10.33 per hour up to $12.05 by 2031.
Nebraska: 2 minimum wage increases of $1.50 each are currently planned to take effect on January 1 of 2025 and 2026, respectively, increasing the current minimum wage from $12 to $15.
Nevada: On July 1 of 2024, Nevada’s minimum wage will climb from $11.25 to $12.
Rhode Island: The minimum wage is set to increase by $1 per hour on January 1, 2025, bringing the pay rate up from $14 per hour to $15.
Virginia: 2 minimum wage increases of $1.50 each are currently planned to take effect on January 1 of 2025 and 2026, respectively, increasing the current minimum wage from $12 to $15.
What Comes Next?
It’s been almost 12 years since fast food workers launched the Fight for 15 movement to push for better pay (specifically $15 per hour) as well as better/safer working conditions. Currently, the US average living wage is about $27 per hour - nearly double the lofty (and obviously unachieved) goal that $15 per hour represented little more than a decade ago.
In the 85 years since the federal minimum wage was first introduced, it has been raised at least 23 times - most recently in 2009 - with an increase on average more than once every 4 years, but never in the past had more than 10 years passed in between increases, which makes the current 12 year pause all the more noteworthy. Perhaps even more concerning is that the previous record gap between federal minimum wage threshold increases was between 1997 and 2007, which indicates a troubling trend.
Some states are evidently trying to take up the mantle in lieu of waiting for further federal action, but even among the states with the highest planned minimum wages, those thresholds fall significantly short of the living wage standard.
It is also worth noting that all of the states that currently have minimum wage increases set on the books also already have a statewide minimum wage threshold that is meaningfully higher than the current federal standard.
With 40% of states effectively mirroring the federal minimum wage standard, this problem will likely only worsen in the near term and become exacerbated on a regional basis, until some kind of federal solution is enacted.
Still, whenever Congress eventually gets around to increasing the federal minimum wage again, based on current conditions there is virtually zero chance that the increase will close much of let alone all of the gap between the minimum wage and living wage in a given area.
Of course, failure to raise minimum wage standards to meet base standard of living expectations does no preclude other factors and/or market forces from reversing the trend toward larger proportions of the workforce earning unlivable wages, but whatever those factors may be they have yet to emerge, and the long-term implications of these conditions remain unclear.
Each month, Mployer Advisor collects and presents some of the most relevant and most pressing recent changes in law, compliance, and policy in areas related to employee benefits, health care, and human resources.
Each month, Mployer Advisor collects and presents some of the most relevant and most pressing recent changes in law, compliance, and policy in areas related to employee benefits, health care, and human resources.
Federal Prescription Data Reporting Updates
RxDC reports for calendar year 2023 are due June 3, 2024 in accordance with the Title II, Division BB of the Consolidated Appropriations Act of 2021.
While this information is usually submitted by carriers, pharmacy benefits managers, and third party admins - these entities will often need to seek out information directly from employers and can be expected to do so as the submission deadline approaches.
Some of the noteworthy updates to this year’s submission instructions include:
Clarification that nutritional supplements, over-the-counter medication, and medical devices are not to be included on lists of prescription drugs;
Simplification of the total monthly premium calculation, now computed by dividing the total annual premium by twelve;
Simplification of premiums calculation accounting for paid claims instead of incurred claims;
Addition of a new column to input enrollment data; and
Instructions on how to submit large data files that exceed the maximum allowable limit, as well as updated instructions on how to input various other data;
Click here for the Centers for Medicare and Medicaid Services 2023 instruction guide for RxDC submissions.
2023 EEO-1 Component 1 Submissions Due Date Approaching
Collection of EE0-1 Component 1 data will open on April 30, 2024 - with a final deadline for EEO-1 Component 1 submissions currently set for June 4, 2024.
Check the Equal Opportunity Employment Commission (EEOC) website for updates as well as an instruction booklet and file submission specifications, which the EEOC expects to have posted by March 19, 2024.
This filing must be submitted by every company that has 100 or more employees across all locations and/or is affiliated with a company that has 100 or more employees through common ownership or centralized management.
Further, this filing must also be submitted by any company with 50 employees or more that has a contract with the federal government worth at least $50,000 or has an establishment that holds a federal contract worth at least $50,000.
Companies or establishments thereof that are federal contractors and serve as depositories of federal funds no matter how much or how little, as well as financial entities that are issuing and paying agents for US Savings Bonds and Savings notes must also submit this form.
Electronic submissions of form 300-A was due March 2, 2024 for non-exempt companies and establishments, which include firms that had 250 or more employees during 2023, or 20 or more employees in industries designated as high risk.
Form 300 and 301 was also due on March 2 for qualifying institutions, which include firms in high-hazard industries that had 100 employees or more during 2023.
Click here for more information about how and where to submit these forms in addition to guidance in determining what your organization is required to submit.
Employee vs. Independent Contractor Classification
As of March 11, 2024, the Department of Labor effectively reverted back to ‘the economic reality’ test for determining whether a given worker should be classified as an employee or as an independent contractor.
The economic reality test takes into account the following 6 factors when evaluating a workers employment status and classification:
Whether it is possible for the worker to either profit or lose money as a result of the arrangement;
What investments have the employer and worker each made toward completing the work;
Is the work relationship a more permanent arrangement or more temporary;
How much control does the employer exert over the worker’s process;
How crucial is the worker’s output to the employer’s business; and
The levels of skill and initiative possessed by the worker.
Employers Rejecting Job Applicants Due to Credit Reports Must Now Provide Credit Rating Agency Info
As of March 20, 2024 enforcement began for Consumer Protection Bureau’s rule requiring Employers that reject job applicants due to information obtained through a credit report to provide the rejected applicant with information about the credit reporting agency from which the report was obtained, including name, address, and telephone number.
Too often, misconceptions can lead employees to put off or minimize retirement savings in the near term, without realizing the impact those delays and that underinvestment will have in the long run, which can have negative consequences for employees later in their careers as they try to make up lost ground.
The concept of a ‘retirement age’ is tragic in a sense, because it causes so many people to conceive of retirement as something that can be achieved passively like a milestone similar to a birthday, with little input required to get there beyond waiting out the passage of time.
‘Retirement age’ as a term also somewhat implies that the age of retirement is expected to be the same for everyone, while age is one of the least relevant of several factors that will ultimately determine if and when any given person is capable of retiring from the workforce and maintaining their expected standard of living.
Too often these misconceptions can lead employees to put off or minimize retirement savings in the near term, without realizing the impact those delays and under investments will have in the long run, which can have severely negative consequences for employees later in their careers as they try to make up for lost ground.
Last week, we discussed 401ks largely from an employer perspective and provided some benchmarking data that can help organizations better understand how their retirement benefit offerings compare to the market, here we will take a closer look at retirement savings from the perspective of individual workers, account holders, and would-be retirees.
For employers who want to optimize the value of the benefits they offer, it is necessary but not sufficient that employees internalize the value of those benefits in line with market expectations, but employees must also believe on a personal level that their individual retirement position is secure and on track relative to both their peers and their own subjective situational goals.
How Much Should Employees Be Saving For Retirement?
It’s natural for employees to have many varied questions about their retirement options and considerations, of course, but almost no matter what kind of retirement a given employee may be envisioning, the best answer to the question of how to attain that vision involves a recommendation to start saving more money sooner.
In order to maximize the benefits of earnings compounding over a longer period, the best time to start saving for retirement was any time between day one on the job and yesterday, but the second best time to start saving is now.
And while there are a number of factors of varying complexity that can affect both retirement goals and the steps necessary to achieve them (e.g. geography, expenses, age, etc.), this recent piece from CNN highlights a basic retirement savings outline crafted by Fidelity Investments that is a good starting point to help employees to get their bearings at the very least:
Aim to have saved an amount approximately equivalent to one year’s salary by the age of 30;
Aim to have saved 3 times annual salary by the age of 40;
Aim to have saved 6 times annual salary by the age of 50;
Aim to have saved 8 times annual salary by the age of 60; and
Aim to have saved 10 times annual salary by the age of 67.
Of course, while the simplicity of this framework is certainly a strength in terms of its memorability and general applicability, that same simplicity is also a weakness when it comes to more specific, precise, or actionable advice.
For example, although relative standard of living considerations are largely accounted for by using annual salary as a base unit (assuming one’s annual salary affords a comparable standard of living to what they hope to maintain in retirement), and retirement age is fixed at 67 in line with when full social security benefit payouts currently become available, the verbs ‘to have saved’ are doing a lot of heavy lifting without providing any detail about monthly savings breakdowns or how interest rates, raises, and contribution timing fit into the equation.
How Much Are Employees Actually Saving For Retirement?
Perhaps the greater weakness in Fidelity’s simplified retirement savings framework, however, is less about the lack of detail or actionability and more about the aspirational nature of the framework, which can be disconnected from the reality of what a given employee can potentially reproduce in light of their age, location, job, pay rate, and other circumstances.
In order to learn more about the reality on the ground for how employees are engaging with their 401k savings, real world data is likely going to be a better source of information than general guidelines.
As the following graphics illustrates, two variables that have a significant impact on both contribution rates and total retirement account savings value are the account holder’s age and their tenure with their current company.
Clearly, older workers have had more time both to contribute to their 401k accounts and for those contributions to compound and grow, with workers over 65 years of age having a median of a little over 70 thousand dollars in those accounts while workers at the age of about 45 years old only had a median of about 38 thousand.
Note across the age ranges, the average savings figures are often about 3 times larger than the median savings figures, indicating that the majority of value contained within 401k accounts is skewed toward the accounts with above average levels of savings.
While length of time on the job is certainly correlated to age and both increase alongside 401k savings over time, what may be most noteworthy about the age and tenure comparison is just how much more impactful tenure can be in terms of overall savings.
As the following graphic indicates, staying with a company for 10 plus years can reap major rewards in terms of retirement savings - of course how much of that outcome is dependent on rising through the ranks over an extended tenure isn’t clear from the available data.
Still, it is hard not to look at these graphs and see some indication of how valuable internal talent development and two-way loyalty can be for both employers and employees both during the tenure of the work and after leaving the workforce.
It is also worth pointing out that average 401k savings relative to tenure is about twice as large as median 401k savings relative to tenure, which is a less sizable wealth gap than average 401k savings relative to age, which was about 3 times larger than median 401k savings relative to age.
These figures seem to show that longer tenure is more positively correlated with earning above average pay than getting older is positively correlated with earning above average pay.
How Much Are Employees Contributing To Their 401ks?
Combined employer plus employee contribution increases with age, as one would expect, but it is not as significant as one would expect - or hope.
The average combined employer and employee contribution rate is approximately 5%. Contributions begin at around 4% for individuals aged 20-29 and exhibit a gradual increase, reaching a peak of about 5.2% among the 50-59 and 60-69 age brackets.
A deeper analysis suggests that the primary driver behind this progressive increase is enhanced job tenure. As employees remain longer with their employers, they not only become more inclined to save for retirement but also benefit from mechanisms like auto-escalation features within 401(k) plans. This trend underscores the significant role that sustained employment plays in bolstering retirement savings efforts.
Increase contribution 1% a year until on track to meet goals
Promote using and abiding to auto-enrollment and auto-escalation to help employees not fall behind
Promote catch-up contributions for employees age 50 and older who can add up to an additional $7,500 per year into their 401ks in 2024.
As the Baby Boomer generation continues to depart from the workforce and begins to test the capacity of our infrastructure and our country’s ability to care for its aging citizenry, the stark truths that successful retirement can almost only ever be attained through diligent proactive effort and is in no way guaranteed will become increasingly obvious for employees at all stages in their careers.
Forward-looking companies should do more now to ensure their employees are well-positioned to manage the challenges they will meet when their careers have come to an end, which in turn will build loyalty, improve the expected outcomes, and enable employees to better focus on the challenges they encounter in their careers along the way to the mutual benefit of everyone involved.
Each month, Mployer Advisor breaks down the Bureau of Labor Statistics’ most recent State Employment and Unemployment Summary to highlight some employment trends across various markets. This is an overview of March’s report.
Editor's Note: This report is based on survey data from February 2024 that was published in March 2024. This is the most recent data available. (Source: Bureau of Labor Statistics)
Despite an overall increase of two-tenths of a point in the national unemployment rate over the same time period, the vast majority of the country (44 states plus Washington DC) saw their state unemployment rate essentially hold steady over the month, while the states that saw a meaningful increase or decrease in unemployment rate were evenly split at 3 apiece.
As for new job additions, the country as a whole had an increase of 275 thousand new jobs, but similar to unemployment rates, 46 states plus Washington DC saw no significant change in their net payroll figures while only 4 states recorded net job gains.
Currently there are 6 states plus Washington DC that have unemployment rates above the US national average of 3.9%, while there are 23 states with unemployment rates below the national average.
Below is the breakdown of the Bureau of Labor Statistics’ (BLS) market employment summary for March 2024.
States With the Highest Unemployment Rates
California, at 5.3% unemployment, ended Nevada's (5.2% unemployment) long reign as the state with the highest unemployment rate.
Washington DC, at 5.1% unemployment, was the only other ‘state’ at or above 5%, although there were 4 states between 4% and 5% - Idaho and New Jersey at 4.8% each, and Washington and New York at 4.7% and 4.4%, respectively.
Over the month, only 3 states recorded an increase in unemployment rate - Idaho at plus 0.3%, followed by Connecticut and Washington at plus 0.1% each.
States With The Lowest Unemployment Rates
The Dakotas collectively topped the list of states with the lowest unemployment rates for the second month in a row, although they switched positions to put North Dakota on top this time at 2.0% while South Dakota was close behind at 2.1%.
The states with the next lowest unemployment rates recorded last month were Maryland, Nebraska, New Jersey, and Minnesota at 2.4%, 2.5%, 2.6%, 2.7%, and 2.8%, respectively.
3 states saw meaningful reductions in unemployment rate over the month - Tennessee and Wisconsin, which each saw their unemployment rates drop by 0.2%, whereas Massachusetts managed a 0.1% decrease in unemployment.
Over the prior 12 months, only 3 states recorded net reductions in unemployment, led by Massachusetts at minus 0.7%, followed by Pennsylvania and Wyoming at minus 0.3% each.
States With New Job Losses
No states saw statistically significant job losses last month/year.
States With New Job Gains
Of the 4 states that recorded net job additions last month, Iowa saw the largest percentage gain at plus 0.7%, followed by Illinois and Texas at plus 0.4% and Michigan at plus 0.3%.
Texas was the state that had the largest gain in terms of total net payroll entries, adding nearly 50 thousand new jobs over the month. Illinois was next on the list at about plus 23 thousand. Michigan and Iowa added about 15 thousand and 11 thousand net jobs, respectively.
Over the last 12 months, Nevada has the largest percentage gain in net jobs at plus 3.4%, followed by Alaska at 3.1% and South Carolina at 3.0%. The largest number of total new jobs over the year went to Texas, Florida, California, and New York.
Mployer Advisor’s Take:
The Federal Reserve chose to hold off on lowering key interest rates when it convened earlier this week, citing increased inflationary forecasts, but Fed officials nonetheless reinforced their expectation that they will reduce those rates by 0.75% by the end of the year.
Markets responded favorably to the news, but any reaffirmation of rate-lowering plans remains contingent on inflation returning to 2023 levels after an unexpected upward creep in the first couple of months of 2024.
The Fed will meet again in May to reassess the situation and will be keeping a close eye on those inflation numbers in the meantime.
What remains to be seen is whether or not the economy and job market can hold steady alongside the Fed while interest rates continue in their holding pattern perhaps a little longer than expected before the Fed attempts to execute the final stages of their aimed-for soft landing.
Given their prominent position that 401ks hold in the context of modern workforce management, a closer look at some of the surrounding issues can help ensure that your organization’s offerings remain viable relative to the other employers with which you are competing for talent.
For over 30 years now, 401ks have been the retirement savings option of choice for most employers and employees alike, which is an impressive feat for an investment vehicle that was initially created by accident and which many experts believe is not particularly well-suited to play the role of pension replacement in which it has been cast.
Despite those and some other inherent shortcomings, however, 401ks dominate the retirement savings landscape and show little sign of slowing down.
Perhaps in part as a result of the impromptu nature of their genesis followed by meteoric rise to becoming a familiar term around most American kitchen tables, however, the way they are actually constructed -from percentage match to auto-enrollment and auto-escalation, vesting schedules and fees - varies wildly from one company to the next. These features have a dramatic effect on what it costs a company to fund and offer a 401k to the value an employee actually derives (or doesn't).
Over a five year period, for an $80K salary, the difference between a 1% match and a 6% match is the difference between an employer contribution of $4,500 for 1% and $27,000 for 6%, assuming modest investment returns. The difference is $20K+ for an $80K year employee. That is just five years, imagine if that were compounded over 20-30 years.
Given their prominent position that 401ks hold in the context of modern workforce management, a closer look at some of these issues can not only help ensure that your organization’s offerings remain viable relative to the other employers with which you are competing for talent, but can also help you restructure your 401k offering in a way to maximize employee appreciation and the value generated through these benefits.
The following information is primarily drawn from data collected through Mployer Advisor’s annual Insights survey combined with government and other publicly available data sources.
401k Background and Context
The Revenue Act of 1978 included a provision that was intended to enable employees to defer some of their compensation from bonuses or stock options tax free, but a benefits manager at the Johnson Companies recognized the new law - specifically, section 401(k) of the revenue bill - made it possible for the company to offer its employees savings accounts with a major tax advantage attached.
By 1981, the IRS had issued rules that made it possible for employees to make contributions to those 401k accounts via deductions from their salaries, and just 2 years later nearly half of all of the largest US firms offered (or were considering offering) 401ks.
Even though participation in retirement account savings surpassed defined benefit plans and pensions by about 1991 (around 10 years after they were introduced in earnest) it took another 20 years for total wealth and savings contained in those defined contribution retirement accounts to exceed the value of pension assets likely on a permanent basis.
Currently only, about 15% of private employees in the US have access to defined benefit plans like pensions, and only 11% US workers opt in to those plans, whereas about 66% of private employees in the US have access to defined contribution plans like 401ks and nearly half (48%) choose to participate, which further underscores just how dominant 401ks are currently in the retirement saving space.
Does Company Size Affect Likelihood of Offering 401ks?
As the following graphic clearly demonstrates, there is a direct correlation between the number of workers that a given company employs and the prevalence of 401k offerings among similarly situated companies of approximately the same size.
As companies grow larger in size, they become increasingly expected to provide a retirement benefit. 85%+ of companies that have 500 or more employees offer a 401ks. That number holds relatively constant, drifting a little south, until you reach smaller employers. Even among smaller employers, offering 401ks has become the norm, with more than 6 out of 10 organizations (61%) that employ between 25 and 49 employees offering 401ks, while almost half of organizations (48%) with between 2 and 24 employees offering 401ks, as well. It costs money to even offer a 401k, even without a match. It is voluntary for a company to
The trend line is clear, and it is intuitive that larger organizations with more employees will also be more incentivized to offer a wider range of incentives in addition to being better equipped to handle the additional administrative workload involved, but the more important takeaway may be just how widespread the adoption is at the lower end of the employee count spectrum.
401ks are nearly everywhere, which is a reality that shouldn’t be ignored in an era during which many employees can work from nearly everywhere, employers are competing with other employers from nearly everywhere, and benefits offerings have become a more prominent point of differentiation perhaps than ever before.
Not All 401ks Are Created Equal - The Match Is The Biggest Driver
The 401k match is the biggest factor for a 401k. This component is what costs the employers the most money and also benefits the employee. This sets the bar.
As the following graphic illustrates, the average 401k contribution match is about 3.8%, meaning about half of all companies offer matching of 3.8% or more while about half of companies offer less than 3.8%.
Further, 8 out of 10 companies offer 401k contribution matching between 2% and 6% of employee income, so that is the range in which the vast majority of companies operate, with only 10% of companies falling below that range (down to 0% for those companies offering no 401k matching) and 10% of companies falling above that range (up to about 10% contribution matching on the more generous edge of the spectrum).
Where does your employer fall on this chart? Do you communicate the value of your 401k offering?
401k Auto-Enrollment and Auto-Escalation
While offering 401ks and matching contributions are obviously necessary steps for employers to take in order for employees to benefit from these opportunities in the first place, these steps alone may not be sufficient to fully realize the talent attraction and retention advantages that can accompany 401k and matching contribution offerings. To those ends, two features that have been shown to have a material effect on employee saving are auto-enrollment and auto-escalation.
While the cost difference for an employer for using these auto features or not may be negligible in the short term, the additional savings that employees can accumulate in the long term can be substantial, which in turn can have a substantial effect on how favorably an employee views their employer and benefits offerings generally.
Auto-enrollment in employer 401(k) offerings serves as a crucial mechanism for ensuring that a larger segment of the workforce participates in retirement savings plans. Without such measures, a significant portion of employees, particularly those who might benefit the most, such as younger or lower-income workers, may not enroll due to lack of awareness, procrastination, or perceived complexity in the enrollment process. This is a concerning scenario, as it leaves vulnerable groups without the means to save adequately for retirement. While implementing auto-enrollment does indeed incur additional costs for employers due to higher participation rates, the long-term benefits to employees' financial security are substantial.
Similarly, auto-escalation provisions in 401(k) plans are designed to gradually increase employees' savings rates over time, often in tandem with annual salary increments. This feature not only boosts employees' retirement savings but, in cases where employers match contributions up to a certain percentage, also increases the amount employers contribute. Though this represents an additional financial commitment for employers, it plays a vital role in encouraging employees to save more towards retirement without actively having to adjust their savings rate annually.
As the following graphic indicates, only about 42% of US employers offer auto-enrollment, while only 25% offer auto-escalation, which represents a real opportunity for employers to differentiate from the much of the competition on this front.
Both auto-enrollment and auto-escalation embody forward-thinking components of retirement savings plans that, while optional and costly for employers, significantly enhance employee benefits. Employers who adopt these features are making a commendable investment in their workforce's financial wellbeing. It's imperative for businesses offering these benefits to communicate their value effectively, highlighting that not all employers provide such advantageous provisions. This communication not only showcases the employer's commitment to employee welfare but also helps in attracting and retaining talent who value financial security and employer support in achieving it.
By taking some of the uncertainty and user error out of the process, employers can virtually guarantee enhanced saving opportunities for their employees by automatically enrolling them as soon as applicable and by increasing contribution amounts on a set schedule in line with employee goals.
401k Vesting and Distribution
Similar to the advantages that 401k auto-enrollment and auto-escalation can provide, features that improve the accessibility and distribution of 401k funds can serve as a point of differentiation, as well, which can also increase applicant attraction and employee satisfaction in a way beneficial to employers.
For example, when and how the matching 401k contributions vest can have a material effect on both the perceived and real value of the benefit as well as on the timeframe in which workers may choose to leave their jobs for employment elsewhere.
Currently, a plurality of employers offer immediate vesting for matching contributions, which is the most advantageous option from a worker perspective, but at just 36% there is still more than enough room on this bandwagon for employers wishing to capitalize on the opportunity to shape their benefits in a way that will be even more appealing to employees.
Somewhat less-favorable to employees is graded vesting, which vests the matching contributions little by little over an extended period of time, which about 32% of employers utilize, while about 27% of employers arrange their matching contributions to vest all at once at a specified date in the future, which is known as cliff vesting and is probably the least appealing option to employees because it requires them to wait longer to obtain legal ownership of those contributions provided by their employer.
As for 401k distribution, there is much less parity among companies in terms of the adoption rates of the various options, with distribution via annuity offered by nearly 9 out of 10 employers (89%). Nearly half (42%) offer distribution via installment payments while only about 12% offer lump sum distribution.
Given that employers can offer more than one possible method for distribution, of course, the operative questions become which option or options will best service the needs of the employees and how to best go about providing those options.
Communicating Your Plan's Value
The facts -
- Employers do not have to offer a retirement plan
- Retirement plans are expensive, especially when considering the match percent
- Plan features can have an extreme impact on the 401k, both in terms of employer cost and employee long term benefit
- If you offer a rich 401k - 1. make sure you know that and 2. communicate it because it can be a great driver for retention and attraction


.jpg)
.png)
.png)
.jpg)