Employee Benefits
2026 Benefits State of the Union: High-Cost Drugs and What They Mean for Your Health Plan
According to Mployer Insights’ 2026 analysis of 50,000+ employer health plans, prescription drugs account for over 25% of total benefit expenses, with Tier 4 specialty drugs driving the majority of high-cost claims. While Tier 4 copays average $123 with coinsurance requirements in 31% of plans, individual oncology therapies like Darzalex Faspro ($170,800/yr) and Keytruda ($158,200/yr) frequently exceed average individual stop-loss deductibles ($141,938). To mitigate exposure, self-funded employers are increasingly turning to independent, transparent PBM models and biosimilar substitution—which yields up to a 73% net cost reduction per patient.
August 9, 2026

The Likely Fastest-Growing Line in Your Benefits Budget

Modern medicine has produced remarkable advances. Cancer therapies that were not available five years ago are now extending and saving lives. Treatments for autoimmune diseases, multiple sclerosis, and rare genetic conditions are giving employees and their families real options where few existed before. As an employer, providing access to these treatments through your benefit plan is one of the most meaningful things your organization does for the people who work there.

It also comes with a financial reality that every benefits decision maker needs to understand clearly. Over 25% of total employer health benefit expenses are now driven by prescription drugs, and within that figure, a small number of specialty drugs account for an outsized share of the cost. A single covered employee on an oncology therapy can generate $100,000 to $170,000 or more in annual drug spend. A handful of members on these treatments can represent a larger budget impact than the entire pharmacy spend of the rest of your workforce combined. The goal is not to restrict access to these medications. The goal is to understand how the system works, how costs flow, and how to structure your plan so that both your employees and your organization are best positioned for the long term.

This piece covers how the pharmacy benefit system works, how your plan’s tier structure determines who pays what, how stop-loss insurance interacts with high-cost drug claims, and what employers can do to manage this exposure thoughtfully.
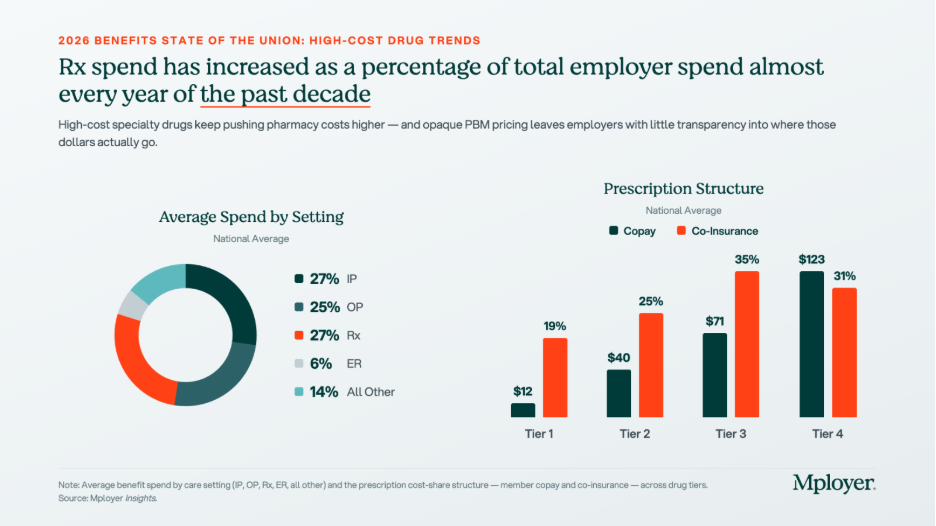
The tier structure in the chart above reflects how plans already account for the cost complexity of specialty drugs. Tier 4, which is where specialty biologics and injectables are typically placed, carries significantly higher cost-sharing than the other tiers: an average employee copay of $123 and coinsurance requirements in 31% of plans. But Tier 4 behaves very differently from the other tiers. On Tier 1, 2, and 3 drugs, cost-sharing is relatively predictable and manageable. On Tier 4, the combination of high drug cost and percentage-based coinsurance can generate out-of-pocket exposure that approaches or exceeds a patient’s annual out-of-pocket maximum in a single month of therapy. How Tier 4 is structured, what controls are in place, and how the plan manages cost is one of the most consequential design decisions an employer makes.

Understanding Your Benefit Plan’s Pharmacy Options

How Pharmacy Benefit Managers Work

Most employer health plans do not manage pharmacy benefits directly. That function is delegated to a Pharmacy Benefit Manager, or PBM, which acts as the intermediary between the health plan, the pharmacy, and the drug manufacturer. The PBM builds and maintains the formulary, negotiates drug prices and rebates with manufacturers, contracts with pharmacy networks, and processes pharmacy claims. The three dominant PBMs, Express Scripts (owned by Cigna), CVS Caremark (owned by CVS Health / Aetna), and OptumRx (owned by UnitedHealth Group), together manage the pharmacy benefits of approximately 80% of covered lives in the United States. Each is affiliated with a major carrier, meaning that employers who use an ASO medical arrangement often default to the carrier’s affiliated PBM without realizing it. Independent PBMs such as Capital Rx, Navitus, and MedOne Pharmacy Benefit Solutions operate on transparent, pass-through pricing models that return all rebates to the plan rather than retaining them as PBM revenue. PBMs are compensated through administrative fees, spread pricing (charging the plan more than the pharmacy receives and keeping the difference), manufacturer rebates in exchange for formulary placement, and specialty pharmacy margin. For any employer managing meaningful specialty drug spend, understanding which of these revenue sources applies to your contract is essential.

How Drug Tiers and Cost-Sharing Work

Every pharmacy benefit plan organizes covered drugs into tiers, with cost-sharing that increases as you move from Tier 1 generics (avg. $12 copay) through Tier 2 preferred brands ($40), Tier 3 non-preferred brands ($71), and into Tier 4 specialty drugs ($123 copay, with coinsurance in 31% of plans). The tier placement of a drug affects both what the employee pays and, indirectly, what the plan pays, since tier placement drives utilization patterns. Plan sponsors have real levers here: step therapy (requiring a patient to try a lower-cost drug first), prior authorization, specialty pharmacy channel mandates, and formulary exclusions all affect Tier 4 cost without eliminating clinical access. These controls require balancing cost management with the reality that for many specialty drugs, no lower-cost alternative achieves the same clinical outcome.

How Stop-Loss Insurance Interacts with High-Cost Drug Claims

For self-funded employers, specialty drug claims are now among the most common triggers for individual stop-loss reimbursement. A single employee on a cancer therapy or rare disease treatment can generate pharmacy claims that exceed the plan’s specific stop-loss deductible, which averages $141,938 nationally for self-insured plans, within a single plan year. The mechanics: the employer pays all claims up to the deductible threshold, and the stop-loss carrier reimburses costs above it. Several dynamics are specific to high-cost drugs. At renewal, stop-loss carriers may laser a known high-cost member by raising their individual deductible or excluding them from coverage. Some carriers now specifically carve out GLP-1 medications or other high-utilization drug categories from stop-loss reimbursement, so employers adding new drug coverage should verify what their contract covers. Specialty drugs can also be administered under either the pharmacy benefit or the medical benefit depending on whether they are self-administered or clinic-administered, and some stop-loss contracts apply different terms to each channel. Employers should model their actual specialty drug cost distribution against their stop-loss deductible at every renewal to understand where the plan’s real exposure sits.

The Costliest Specialty Drugs: What They Treat and What They Cost

The chart below shows the highest-cost specialty and biologic drugs by average cost per patient, ranked from most to least expensive. Cancer therapies dominate the top of the list, but treatments for autoimmune conditions, MS, and inflammatory disease also appear, reflecting how broadly specialty drug spending is distributed across a workforce.
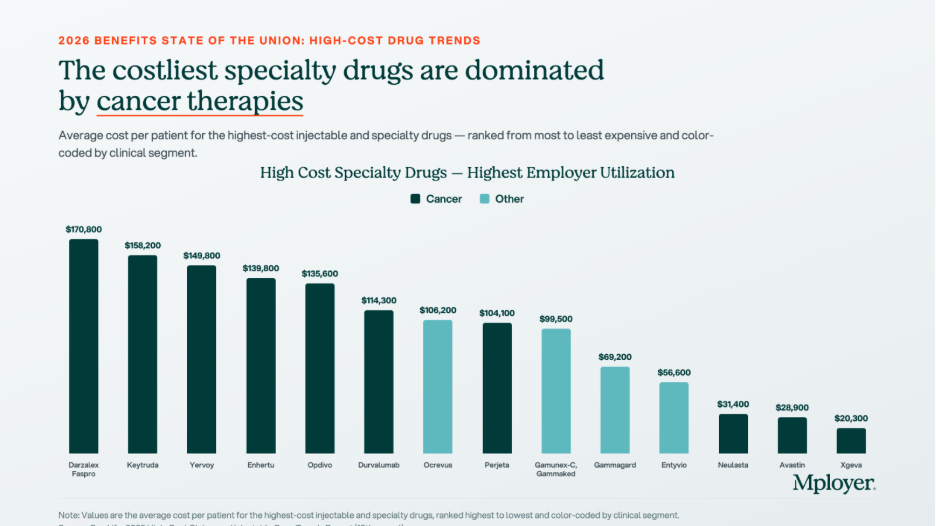
  • Darzalex Faspro (daratumumab/hyaluronidase) | $170,800 avg. annual cost per patient. Janssen (J&J). Multiple myeloma, a blood cancer. The highest-cost drug on the list by average patient cost. The subcutaneous formulation allows home administration, increasing the likelihood it flows through the pharmacy benefit rather than the medical benefit.
  • Keytruda (pembrolizumab) | $158,200 avg. annual cost per patient. Merck. FDA-approved across more than 40 cancer indications including lung, melanoma, head and neck, and bladder cancers. One of the most prescribed oncology drugs globally and one of the most common high-cost pharmacy claims in large employer plans.
  • Yervoy (ipilimumab) | $149,800 avg. annual cost per patient. Bristol-Myers Squibb. Melanoma and in combination with Opdivo for lung and other cancers. Combination Yervoy plus Opdivo therapy is among the highest per-patient drug cost regimens in common use.
  • Enhertu (trastuzumab deruxtecan) | $139,800 avg. annual cost per patient. AstraZeneca / Daiichi Sankyo. HER2-positive and HER2-low breast and gastric cancers. A significant recent clinical advance for patients with cancers that previously had limited options after first-line treatment.
  • Opdivo (nivolumab) | $135,600 avg. annual cost per patient. Bristol-Myers Squibb. Melanoma, lung, kidney, bladder, and other cancers. Frequently used in combination with Yervoy, compounding cost significantly when both are prescribed together.
  • Ocrevus (ocrelizumab) | $106,200 avg. annual cost per patient. Genentech. Relapsing and primary progressive multiple sclerosis. MS therapies are a persistent specialty drug cost driver because patients remain on therapy for years, making each diagnosed member a multi-year plan cost.
  • Entyvio (vedolizumab) | $56,600 avg. annual cost per patient. Takeda. Moderate-to-severe Crohn’s disease and ulcerative colitis. Inflammatory bowel disease therapies are among the most common specialty drug claims in employer plans because the conditions are prevalent in working-age adults.

Biosimilars: The Cost Opportunity Most Employers Are Not Fully Using

A biosimilar is a biologic drug that is highly similar to an already-approved reference biologic, with no clinically meaningful differences in safety, purity, or potency. Biosimilars are not generic drugs in the traditional sense, because biologic drugs are complex proteins manufactured from living cells and cannot be chemically replicated exactly. But they go through an FDA approval pathway that confirms their clinical equivalence to the reference product, and they cost significantly less. The biosimilar market has expanded rapidly as major biologic patents have expired. Humira, the world’s best-selling drug for much of the past decade, now has multiple biosimilar competitors in the U.S. Stelara has followed. The oncology biosimilar pipeline is maturing, with more approvals expected in the next two to three years.
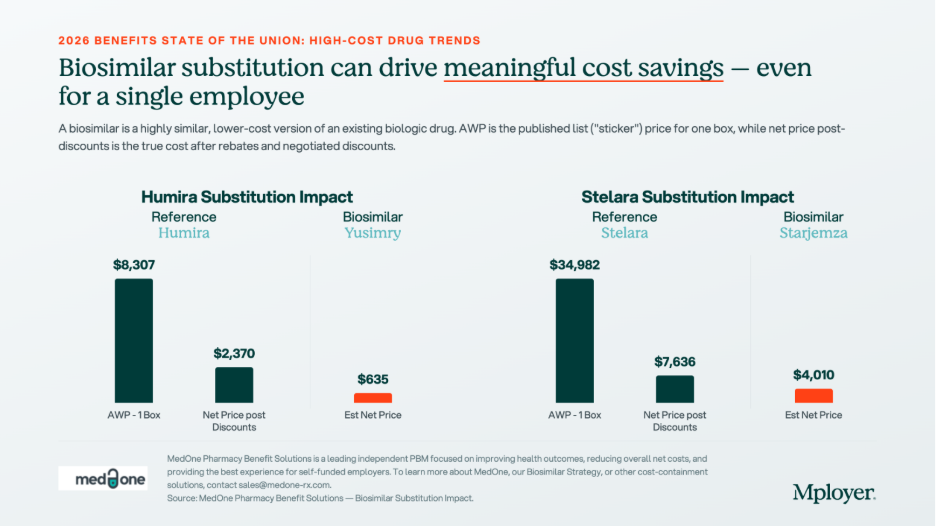
The chart above shows what biosimilar substitution looks like in dollar terms. For Humira, the net price after rebates and negotiated discounts is $2,370 per box. The biosimilar Yusimry has an estimated net price of $635, a 73% reduction. For Stelara, the reference drug net price is $7,636 per box. The biosimilar Starjemza has an estimated net price of $4,010, a 47% reduction. For an employee on monthly Humira therapy, the difference between the reference drug and the biosimilar is approximately $21,000 per year in net plan cost. For a Stelara patient, the annual difference is approximately $43,500. Across even a small number of members on these therapies, biosimilar substitution is one of the highest-return cost management interventions available.

Plan sponsors have four main tools to drive biosimilar adoption: preferred formulary placement (putting the biosimilar on a lower tier and the reference drug on a higher tier), step therapy for new patients, automatic substitution where state law permits, and formulary exclusion of the reference drug entirely. The most important variable in any biosimilar strategy is whether your PBM has a financial incentive to keep the reference drug preferred. A PBM earning a large rebate on Humira has a direct financial reason to keep Humira on the preferred formulary, even when the biosimilar costs the plan less on a net basis. Independent PBMs operating on pass-through pricing remove this conflict entirely, because all rebates return to the plan and formulary decisions are made without a competing financial interest.

What Employers Should Be Asking About Their Pharmacy Benefit

High-cost drug management requires active decisions about PBM contract structure, formulary design, specialty pharmacy strategy, and stop-loss alignment. The questions worth asking at every renewal:

  • Is your PBM contract pass-through or spread-based? A pass-through model means you pay exactly what the pharmacy receives and all rebates come back to the plan. A spread-based model means the PBM earns revenue that is not visible in the administrative fee. Request full compensation disclosure under the CAA requirements.
  • Are you receiving all available biosimilar savings? Ask your PBM for a net cost comparison of each reference drug plus rebate against the available biosimilar net price. The answer will tell you whether your formulary is designed around the plan’s cost interest or the PBM’s rebate interest.
  • What is your specialty drug channel strategy? Are specialty prescriptions being filled through your PBM’s affiliated specialty pharmacy? Carving specialty to an independent pharmacy or using a white-bagging program for clinic-administered drugs can generate meaningful cost differences.
  • How does your stop-loss deductible interact with your specialty drug exposure? Model your actual specialty drug claims against your stop-loss threshold. If most of your high-cost drug claims fall below the deductible, the plan is absorbing those costs without triggering reimbursement.
  • Does your formulary have appropriate Tier 4 controls? Step therapy, prior authorization, and quantity limits on specialty drugs reduce cost without eliminating clinical access. Without these controls, high-cost therapies can be approved and dispensed without any plan-level review of whether a lower-cost alternative exists.

Know How Your Pharmacy Benefit Compares

Pharmacy is now one of the two or three most consequential cost management decisions in health plan design. The employers managing it well are not restricting access to the medications their employees need. They are ensuring that the structure of the benefit, the PBM contract, the formulary design, and the stop-loss coverage work together in the plan’s interest, and that every dollar spent on high-cost drugs is spent as efficiently as possible.

Mployer’s benefits rating evaluates pharmacy benefit design as part of the Medical pillar score, benchmarked against a custom cohort matched by size, region, and industry. Knowing where your pharmacy benefit stands relative to employers who actually look like you is the starting point for making better decisions.

See how your benefits package compares to your custom cohort at MployerAdvisor.com.

Sources

Mployer Insights: Average Spend by Setting, Prescription Structure, and High-Cost Specialty Drugs. Source: Mployer Insights analysis.

MedOne Pharmacy Benefit Solutions: Biosimilar substitution impact data for Humira/Yusimry and Stelara/Starjemza. MedOne is a leading independent PBM focused on improving health outcomes and reducing net costs for self-funded employers. [email protected].

Mployer 2025 and 2026 Employee Benefit Plan Design Study, covering 50,000+ employer plans. Individual stop-loss avg $141,938 self-insured.

Consolidated Appropriations Act of 2021, Section 202: broker/consultant compensation disclosure requirements for group health plans.

FDA Biosimilar approval framework: 42 U.S.C. Section 262(k).

Employee Benefits
Is Remote Work More or Less Productive Than On-Site Work?
Remote work remains above pre-pandemic levels in nearly all industries, with tech and professional services seeing the biggest gains. On average, increased remote work participation has led to higher productivity, though its impact varies by industry.
Author:

Key Takeaways:

  • Remote work rose rapidly during the pandemic and remote participation rates among employers remain above pre-pandemic levels in all but 1 industry.
  • Some industries, often involving tech and professional services, have seen outsized growth in remote work participation, while other more on-site-oriented industries like construction, retail, and mining have seen less remote participation growth.
  • Accounting for a variety of factors, organizations that experienced the largest increases in remote work saw correspondingly large increases in work output without incurring comparable increases in input required.
  • On average, by these measures, an increase in remote work participation corresponds with an increase in productivity.  

Article: Is Remote Work More or Less Productive Than On-Site Work?

There is little debate about the significance that the COVID-19 pandemic has had in terms of enabling the rise of remote work and reshaping both the workplace and worker expectations as a result.  

There is considerably more debate, however, about the impacts that remote and hybrid work have on worker productivity.

While attempts over the last few years to quantify change in productivity due to remote work have yielded mixed results, the Bureau of Labor Statistics recently published what appears to be the most comprehensive analysis of productivity as it relates to remote work yet, which yielded some very interesting insights about more than just remote worker productivity.

The Big Question: How Does Remote Work Productivity Compare to On-Site Work Productivity

The simplest answer to the question of whether or not remote work is more, less, or equally as productive as on-site work is that remote work is on average more productive than on-site work.

As is often the case, however, the simplest answer is not necessarily the most helpful or accurate one. There are a number of different factors that can influence whether remote work is more or less productive than on-site work, including industry type and size, as well as less easily generalized factors such as off-site working conditions, which can vary from one employee to the next.

How remote work is defined as well as how productivity is measured are also crucial considerations that can significantly affect whether remote work is more, less, or comparably productive.

The Rise of Remote Work Across Major Industries

Remote work predates the pandemic, of course, and in fact about 6.5% of private sector workers in the US were already working remotely in 2019.

With the implementation of social distancing policies as the Pandemic spread across the US in the spring of 2020, remote work saw a dramatic upswing in many sectors, with some industries seeing more than 30% increases in the proportion of their workforces that are working remotely.  

For the following analysis, the term remote work encompasses both fully remote work and hybrid work arrangements where the majority of work is done off-site.

Remote work rose across all industries in the first years of the pandemic. Although the proportion of employees working remotely fell some as social distancing policies at the workplace expired, remote work still remains above 2019 levels in all industries except the agriculture, forestry, fishing, and hunting industry. This, however, is in part because that industry had one of the top 5 largest remote participation rates among industries even before the pandemic.

Although remote work participation increased across almost all industries into the early post-pandemic years, that increase has not been equally distributed, and some industries have seen much more substantial increases in remote work than others.

In 2019, there were only 5 industries with more than 10% of their workforces working remotely - professional, science, and technical services (16.5%); information (11.4%); finance and insurance (10.5%); real estate rental and leasing (12.4%); and agriculture, forestry, fishing, and hunting (13.6%).  

By the end of 2022, however, more than 75% of major industries had at least 10% of their workforce working remotely.

In fact, as of the most recent data collection, there were only 5 major industries with less than 10% remote participation: retail (9.4%); mining (7.2%); construction (7.8%); food services (4.8%); and transportation and warehousing (8.8%).

At the same time, there are 4 major industries with more than 30% remote work participation, including 1 with more than 40%: information (38.8%); finance and insurance (37.6%); management of companies (33.0%); and professional, scientific, and technical services (41.4%).  

Measuring Remote Work Productivity

While different firms have attempted to use a range of different metrics by which to evaluate remote work productivity, including emails sent, managerial performance reviews, and phone calls logged per hour for example, for the purposes of this analysis, productivity is measured by Total Factor Productivity (TFP).

TFP is calculated by dividing worker output by all the inputs that go into producing that output, which provides a more comprehensive and dynamic understanding of productivity as a function of the varied costs that facilitate production.

For example, TFP takes into account not only the reduced labor costs that can accompany remote work due to remote workers accepting lower wages in exchange for flexibility or because they live somewhere with a lower cost of living, but TFP also takes into account other inputs that can change as a result of remote work, such as reduced office space, utility usage, turnover/recruiting service needs, and on-site/local perks and benefits expenses per employee.

How Industry Type and Size Impact Remote Work Productivity

Industry Type

Each industry has its own set of challenges and opportunities when it comes to implementing remote work, and not all industries have been equally proactive in embracing remote work and/or capturing the maximum productivity/value from remote operational structures.  

In that light, it does not necessarily follow that industries with higher TFP scores are better suited for remote work while industries with lower TFP scores are less well suited because the circumstances involved within each industry and how each has approached remote work can be radically different.

That said, some industries have certainly fared much better than others when it comes to retaining and increasing productivity output relative to input via remote work.  

Some of the industries with the highest TFP ratio, indicating the greatest year-over-year growth in net output over input as remote work quickly escalated during the pandemic, include data processing, internet publishing, and other information services; funds, trusts, and other financial vehicles; publishing; rental and leasing; and chemical products.  

Some of the industries with the lowest (negative) TFP ratios, indicating a loss of productivity correlated with the rise of remote work, include air transportation; oil and gas extraction; metal products; and performing arts, museums, spectator sports, and related activities.  

The industries with the largest productivity gains as remote work rose during the pandemic were funds, trusts, and other financial vehicles; data processing, internet publishing, and other information services; computer system design and related services; and publishing services including software.

The only industries to record decreasing remote work productivity during the pandemic as measured by TFP are securities, commodities contracts, and other financial investments; insurance carriers and related activities; and broadcast and telecommunications.

Industry Size

Productivity gains must also be considered in light of industry size, with relatively smaller industries seeing more extreme productivity swings than relatively larger industries.

Some of the larger industries that recorded remote-work-induced productivity gains include construction; real estate; miscellaneous professional, scientific, and technical services; and federal reserve banks, credit intermediation, and related activities.  

Some of the larger industries that experienced a net decrease in productivity because of remote work’s rapid adoption are retail; wholesale; broadcasting and telecommunications; insurance carriers and related activities; and ambulatory healthcare services.  

In total, across the 61 industries that were analyzed, on average each 1% increase in remote work participation resulted in a 0.08% increase in TFP.

Mployer’s Take

With 7 out of the top 10 industries that recorded the largest increases in remote work during the pandemic all correspondingly increasing their output by a larger margin than their input costs, the correlation between remote work and increased productivity is clear.

That said, remote work is not a one-size-fits-all solution for every given job function or private organization let alone any/every industry.

Certain industries - especially those heavily involving tech, data, publishing, and professional and scientific services - seem to be particularly well-suited for remote working arrangements, while other industries with a disproportionately large number of location-specific jobs like retail, mining, transportation & warehousing, and construction, are less well-suited in general.

That said, within nearly every organization regardless of industry there are jobs that are primed for remote work, even if not every organization in every industry is equally prepared to capture the same value and productivity from remote arrangements where applicable.

Despite the growing evidence of the productivity benefits associated with remote work, however, many organizations may move away from and/or downsize remote programs in the coming years, especially if the job market shifts in favor of employers as it is likely to do.

Larger and older organizations with more established managerial structures may choose to bring employees back to on-site work for a variety of reasons such as fostering collaboration, justifying commercial real estate expenses, and encouraging voluntary turnover in line with planned reductions in the organization’s payroll.

Still, because remote work is most effectively utilized by smaller, more tech-heavy organizations, new market entrants will increasingly rely on remote work to capture the productivity benefits and gain an advantage over the entrenched players in their markets.

As a result, remote work is likely to see an upward trajectory over the long term as successful remote-friendly new entrants grow and absorb an increasing share of the market, but the short-term prospects for remote work growth remain uncertain and may be linked to the greater economy and job market.

As this analysis makes clear, however, on average, remote work is more productive than on-site work, and organizations that are best able to capture that value regardless of industry or organizational size/type can obtain and/or maintain a meaningful advantage over their competition.

Employee Benefits
The Employers’ Guide To The H-1B Visa Debate
The H-1B visa program allows U.S. employers to hire highly skilled foreign workers, primarily in tech and finance. Despite Republican control of Congress, a divide has emerged over its future. Elon Musk and President Trump support the program, while many MAGA voters oppose it, arguing it suppresses U.S. wages. Demand for H-1B visas far exceeds supply, with most recipients from India and China. While expansion seems more likely than reduction, political pushback may shape future reforms. Employers should stay informed as policy changes unfold.
Author:

Key Takeaways

  • The H-1B visa lottery program each year allows US employers to bring in a total of 85 thousand foreign workers with specialized skill sets to work in the US for a period of 3 years, with the possibility of an extension.
  • There are currently about 600 to 700 thousand foreign workers operating in the US under an H-1B visa.
  • The vast majority of H-1B visa holders work in tech within the accounting/auditing, investment banking, and consulting industries, with between 8 and 9 out of 10 H-1B workers originating in India and to a lesser degree China.


The Employers’ Guide To The H-1B Visa Debate

Despite having Republican’s sweep the November elections and win control of not only the White House, but also both chambers of Congress in Washington DC, a stark divide within the party emerged on the issue of H-1B Visas prior to taking formal control of the federal government.

On one side of the debate, head of the Department of Government Efficiency and advisor to the incoming president Elon Musk has taken a strong stance in favor of the H-1B visa program, which has resulted in considerable pushback from a significant portion of President Trump’s MAGA voter base.

In response to the growing debate, President Trump sided with Musk in support of H-1B visas, which seemed effective at preventing the dispute from escalating further, but it remains to be seen if/how that ideological division between MAGA leadership and the MAGA movement will impact H-1B policy going forward as actual legislation and regulation are put on the table in the coming months.

In light of the uncertainty about the fate of the program in the future, we thought it would be worth taking a look at H-1B visas to get a better understanding of the size of the program, the scope of impact that potential that could result from any proposed changes, and what industries and organizations are likely to bear the brunt of the potential impacts.

H-1B Visa Program Background

The H-1B visa program launched in 1990 as a means for employers to obtain temporary work visas for highly skilled foreign professionals who work in ‘specialty occupations’ - often requiring a college degree or higher and specialized, relevant skills - or as fashion models of distinguished skill.  

While the program has evolved some over the years, for the last 2 decades the number of H-1B visas issued each year has been statutorily capped at 65,000 for standard H-1B visas plus an additional 20,000 for applicants with a master's degree or higher obtained from a US college or university.

H-1B visas are distributed via a lottery system and last for a duration of 3 years, although applicants frequently seek and are granted extensions beyond their initial term for a maximum of 6 years, after which time the applicant will need to reapply and obtain a new H-1B visa or the visa-holder must leave the country.

The H-1B Debate

The central question in the debate over H-1B visas is whether or not the H-1B program provides US companies with the talent necessary to keep ahead of and/or keep up with global competitors, or whether the H-1B visa program effectively suppresses wages for US workers by enabling US companies to access specialized labor at a discounted price.

In defense of the H-1B visa, Musk credited the H-1B program as the reason he’s in America, and he said it is responsible for bringing in so many critical people who helped build companies that made America strong.

Opponents of the H-1B visa program often concede that the program can serve a valid purpose in a relatively small portion of cases where a person with unique or rare skills, abilities, and experience must be recruited from outside the US.

In practice, however, opponents argue that the program is primarily used to recruit foreign workers with qualifications that are readily available among the US workforce but who are willing to accept lower wages in order to obtain a US visa, which works against the interests of similarly skilled US workers.

H-1B Visas By The Numbers

There are approximately 600 to 700 thousand foreign workers operating in the US under H-1B visas, but the H-1B visa-holding population tends to fluctuate cyclically.

The low point for the H-1B holders population comes at the end of each fiscal year when some foreign workers begin leaving the country to pursue new opportunities outside of the US before their visas expire, meanwhile, the annual H-1B cap has already been hit so no new foreign workers can replace them until the beginning of the next fiscal year, as depicted in the chart below.

Last year, employers submitted more than 850 thousand applications for H-1B visas, which is more than 10 times the 85,000 annual cap for new H-1B visas, so the demand for these specialized foreign workers among US companies significantly outpaces the available supply.

Demand for these visas among foreign workers is strong , with workers from India and to a lesser degree China accounting for the vast majority of H-1B visa-holders. For example, in 2023, 76% of H-1B visas were issued to workers from India, with the next largest proportion going to Chinese applicants (12%). Men also tend to be disproportionately represented, accounting for 71% of successful H-1B applicants in that same dataset.

The average salary for H-1B visa holders is just under $120,000 per year as of 2024, which is up slightly from about $115,000per year in 2023. As of the most recent data available, about 75% or 3 out of 4 jobs filled by H-1B visa-holders last year paid $150,000or less.

H-1B applications tend to be concentrated in computer science, IT, and/or finance-related work across a relatively limited range of industries, with a handful of tech companies dominating the H-1B lottery, followed by accounting/auditing firms, universities, investment banks, and consultancies.

Mployer’s Take

In the recent H-1B debate, both sides are right in a sense.

The H-1B program has been bringing top (largely tech) talent to the US since the days when the internet was coming through the phone lines, and that talent certainly contributed to building the global digital infrastructure that we’ve come to know today.

It’s also clear that the size of the tech industry where H-1B holders have largely landed and the demand for tech talent in general has grown much faster over the years than the number of H-1B visa holders available to fill that growing demand, so the impact of H-1B visas on the US tech labor force has actually shrunk over most of the last 35 years.

On the other hand, with potentially fewer than 6 million tech workers currently employed in the US, if 75% of H-1B visa-holders are doing or supporting tech work, that could account for almost 10% of jobs in the space and would drive down wages for US tech workers enough to validate their opposition to the program.

Given both Musk and Trump’s stated support, along with significant bipartisan endorsement, the H-1B program does not appear to be going anywhere anytime soon., Even if the program were significantly pared down, the resulting impact on wages would be negligible everywhere outside the tech industry.

That said, the impact of significantly reducing the H-1B program on US tech worker wages could be meaningful, and that is especially true when the tech industry is in a state of contraction itself.

Still, expansion of the H-1B program seems more likely than reduction, but in light of the pushback against H-1Bs we’ve seen from the Republican voter bloc over the last couple of months, any expansion that may be trial-ballooned is unlikely to bring the program back to anywhere near the level of influence it had on the tech industry in eras past.

Under business-as-usual circumstances, the H-1B program would carry on operating undisturbed just as it has for most of the past 20 years and the recent debate would be replaced by another that is just as soon forgotten, but with would-be agents of change like Musk bringing the issue to the spotlight, it is impossible to count out the possibility that the H-1B program could see a massive overhaul of one sort or another in the near future.

If expansion of the H-1B program is proposed in the next few years, it seems a strong possibility that it would be coupled with some kind of accompanying US technical skill training program to help offset any blowback from the base.

Regardless of how the H-1B program is managed over the next 4 years, however, the only real certainty is that the demand for these types of visas will remain strong among employers for as long as they are available, and that demand will likely continue to outpace the supply.

Employee Benefits
Do Your Employee Benefits Make The Grade?
Insights+ empowers employers to benchmark their benefits against competitors, bridging the gap between investment and employee perception. With detailed reports and shareable recognition tools, employers can showcase the true value of their benefits to attract and retain top talent. Available free for qualified employers through December 2024.
Author:

Key Takeaways

  • Insights+ empowers employers to see how their benefits compare to competitors, improving recruitment, retention, and ROI on employee benefit investments.
  • Despite investing millions annually, many employers lack effective ways to communicate the value of their benefits, leaving employees and candidates unaware of what is truly being offered.
  • As the leader in employee benefits benchmarking, Mployer developed Insights+ to provide employers with actionable data and tools to address this communication gap.
  • Insights+ delivers a detailed comparison report and shareable materials, like badges and customized insights, to help employers demonstrate and promote the verified value of their benefits.

ARTICLE I Do Your Employee Benefits Make The Grade?

We are thrilled to announce the launch of Insights+, a first-of-its-kind solution that helps employers understand exactly how their benefits compare to the market and communicate that value effectively. For a limited time, qualified employers can access Insights+ at no cost through the end of 2024.

In today’s competitive talent market, employee benefits play a critical role in attracting and retaining top talent. Employers invest millions into their benefit programs every year, yet many struggle to prove the value of their offerings to employees and job candidates. This creates a costly communication gap where employers provide significant benefits that employees fail to recognize—often undervaluing them by over 50%. On average, that represents about $12,000 in annual value per employee that goes unacknowledged.

With Insights+, we solve this challenge by combining data-driven benchmarking with tools to highlight the value of your benefits in a clear and meaningful way. Employers can now see exactly how their offerings compare to competitors in their region, industry, and size—then showcase this independent validation to their employees and recruits.

Click here to see if you qualify for the free Insights+ early adopter opportunity!

FREE Insights+ Reports For Qualifying Employers -

(Through Dec 31, 2024)

How Insights+ Works

The process is simple. Employers submit their current employee benefits guide or, if one isn’t available, complete a short questionnaire. Using our proprietary database of more than 20,000 employers, Insights+ analyzes the full scope of your benefits, including medical, ancillary, leave, and retirement offerings. Within days, you’ll receive a detailed, 25+ page report that benchmarks your plan against similar employers.

But Insights+ doesn’t stop there. Employers also receive customized recognition tools—including badges and shareable materials—that can be used to communicate the value of benefits during recruitment and to current employees. These materials are designed to help employers bridge the perception gap by providing employees and job seekers with an objective and transparent view of the benefits being offered.

Click Here For A FREE 15 Minute Insights+ Expert Consultation

Why Insights+ Matters

Employers dedicate substantial resources to employee benefits, with the average annual medical benefits investment per employee reaching $23,200. Despite this significant expenditure, employees often fail to recognize the full value of what they receive, estimating the investment at just $11,200. This disconnect between actual and perceived value leaves employees undervaluing their benefits by more than half, which diminishes the impact of those benefits on both satisfaction and retention.

This perception gap isn’t just a communication failure—it’s a lost opportunity. Benefits are a key driver of employee satisfaction, yet when employees don’t understand their value, employers struggle to fully leverage their offerings. Insights+ solves this challenge by providing a transparent, independent analysis of benefit offerings that validates their true worth. Employers receive tools to effectively communicate the significance of their benefits package to both employees and recruits, ensuring that these investments drive the retention, satisfaction, and loyalty they are designed to achieve.

By bridging the gap between what employers provide and what employees perceive, Insights+ helps organizations unlock the full potential of their benefits program, ultimately improving workforce morale and amplifying their competitive advantage in the talent market.

Employee Benefits: A Missed Opportunity for Employers

Employee benefits consistently rank as one of the most important factors in hiring decisions. According to our research, 88% of job seekers evaluate benefits as part of their job search, yet only 22% of employers actively promote their benefits during recruitment. This creates a substantial gap between what candidates need to make informed decisions and what employers provide. For organizations that already offer strong benefits packages, this lack of communication is a missed opportunity to differentiate themselves in a competitive hiring environment.

The failure to clearly convey benefits not only impacts recruitment but also employee retention. When employees lack a proper understanding of their benefits, they are less likely to appreciate their employer’s investment in their well-being. For instance, many employees vastly underestimate how much their employer contributes to their healthcare, with responses ranging from less than 20% to over 80%. These varying perceptions reveal how poorly benefits information is understood across workforces, making it harder for employers to build trust and satisfaction.

Insights+ addresses these issues by offering tools that allow employers to present their benefits clearly, transparently, and effectively. With customized, shareable materials and independent verification of benefit value, employers can close the communication gap and ensure that employees and candidates alike fully understand what is being offered. This transparency enhances recruitment efforts, strengthens retention, and builds a more engaged workforce by helping employees see their employer as a true partner in their well-being.

The Bottom Line for Employers

Insights+ represents a major step forward for employers looking to maximize the impact of their benefits investments. For organizations already offering competitive benefits, Insights+ provides a way to highlight and promote their offerings to recruits and employees. For those whose benefits lag behind, the detailed benchmarking analysis identifies clear opportunities for improvement, helping employers align their benefits strategy with workforce expectations.

Even companies not looking to expand their benefits offerings can use Insights+ to identify cost-effective strategies for targeting candidates whose expectations align with their current plans. In every case, Insights+ delivers actionable insights that help employers achieve faster hiring, stronger retention, and better ROI on their benefits spending.

Mployer’s Take

We believe that transparency and data are critical to helping employers make smarter, more strategic decisions about their benefits. Insights+ delivers on this belief by giving employers the tools they need to evaluate, validate, and communicate the value of their benefits offerings.

For a limited time, we are offering Insights+ at no cost for qualified employers. Don’t miss this opportunity to see how your benefits stack up—and start using the tools that can transform your recruitment and retention efforts.

If you’re interested in seeing how your plan compares, click here to access your free Insights+ report for qualifying employers - otherwise, keep an eye out in future newsletter installments and on the Mployer blog for more information about the program coming soon!

Employee Benefits
Mployer Announces 2024 Winners of Fourth Annual ‘Top Employee Benefits Consultant Awards’ in Houston, The Woodlands, and Sugar Land
Houston, The Woodlands, and Sugar Land Nashville, Tenn.– October 8, 2024 – Mployer, the industry-leader in providing employee benefits research, ratings, and reviews, has named over 750 brokerage office winners nationally in more than 50 regions as part of its fourth annual “Top Employee Benefits Consultant Awards” for 2024.
Author:

Nashville, Tenn.– October 8, 2024 – Mployer, the industry-leader in providing employee benefits research, ratings, and reviews, has named over 750 brokerage office winners nationally in more than 50 regions as part of its fourth annual “Top Employee Benefits Consultant Awards” for 2024.  

Mployer’s Top Employee Benefits Consultant Award Program evaluates each benefits broker and consultant office based on their depth of experience across employer industries, sizes, and plan design features, as well as employer client ratings and reviews.  

“We are proud to recognize this distinct group of 2024 top-rated insurance advisors as part of our fourth annual Top Employee Benefits Consultant Awards,” said Brian Freeman, CEO of Mployer. “Employer-sponsored healthcare and benefits provide care for over 160M Americans. Who an employer selects as their benefits advisor and their plan design has more impact on employee cost and satisfaction than who an employer chooses as the insurance carrier. We have rated each broker using our proprietary M Score and applaud the winners’ demonstrated commitment to service, quality, and positive employer experience.”

In Houston, The Woodlands, and Sugar Land, Mployer has named over 25 benefit brokerages as top brokerages with several of the highest-scoring winners in the market listed below. The Houston, The Woodlands, and Sugar Land job markets are among the most competitive in the U.S. South Central region, employing more than 3.5 million people. Offering competitive employee benefits is a critical factor in hiring top talent for the region’s employers. Finding and partnering with a highly-rated insurance consultant is imperative to attracting and retaining talent in any market.    

Several of the “Top Employee Benefits Consultant Awards” for Houston, The Woodlands, and Sugar Land include:  

To see the full list of Top Employee Benefit Consultant Award winners for Houston, The Woodlands, and Sugar Land, visit Mployer. The above winners are a snapshot of Mployer's matrices and proprietary M Score as of July 2024.

About Mployer:  

Mployer is transforming employee benefits by empowering employers and leading benefit consultants to easily assess, rate, and communicate the value of employee benefits. Providing industry-first transparency through unbiased research, benchmarking, and advanced analytics, our goal is to support employers and brokers in providing benefit plans that optimize costs and employee-employer relationships. To learn more about Mployer, visit https://mployeradvisor.com and follow us on LinkedIn.  

Disclaimer: Rankings are dynamic, and this report may not reflect the rankings currently listed on Mployer’s website. Because Mployer’s research is ongoing, interested companies that want to join next year’s list are encouraged to claim their free profile on Mployer.

Media Contact:  

Anthony Waters

[email protected]

Employee Benefits
Mployer Announces 2024 Winners of Fourth Annual ‘Top Employee Benefits Consultant Awards’ in Philadelphia, Camden, and Wilmington
Nashville, Tenn.– October 1, 2024 – Mployer, the industry-leader in providing employee benefits research, ratings, and reviews, has named over 750 brokerage office winners nationally in more than 50 regions as part of its fourth annual “Top Employee Benefits Consultant Awards” for 2024.
Author:

Nashville, Tenn.– October 1, 2024 – Mployer, the industry-leader in providing employee benefits research, ratings, and reviews, has named over 750 brokerage office winners nationally in more than 50 regions as part of its fourth annual “Top Employee Benefits Consultant Awards” for 2024.  

Mployer’s Top Employee Benefits Consultant Award Program evaluates each benefits broker and consultant office based on their depth of experience across employer industries, sizes, and plan design features, as well as employer client ratings and reviews.  

“We are proud to recognize this distinct group of 2024 top-rated insurance advisors as part of our fourth annual Top Employee Benefits Consultant Awards,” said Brian Freeman, CEO of Mployer. “Employer-sponsored healthcare and benefits provide care for over 160M Americans. Who an employer selects as their benefits advisor and their plan design has more impact on employee cost and satisfaction than who an employer chooses as the insurance carrier. We have rated each broker using our proprietary M Score and applaud the winners’ demonstrated commitment to service, quality, and positive employer experience.”

In Philadelphia, Camden, and Wilmington, Mployer has named over 50 benefit brokerages as top brokerages with several of the highest-scoring winners in the market listed below. The Philadelphia, Camden, and Wilmington job markets are among the most competitive in the U.S. Northeast region, employing more than 3.1 million people. Offering competitive employee benefits is a critical factor in hiring top talent for the region’s employers. Finding and partnering with a highly-rated insurance consultant is imperative to attracting and retaining talent in any market.    

Several of the “Top Employee Benefits Consultant Awards” for Philadelphia, Camden, and Wilmington include:  

To see the full list of Top Employee Benefit Consultant Award winners for Philadelphia, Camden, and Wilmington, visit Mployer. The above winners are a snapshot of Mployer's matrices and proprietary M Score as of July 2024.

About Mployer:  

Mployer is transforming employee benefits by empowering employers and leading benefit consultants to easily assess, rate, and communicate the value of employee benefits. Providing industry-first transparency through unbiased research, benchmarking, and advanced analytics, our goal is to support employers and brokers in providing benefit plans that optimize costs and employee-employer relationships. To learn more about Mployer, visit https://mployeradvisor.com and follow us on LinkedIn.  

Disclaimer: Rankings are dynamic, and this report may not reflect the rankings currently listed on Mployer’s website. Because Mployer’s research is ongoing, interested companies that want to join next year’s list are encouraged to claim their free profile on Mployer.

Media Contact:  

Anthony Waters

[email protected]

Employee Benefits
Mployer Launches Insights+ The Industry’s First Employee Benefits Rating
Mployer, the nation’s leader in providing employee benefits ratings and analytics, today announced the launch of Insights+, an industry-first solution designed to empower employers, employees and leading brokers to rate their employee benefit plans against similar companies and easily communicate their position to employees and recruits.
Author:

Nashville, TN – September 4th, 2024 - Mployer, the nation’s leader in providing employee benefits ratings and analytics, today announced the launch of Insights+, an industry-first solution designed to empower employers, employees and leading brokers to rate their employee benefit plans against similar companies and easily communicate their position to employees and recruits.


Employers spend $1.5T+ on employee benefits each year, yet there is no definitive measure for employers or employees of what good benefits are. Some employers offer benefits much higher than intended overspending on benefits while others provide benefits that lag the market, yet do not know it. Insights+ solves this problem for free by allowing employers and employees to rate their benefits quickly and easily against employers just like them.


Key Features of Insights+include:

1.        Free to use: Employers can access their rating for free by sharing their benefit plans guide. After sharing the guide, you will receive your rating in under 24 hours.

2.        Detailed Plan Assessment: A 25-page assessment of your benefits vs. your custom cohort is available evaluating each component of your benefit package, from medical and contribution to leave and retirement.

3.        Recognition and Communication Package: For employers who qualify, you will receive a Recognition Package to use to promote and communicate the value of your benefits to their employees.

“Insights+ is a game-changer for employers looking to stand out among the competition,” said Anthony Waters, Chief Growth Officer. “Providing recognition for great benefit plans will not only enhance employer branding, but also drive greater employee satisfaction, trust and retention.”


Chris Burns, CFO of Touchstone Closing, shared "Employees and new hires always ask if our benefits are good. We can finally answer that with confidence and show proof with Mployer's Insights+. Being able to see how our benefits compare to similar companies from an independent source is exactly what we needed to be confident and validate in the investment we make in benefits each year."

Insights+ is now available to employers nationwide. To see how your benefits are rated, visit https://mployeradvisor.com/employer-benefit-rating.


About Mployer

Mployer is transforming employee benefits by empowering employers and leading benefit consultants to easily assess, rate, and communicate the value of employee benefits. Providing industry-first transparency through unbiased research, benchmarking, and advanced analytics, our goal is to support employers and brokers in providing benefit plans that optimize costs and employee-employer relationships. To learn more about Mployer, visit https://mployeradvisor.comand follow us on LinkedIn.


Media Contact:

PAN Communications

[email protected]