Employee Benefits
2026 Benefits State of the Union: High-Cost Drugs and What They Mean for Your Health Plan
According to Mployer Insights’ 2026 analysis of 50,000+ employer health plans, prescription drugs account for over 25% of total benefit expenses, with Tier 4 specialty drugs driving the majority of high-cost claims. While Tier 4 copays average $123 with coinsurance requirements in 31% of plans, individual oncology therapies like Darzalex Faspro ($170,800/yr) and Keytruda ($158,200/yr) frequently exceed average individual stop-loss deductibles ($141,938). To mitigate exposure, self-funded employers are increasingly turning to independent, transparent PBM models and biosimilar substitution—which yields up to a 73% net cost reduction per patient.
August 9, 2026

The Likely Fastest-Growing Line in Your Benefits Budget

Modern medicine has produced remarkable advances. Cancer therapies that were not available five years ago are now extending and saving lives. Treatments for autoimmune diseases, multiple sclerosis, and rare genetic conditions are giving employees and their families real options where few existed before. As an employer, providing access to these treatments through your benefit plan is one of the most meaningful things your organization does for the people who work there.

It also comes with a financial reality that every benefits decision maker needs to understand clearly. Over 25% of total employer health benefit expenses are now driven by prescription drugs, and within that figure, a small number of specialty drugs account for an outsized share of the cost. A single covered employee on an oncology therapy can generate $100,000 to $170,000 or more in annual drug spend. A handful of members on these treatments can represent a larger budget impact than the entire pharmacy spend of the rest of your workforce combined. The goal is not to restrict access to these medications. The goal is to understand how the system works, how costs flow, and how to structure your plan so that both your employees and your organization are best positioned for the long term.

This piece covers how the pharmacy benefit system works, how your plan’s tier structure determines who pays what, how stop-loss insurance interacts with high-cost drug claims, and what employers can do to manage this exposure thoughtfully.
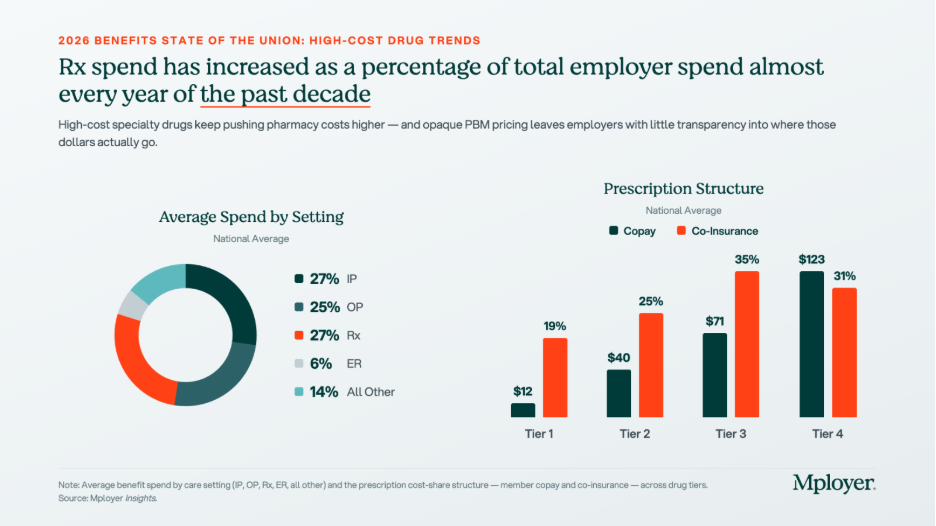
The tier structure in the chart above reflects how plans already account for the cost complexity of specialty drugs. Tier 4, which is where specialty biologics and injectables are typically placed, carries significantly higher cost-sharing than the other tiers: an average employee copay of $123 and coinsurance requirements in 31% of plans. But Tier 4 behaves very differently from the other tiers. On Tier 1, 2, and 3 drugs, cost-sharing is relatively predictable and manageable. On Tier 4, the combination of high drug cost and percentage-based coinsurance can generate out-of-pocket exposure that approaches or exceeds a patient’s annual out-of-pocket maximum in a single month of therapy. How Tier 4 is structured, what controls are in place, and how the plan manages cost is one of the most consequential design decisions an employer makes.

Understanding Your Benefit Plan’s Pharmacy Options

How Pharmacy Benefit Managers Work

Most employer health plans do not manage pharmacy benefits directly. That function is delegated to a Pharmacy Benefit Manager, or PBM, which acts as the intermediary between the health plan, the pharmacy, and the drug manufacturer. The PBM builds and maintains the formulary, negotiates drug prices and rebates with manufacturers, contracts with pharmacy networks, and processes pharmacy claims. The three dominant PBMs, Express Scripts (owned by Cigna), CVS Caremark (owned by CVS Health / Aetna), and OptumRx (owned by UnitedHealth Group), together manage the pharmacy benefits of approximately 80% of covered lives in the United States. Each is affiliated with a major carrier, meaning that employers who use an ASO medical arrangement often default to the carrier’s affiliated PBM without realizing it. Independent PBMs such as Capital Rx, Navitus, and MedOne Pharmacy Benefit Solutions operate on transparent, pass-through pricing models that return all rebates to the plan rather than retaining them as PBM revenue. PBMs are compensated through administrative fees, spread pricing (charging the plan more than the pharmacy receives and keeping the difference), manufacturer rebates in exchange for formulary placement, and specialty pharmacy margin. For any employer managing meaningful specialty drug spend, understanding which of these revenue sources applies to your contract is essential.

How Drug Tiers and Cost-Sharing Work

Every pharmacy benefit plan organizes covered drugs into tiers, with cost-sharing that increases as you move from Tier 1 generics (avg. $12 copay) through Tier 2 preferred brands ($40), Tier 3 non-preferred brands ($71), and into Tier 4 specialty drugs ($123 copay, with coinsurance in 31% of plans). The tier placement of a drug affects both what the employee pays and, indirectly, what the plan pays, since tier placement drives utilization patterns. Plan sponsors have real levers here: step therapy (requiring a patient to try a lower-cost drug first), prior authorization, specialty pharmacy channel mandates, and formulary exclusions all affect Tier 4 cost without eliminating clinical access. These controls require balancing cost management with the reality that for many specialty drugs, no lower-cost alternative achieves the same clinical outcome.

How Stop-Loss Insurance Interacts with High-Cost Drug Claims

For self-funded employers, specialty drug claims are now among the most common triggers for individual stop-loss reimbursement. A single employee on a cancer therapy or rare disease treatment can generate pharmacy claims that exceed the plan’s specific stop-loss deductible, which averages $141,938 nationally for self-insured plans, within a single plan year. The mechanics: the employer pays all claims up to the deductible threshold, and the stop-loss carrier reimburses costs above it. Several dynamics are specific to high-cost drugs. At renewal, stop-loss carriers may laser a known high-cost member by raising their individual deductible or excluding them from coverage. Some carriers now specifically carve out GLP-1 medications or other high-utilization drug categories from stop-loss reimbursement, so employers adding new drug coverage should verify what their contract covers. Specialty drugs can also be administered under either the pharmacy benefit or the medical benefit depending on whether they are self-administered or clinic-administered, and some stop-loss contracts apply different terms to each channel. Employers should model their actual specialty drug cost distribution against their stop-loss deductible at every renewal to understand where the plan’s real exposure sits.

The Costliest Specialty Drugs: What They Treat and What They Cost

The chart below shows the highest-cost specialty and biologic drugs by average cost per patient, ranked from most to least expensive. Cancer therapies dominate the top of the list, but treatments for autoimmune conditions, MS, and inflammatory disease also appear, reflecting how broadly specialty drug spending is distributed across a workforce.
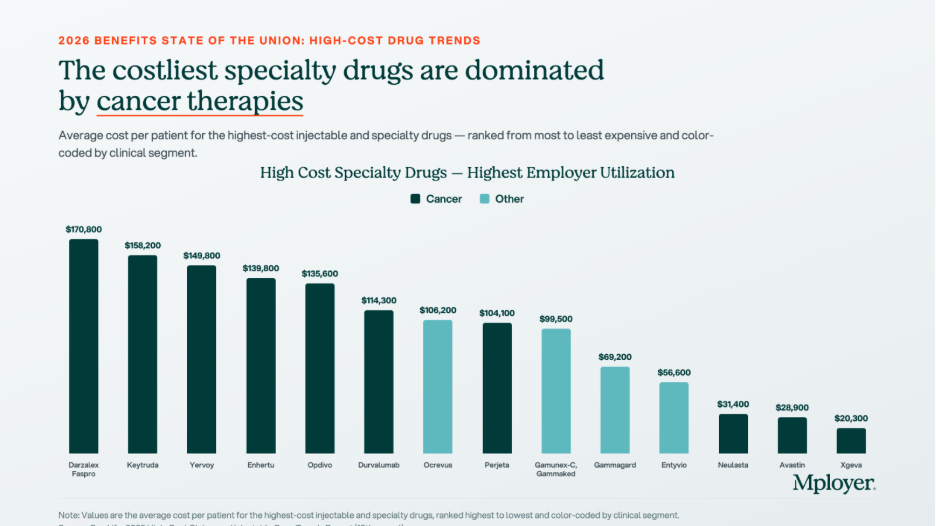
  • Darzalex Faspro (daratumumab/hyaluronidase) | $170,800 avg. annual cost per patient. Janssen (J&J). Multiple myeloma, a blood cancer. The highest-cost drug on the list by average patient cost. The subcutaneous formulation allows home administration, increasing the likelihood it flows through the pharmacy benefit rather than the medical benefit.
  • Keytruda (pembrolizumab) | $158,200 avg. annual cost per patient. Merck. FDA-approved across more than 40 cancer indications including lung, melanoma, head and neck, and bladder cancers. One of the most prescribed oncology drugs globally and one of the most common high-cost pharmacy claims in large employer plans.
  • Yervoy (ipilimumab) | $149,800 avg. annual cost per patient. Bristol-Myers Squibb. Melanoma and in combination with Opdivo for lung and other cancers. Combination Yervoy plus Opdivo therapy is among the highest per-patient drug cost regimens in common use.
  • Enhertu (trastuzumab deruxtecan) | $139,800 avg. annual cost per patient. AstraZeneca / Daiichi Sankyo. HER2-positive and HER2-low breast and gastric cancers. A significant recent clinical advance for patients with cancers that previously had limited options after first-line treatment.
  • Opdivo (nivolumab) | $135,600 avg. annual cost per patient. Bristol-Myers Squibb. Melanoma, lung, kidney, bladder, and other cancers. Frequently used in combination with Yervoy, compounding cost significantly when both are prescribed together.
  • Ocrevus (ocrelizumab) | $106,200 avg. annual cost per patient. Genentech. Relapsing and primary progressive multiple sclerosis. MS therapies are a persistent specialty drug cost driver because patients remain on therapy for years, making each diagnosed member a multi-year plan cost.
  • Entyvio (vedolizumab) | $56,600 avg. annual cost per patient. Takeda. Moderate-to-severe Crohn’s disease and ulcerative colitis. Inflammatory bowel disease therapies are among the most common specialty drug claims in employer plans because the conditions are prevalent in working-age adults.

Biosimilars: The Cost Opportunity Most Employers Are Not Fully Using

A biosimilar is a biologic drug that is highly similar to an already-approved reference biologic, with no clinically meaningful differences in safety, purity, or potency. Biosimilars are not generic drugs in the traditional sense, because biologic drugs are complex proteins manufactured from living cells and cannot be chemically replicated exactly. But they go through an FDA approval pathway that confirms their clinical equivalence to the reference product, and they cost significantly less. The biosimilar market has expanded rapidly as major biologic patents have expired. Humira, the world’s best-selling drug for much of the past decade, now has multiple biosimilar competitors in the U.S. Stelara has followed. The oncology biosimilar pipeline is maturing, with more approvals expected in the next two to three years.
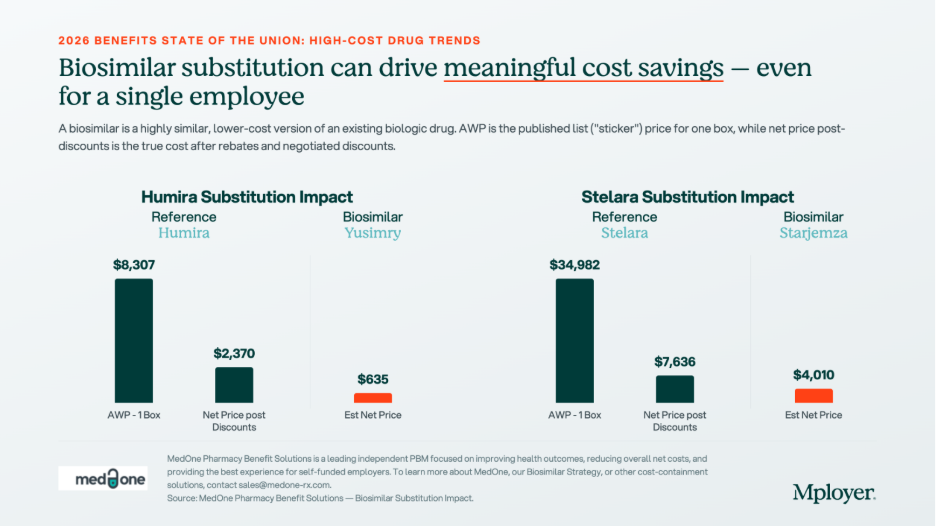
The chart above shows what biosimilar substitution looks like in dollar terms. For Humira, the net price after rebates and negotiated discounts is $2,370 per box. The biosimilar Yusimry has an estimated net price of $635, a 73% reduction. For Stelara, the reference drug net price is $7,636 per box. The biosimilar Starjemza has an estimated net price of $4,010, a 47% reduction. For an employee on monthly Humira therapy, the difference between the reference drug and the biosimilar is approximately $21,000 per year in net plan cost. For a Stelara patient, the annual difference is approximately $43,500. Across even a small number of members on these therapies, biosimilar substitution is one of the highest-return cost management interventions available.

Plan sponsors have four main tools to drive biosimilar adoption: preferred formulary placement (putting the biosimilar on a lower tier and the reference drug on a higher tier), step therapy for new patients, automatic substitution where state law permits, and formulary exclusion of the reference drug entirely. The most important variable in any biosimilar strategy is whether your PBM has a financial incentive to keep the reference drug preferred. A PBM earning a large rebate on Humira has a direct financial reason to keep Humira on the preferred formulary, even when the biosimilar costs the plan less on a net basis. Independent PBMs operating on pass-through pricing remove this conflict entirely, because all rebates return to the plan and formulary decisions are made without a competing financial interest.

What Employers Should Be Asking About Their Pharmacy Benefit

High-cost drug management requires active decisions about PBM contract structure, formulary design, specialty pharmacy strategy, and stop-loss alignment. The questions worth asking at every renewal:

  • Is your PBM contract pass-through or spread-based? A pass-through model means you pay exactly what the pharmacy receives and all rebates come back to the plan. A spread-based model means the PBM earns revenue that is not visible in the administrative fee. Request full compensation disclosure under the CAA requirements.
  • Are you receiving all available biosimilar savings? Ask your PBM for a net cost comparison of each reference drug plus rebate against the available biosimilar net price. The answer will tell you whether your formulary is designed around the plan’s cost interest or the PBM’s rebate interest.
  • What is your specialty drug channel strategy? Are specialty prescriptions being filled through your PBM’s affiliated specialty pharmacy? Carving specialty to an independent pharmacy or using a white-bagging program for clinic-administered drugs can generate meaningful cost differences.
  • How does your stop-loss deductible interact with your specialty drug exposure? Model your actual specialty drug claims against your stop-loss threshold. If most of your high-cost drug claims fall below the deductible, the plan is absorbing those costs without triggering reimbursement.
  • Does your formulary have appropriate Tier 4 controls? Step therapy, prior authorization, and quantity limits on specialty drugs reduce cost without eliminating clinical access. Without these controls, high-cost therapies can be approved and dispensed without any plan-level review of whether a lower-cost alternative exists.

Know How Your Pharmacy Benefit Compares

Pharmacy is now one of the two or three most consequential cost management decisions in health plan design. The employers managing it well are not restricting access to the medications their employees need. They are ensuring that the structure of the benefit, the PBM contract, the formulary design, and the stop-loss coverage work together in the plan’s interest, and that every dollar spent on high-cost drugs is spent as efficiently as possible.

Mployer’s benefits rating evaluates pharmacy benefit design as part of the Medical pillar score, benchmarked against a custom cohort matched by size, region, and industry. Knowing where your pharmacy benefit stands relative to employers who actually look like you is the starting point for making better decisions.

See how your benefits package compares to your custom cohort at MployerAdvisor.com.

Sources

Mployer Insights: Average Spend by Setting, Prescription Structure, and High-Cost Specialty Drugs. Source: Mployer Insights analysis.

MedOne Pharmacy Benefit Solutions: Biosimilar substitution impact data for Humira/Yusimry and Stelara/Starjemza. MedOne is a leading independent PBM focused on improving health outcomes and reducing net costs for self-funded employers. [email protected].

Mployer 2025 and 2026 Employee Benefit Plan Design Study, covering 50,000+ employer plans. Individual stop-loss avg $141,938 self-insured.

Consolidated Appropriations Act of 2021, Section 202: broker/consultant compensation disclosure requirements for group health plans.

FDA Biosimilar approval framework: 42 U.S.C. Section 262(k).
Retirement Planning
Navigating Your Retirement: Your M3 Technology Group, Inc. 401(k) Plan
Understanding your 401(k) plan is a crucial step in securing your financial future. For employees of M3 Technology Group, Inc., this guide provides a detailed look into the specifics of the company's 401(k) plan, offering insights into its features, how to manage your funds, and essential company information.

M3 TECHNOLOGY GROUP, INC. 401(k) PlanInformation

The M3 Technology Group, Inc. 401(k) plan is categorized as a "BelowMarket Plan". This rating reflects certain aspects of its structure,including administrative fees and plan design, which are detailed furtherbelow. While a specific top advisor for this plan was not identified in theprovided data , Ascensus serves as the record keeper for M3 USA, a relatedentity, for its 401(k) plan. For plan-related inquiries, the phone numberassociated with the M3 USA 401(k) plan is 888-652-8086, and the mailing addressis PO Box 10068, Fargo, ND, 58106.  

M3 TECHNOLOGY GROUP, INC. 401(k) PlanDetails

The plan covers 125 participants. It exhibits a strong average annualreturn of 14.27%. The average total contribution per participant is $7,315.36,which includes an average employee contribution of $4,996.11 and a notableaverage employer contribution of $2,319.25. The administrative expenses for theplan are 6.72%. The plan does include a Qualified Default InvestmentAlternative (QDIA) , which helps ensure that passively enrolled participantsare invested in appropriate funds. However, the plan does not allow loans,lacks self-directed investment options, and does not feature auto-enrollment.Additionally, the plan is noted as having no vesting requirements , meaningemployees immediately own employer contributions. The "Below MarketPlan" rating for M3 Technology Group, Inc.'s 401(k) plan, despite arespectable employer contribution and strong returns, is influenced by itsadministrative expenses being higher than top-rated plans and the absence offeatures like auto-enrollment and loan provisions.  

How to Roll Over Your M3 TECHNOLOGYGROUP, INC. 401(k)

Rolling over a 401(k) allows individuals to transfer their retirementsavings from a previous employer's plan into a new retirement account, such asa new 401(k) or an Individual Retirement Account (IRA). This process can helpconsolidate retirement savings, potentially provide access to a wider range ofinvestment options, and maintain tax-deferred growth. It is crucial to followIRS rules precisely to avoid taxes and penalties. For more detailed informationon 401(k) rollovers, including the different types and their implications,please refer to this comprehensive guide: https://www.investopedia.com/ask/answers/081415/how-do-you-rollovertransfer-401k-another-401k.asp.  

How to Withdraw Your M3 TECHNOLOGYGROUP, INC. 401(k)

Withdrawing funds from a 401(k) before retirement, typically before age59½, can lead to significant financial consequences, including a 10% earlywithdrawal penalty in addition to regular income taxes. While it is generallyadvised to avoid early withdrawals, certain IRS-approved exceptions exist, suchas qualifying hardship expenses or leaving your job at age 55 or older (Rule of55). Taking a 401(k) loan is another option to avoid penalties. For a detailedunderstanding of 401(k) withdrawal rules, including penalties and exceptions,visit: How toWithdraw Money From Your 401(k).  

M3 TECHNOLOGY GROUP, INC. Company Info

M3 Technology Group is a leading provider of Networked Audio-Visualsystems, Managed Services, and ITS base building infrastructure. The company isknown for delivering design, installation, and support services to clientsacross various sectors, including education, corporate, military, government,healthcare, entertainment, and worship settings. Founded in 2002, M3 TechnologyGroup's headquarters are located at 925 Airpark Center Drive, Nashville, TN37217. The company's main contact phone numbers are 877-227-0717 or615-227-0717, with technical support available at 833-M3-HELPS. The EmployerIdentification Number (EIN) for M3 USA, a related entity, is 71-0955864.  

Retirement Planning
Navigating Your Retirement: Your Akzo Nobel Inc. 401(k) Plan
Understanding your 401(k) plan is a crucial step in securing your financial future. For employees of Akzo Nobel Inc., this guide provides a detailed look into the specifics of the company's 401(k) plan, offering insights into its features, how to manage your funds, and essential company information.

AKZO NOBEL INC. 401(k) PlanInformation

  • Rating: Below Market Plan  
  • Top Advisor: TOWERS WATSON INVESTMENT     SERVICES  
  • Top Record Keeper: Fidelity Investments  
  • Contact Info for Plan:
       
    • Phone: 629-208-2414  
    •  
    • Address: 535 MARRIOTT DRIVE 5TH FLOOR,      NASHVILLE, TN, 37214  

AKZO NOBEL INC. 401(k) Plan Details

  • Covers Participants: 511  
  • Average Return: 5.38%  
  • Average Total Contribution: $0.00 ($0.00 Employer + $0.00     Employee)  
  • Participation: Not specified in provided data      
  • Qualified Default Investment     Alternative (QDIA): False  
  • Admin Expenses %: 27.96%  
  • Employer Contribution: $0.00 per participant  
  • Plan Design:
       
    • Allows Loans: False  
    •  
    • Self-directed: False  
    •  
    • Auto-enrollment: False  
    •  
    • Vesting Requirements: False  

How to Roll Over Your AKZO NOBEL INC.401(k)

  • Rolling over a 401(k) allows     individuals to transfer their retirement savings from a previous     employer's plan into a new retirement account, such as a new 401(k) or an     Individual Retirement Account (IRA). This process can help consolidate     retirement savings, potentially provide access to a wider range of     investment options, and maintain tax-deferred growth. It is crucial to     follow IRS rules precisely to avoid taxes and penalties.  

How to Withdraw Your AKZO NOBEL INC.401(k)

  • Withdrawing funds from a 401(k)     before retirement, typically before age 59½, can lead to significant     financial consequences, including a 10% early withdrawal penalty in     addition to regular income taxes. While it is generally advised to avoid     early withdrawals, certain IRS-approved exceptions exist, such as     qualifying hardship expenses or leaving your job at age 55 or older (Rule     of 55). Taking a 401(k) loan is another option to avoid penalties.  

AKZO NOBEL INC. Company Info

  • Summary of Company Info: AkzoNobel is a global leader in     paints and coatings, headquartered in the Netherlands. It operates in over     150 countries with approximately 34,500 employees. In North America, with     regional headquarters in Nashville, Tennessee, it has 3,200 employees across     more than 30 sites. The company was certified as a "Top Employer 2020     in the USA."  
  • Contact Info and EIN Number:
       
    • Headquarters: 535 Marriott Drive, Suite 500,      Nashville, TN 37214, USA  
    •  
    • Phone: +1 629 802 3999  
    •  
    • EIN: 56-1349341  

Employee Benefits
State of the Union for US Labor Unions
Union membership in the U.S. has declined from 20% to 10% of the workforce over the past 40 years, yet total union workers have only fallen by 15%. Public sector employees remain five times more likely to be unionized than private sector workers, and union strength varies significantly by industry and region.
Author:

Key Takeaways:

  • Approximately 14.3 million workers - or about 1 in 10 full-time salaried employees in the US workforce - are members of a labor union.
  • Union membership as a proportion of the total workforce has decreased by about half over the last 40 years - from about 20% unionized to about 10% unionized - but the total number of union members has only fallen by a little more than 15%.
  • Hawaii is the state with the highest union membership rate (26.5%), and Librarian (32.3%) is the occupation with the highest union membership rate. In comparison, North Carolina (2.4%) was the state with the smallest union membership as a percentage of workforce, and farming, fishing, and forestry professionals (1.5%) were least likely to be members of unions.
  • Organized labor in general faces political headwinds with the incoming administration despite a Secretary of Labor nominee who has previously sponsored pro-union legislation. 

State of the Union for US Labor Unions

As of this writing in the final week of February 2025, the outlook for organized labor over the next several years and beyond is very much up in the air.

President Trump’s nominee for Secretary of Labor Lori Chavez-DeRemer received scrutiny from both sides of the aisle last week, and her confirmation remains very much in question, with Republicans raising concerns about pro-union legislation she co-sponsored during her single term as a Congressional representative and Democrats criticizing her attempts to distance herself from her previous union support.

In the same week, however, the Acting General Counsel for the National Labor Relations Board - whose pro-union predecessor was fired as one of President Trump’s first official acts after reclaiming office - began rescinding policy memos issued under the Biden administration that provided guidance on topics ranging from non-compete agreements to the digital surveillance of employees.

Given these competing visions within the Trump administration and the Republican Party, there is a great deal of uncertainty about the future of labor unions in the US. Those questions come at a time when major, broad sweeping disruptions to the labor market due to technological advancement - especially artificial intelligence - seem more possible than maybe ever before.

In light of that uncertainty, and coinciding with President Trump’s planned State-of-the-Union-like address to a joint session of Congress next week during which he may very well provide some clarity on the approach his administration will take on labor protections and regulations, we wanted to take a closer look at labor unions as they exist in the US today, both as snapshot of the current environment for organized labor and as a benchmark to measure the success of new policies against as they are enacted and take effect.

US Labor Union Membership By the Numbers

According to the Current Population Survey, about 9.9% of all US workers ages 16 and older were members of labor unions, amounting to about 14.3 million, which is down by about 170 thousand workers from 2023 when there were a little over 14.4 million union members in the US accounting for about 10% of the labor force.

Due to the duty of fair representation, the number of US workers represented by unions is of course even larger than union membership rolls, with a little more than 16 million US workers befitting from union representation in 2024, representing about 11.1% of the workforce, which is down by about 170 thousand workers from almost 16.2 million in 2023, representing about 11.2% of the US workforce then. 

Union membership in 2024 was split approximately evenly between public and private sector employees at about 7 million and 7.2 million, respectively. Because the private sector is so much larger than the public sector, however, the proportion of public sector employees who belong to a union is much greater than the proportion of private sector employees who do so. 

The proportion of public sector US employees that were members of unions in 2024 was 32.2%, which essentially held steady year over year from 2023, whereas the proportion of private sector employees with union membership in 2024 was only about 5.9%, down from 6% the year before.

Almost 4 out of 10 employees on local government payrolls (38.2%) were union members in 2024, which is fairly unsurprising given union strength among police forces, educators, and firefighters, while the industries with the largest unionization rates in the private sector are utilities (18.7% union) and transportation & warehousing (15.8% union).

The lowest unionization rate among government workers belongs to federal employees, only 25.3% of which are unionized as of 2024, which is up from 25.1% in 2023 even though the number of federal employees that are union members fell by more than 130 thousand between 2023 and 2024, dropping to about 1.1 million. 

In the private sector, the lowest unionization rates belong to the finance (0.8% union)  and insurance industries (1.2% union), followed by the professional & technical services (1.2%) and agriculture industries (1.4% union). 

Library and security & protective service workers had the highest proportion of union membership among occupations at 32.3% and 29.6%, respectively, while farm/fishing/forestry workers (1.5% union) and sales professionals (2.7% union) were the occupations with the lowest rates of unionization.

Union membership is lowest in the South and highest along the Pacific and Mid to North Atlantic coasts, with North Carolina (2.4% union), South Dakota (2.7% union), and South Carolina (2.8% union) claiming the lowest unionization rates.

Interestingly, 2 of the 3 states in which unionization was highest in 2024 were not connected to the continental US, with Hawaii and Alaska recording 26.5% and 17.7% union membership, respectively. New York (20.6% union), Connecticut (16.5%), and Washington (16.0%) had the highest unionization rates among contiguous states. 

Almost 3 out of 10 union members (29%) now live in just 2 states - New York and California - which is almost double the percentage that all workers from New York and California - union and non-union alike - represent as a portion of the total US workforce (17%). 

Mployer’s Take

Over the last 40 years, the proportion of the US workforce that belongs to a labor union has decreased by half - from a little more than 1 out of 5 full-time salaried US workers with union membership in 1983 to about 1 in 10 as of 2024.

During that same time, however, the actual number of union workers in the US has been reduced by a considerably smaller margin, with only about 2 million fewer union employees working in the US today than there were in the mid-1980s, accounting for only an approximate 15% decrease in total union membership over the last 4 decades.

In effect, as the US and the US worker population has grown, union workers as a proportion of the total population has decreased considerably, but union workers and union jobs have remained fairly entrenched nonetheless, even if unable to keep up with population growth and economic expansion.

If current union membership figures rely on entrenched workers, however, those workers are rapidly aging out of the workforce, and how well-protected those jobs are going forward may be put to the test sooner than later. 

Just looking at the age breakdown alone paints a fairly grim picture of the future of union membership. For example, workers between the ages of 45 and 54 have the highest rate of unionization at 12.6%, while workers ages 16 to 24 claim the lowest proportional union membership at 4.3%.

That said, although unionization was much higher among full-time workers (10.7% union) compared to part-time workers (5.7% union) in 2024,  the percentage of unionized full-time workers fell last year (minus 0.2%) while the unionized percentage of part-time workers increased (plus 0.5%), which is a noteworthy development. With growth in part-time employment outpacing full-time growth, unionization may have some tailwinds here.

Realistically, however, while the future head of the Department of Labor remains unknown for the time being, the current nominee is representing positions that are both more favorable toward organized labor than any potential future nominee from this administration is likely to be, but also less favorable toward organized labor and worker protections than the previous Secretary of Labor, so the trend is apparent even if the ultimate appointee is not. 

Still, the advantages that unions offer to workers remain significant, perhaps most notably when comparing pay rates, with full-time, salaried union workers bringing in median annual earnings of about $70 thousand in 2024 whereas non-union members earned a little less than $60 thousand under the same conditions, which is more than 15% less.

The momentum is working against the expansion of unions and enhanced worker protections, however, and if President Trump’s first term and/or Elon Musk’s questioning of the constitutionality of the National Labor Relations Board serve as any indication, the momentum against organized labor is more likely to intensify than to subside over the next few years at least.

Employee Benefits
The Ozempic, Semaglutide, and GLP-1 Problem For Employers
Rising demand for GLP-1 weight-loss drugs like Ozempic is forcing employers to rethink coverage. While some see potential long-term healthcare savings, others are restricting access due to soaring costs. With nearly half of employers reporting GLP-1 claims making up 10%+ of healthcare expenses, balancing affordability with employee wellness remains a key challenge.
Author:

Key Takeaways:

  • The prospect of significantlong-term healthcare cost savings is enticing an increasing number of employers to cover GLP-1 drugs for weight loss purposes, but the expensive upfront costs that accompany those prescriptions are also leading a substantial number of employers to restrict access to these medications if not forgo their coverage entirely.
  • Multiple surveys indicate that between 24% and 44% of US employers with 500 or more employees offer some form of GLP-1 coverage for weight loss.
  • In one study, patients with heart failure and another cardiovascular disease (ASCVD) that utilized GLP-1 drugs for weight loss reported between 25% and 36% reduction in average annual medical costs per person, respectively.
  • The costs of GLP-1 prescriptions utilized for weight loss purposes accounted for 10% or more of total annual claims filed for nearly half of employers respondents (47%) in one survey.
  • Approximately half of all US adults may be eligible for a GLP-1 prescription.

The Ozempic, Semaglutide, and GLP-1 Problem For Employers

Since the Food and Drug Administration first approved semaglutide (a type of GLP-1 drug) as an injectable weight loss medication in 2021, the demand for brand name versions like Ozempic and Wegovy has skyrocketed. With skyrocketing demand has come skyrocketing prices, however, and neither the demand for these prescriptions nor their price points appear likely to come down any time soon.

Much of the demand for these drugs is a direct result of just how effective they have been, at least in the short term. What remains to be seen is how effective these medications will ultimately prove to be in reducing the incidence of tangential, obesity-related conditions in the long term, and what range of associated healthcare cost savings can be expected as a result.

This represents the central dilemma of semaglutide coverage, which is whether the uncertain future benefits justify the substantial upfront costs.

Further complicating the issue is the uncertainty surrounding future benefits. These are amplified for employers, which also have to account for turnover risk when weighing long-term investments in the health of employees who may no longer be with the organization by the time those benefits are realized.

Taken together, these factors are inspiring an increasing number of employers to rethink their approach to semaglutide coverage and how it fits into their larger organizational mission, not just in terms of their health plans but also in terms of talent attraction, retention and workforce management.

Employer Semaglutide and GLP-1 Coverage By The Numbers

According to the Kaiser Family Foundation (KFF), only about 18% of all large firms (defined here as those with 200 or more employees) offered semaglutide and/or other similar GLP-1 medications for weight loss purposes in 2024. 

The proportion of employers offering these medications tends to increase as employer increases in size as well, with KFF’s data indicating that about 16% of employers that have between 200 and 999 employees offering semaglutide and/or other GLP-1 coverage for weight loss, while 24% of employers with between 1,000 and 4,999 employees cover these prescriptions, and 25% of employers that have 5,000 or more employees do so. 

Data from Mercer, on the other hand, points to much more widespread adoption of GLP-1 medication for weight loss, with 44% of large employers (defined here as those with 500 or more employees) offering semaglutide and/or GLP-1 coverage in 2024 - a 3% increase up from 41% in 2023. An even larger proportion (64%) of the largest employers (defined here as those with 20,000 or more employees) covered these medications in 2024, up from 56% in 2023 representing 8% year-over-year growth. 

Although these figures do not allow for an apples-to-apples comparison, they clearly represent a fairly wide coverage range, with KFF reporting much lower rates of semaglutide and GLP-1 coverage than Mercer, but this data discrepancy can perhaps be explained in part by the 31% of KFF survey respondents who stated they did not know whether their employers largest health plan covered these medications for weight loss treatment. 

The International Foundation for Employee Benefit Plans (IFEBP) survey was somewhere in between KFF and Mercer, estimating that about 34% of US employers (no employee count specified) offered GLP-1 drugs for weight loss purposes in 2024, which is up 8% from 26% in 2023.

Data from the same IFEBP survey indicates that GLP-1 drug costs as a proportion of total annual claims are increasing, with GLP-1 expenses accounting for an average of 8.9% of total annual claims for US employers, up from 6.9% in the 2023 survey. 

In total, 21% of employers reported that GLP-1 medications were responsible for 2% or less of total claims, while 47% of employers reported that GLP-1 medications amounted to 10% or more of total annual claims.

Rising GLP-1 Costs Lead To Health Plan Changes

Demand for these medications has led to substantial financial losses according to data released by a number of entities in the healthcare industry that are all telling very similar stories about how semaglutide and GLP-1 prescriptions for weight loss are affecting their bottom lines.

Many insurers took a GLP-1-related hit last year, for example, Blue Cross and Blue Shield of Massachusetts recorded losses amounting to nearly $115 million dollars just in the first 3 quarters of 2024, which corresponded with an approximate 250% increase in GLP-1 claims over the same period.

Hospital systems were comparably affected, for example, UPMC out of Pittsburgh posted an even larger loss of about $370 million over the same term, which it attributed to increased medical utilization and pharmacy costs, while Highmark Health - also of Pittsburgh - despite avoiding operational losses, reported a significant decline in operating gains in 2024 relative to 2023, which administrators blame on high prescription drug costs - most notably GLP-1s.

According to the Chief Pharmacy Office at UPMC, the “costs are unsustainable” due to the “explosion in demand” and many organizations are implementing additional cost controls in an attempt to suppress some of these quickly ballooning expenditures. 

For insurers and care providers alike - the path forward of least resistance seems to involve increased prior authorization in the short term while the supply chain becomes better capable of meeting demand over time.

But for employers who must also take into account the role that their health plans play in terms of talent attraction and retention, controlling costs via adding additional obstacles and further limiting access to an increasingly popular weight loss option can be counterproductive and risk increased turnover.

How Are Employers Adapting?

These high cost and high demand dynamics have led to two separate trends among US employers - some employers are dropping GLP-1 coverage for weight loss and others are expanding GLP-1 coverage for weight loss, and the difference is largely driven by how one calculates and weighs the potential long-term health benefits in the cost-benefit analysis.

Even for employers betting that the potential long-term health benefits associated with GLP-1 utilizations and weight loss -  including reduced risks for cardiovascular and kidney disease - will ultimately outweigh the substantial upfront costs, those rising upfront costs are becoming problematic. 

In a previous piece covering semaglutide and other GLP-1 medication, we discussed some of the ways that employers are adapting in order to offer these drug treatments to employees without exposing the health plan to out-of-control costs, including implementing lifetime caps, minimum BMI caps, and limiting access to cheaper GLP-1 options:

  • Lifetime Cap: Some employers are limiting their exposure to excessive GLP-1 weight loss expenses by setting a lifetime cap on the amount of funds available to covered employees. The Mayo Clinic, for example, instituted a lifetime cap of $20,000 per person to provide meaningful access to these drugs for weight loss purposes while also putting a ceiling in place on a rapidly growing expense line item. 
  • Minimum Body Mass Threshold: Other companies have set a minimum body mass index that must be met to qualify for GLP-1 weight loss drugs, limiting cost exposure by limiting the size of the population with access to these treatments. Fairview Health Services, for example, only offers GLP-1 weight loss coverage to employees with a body mass index of 40 or higher.
  • Limit GLP-1 Options Covered: Some employers also restrict the number of GLP-1 weight loss drug options to only those that are the most cost-effective at any given time, which may also reduce demand.

Just as many private health insurers may come to increasingly rely on prior authorization and reduced access to these prescriptions to rein in costs, many employers may likely implement similarly tightened restrictions over the next few years.

While reducing the number of potential employees with access to these medications can be an effective safeguard against overrun expenses, it also limits how effective those health plans may be as talent retention and attraction tools.

Should the popularity of GLP-1 treatment for weight loss maintain its current trajectory, the next evolution of GLP-1 access for self-insuring employers may involve both restricted access for employees based upon qualifying criteria (e.g. BMI threshold exceeded, payment cap not exceeded, etc.) and also expanded access in the form of perks or incentives for employees who do not otherwise qualify for coverage.

What Comes Next?

Access to some GLP-1 drugs is already starting to improve as a result of pharmaceutical and insurance companies exploring new cost-saving approaches and proactively working with legislators to bring down some of these expenses.

Just a few months ago in December 2024, for example, drugmaker Eli Lilly teamed up with a telehealth platform to offer a non-semaglutide GLP-1 alternative for weight loss directly to consumers for less than half the price that Ozempic and Wegovy in many cases.

Drugmakers are also making significant headway in developing and releasing generic versions of GLP-1 medications, with the FDA approving the first 2 generic GLP-1 drugs in November and December 2024, respectively, although neither of those drugs has weight-loss-specific uses.

It will still be a while before generic semaglutide medication becomes available, as it most likely won’t hit the market for another 5 or 6 years in 2030 or 2031.

There is a $4.1 billion facility in the works where significant quantities of Ozempic and Wegovy can be manufactured, which will increase the available supply of these drugs and hopefully bring down the sticker price, but it will be at least 3 or 4 years before these products would be available.

On the public front, the Department of Health and Human Services recently added both Ozempic and Wegovy to the list of drugs covered under Medicare Part D which will be subject to price negotiations in 2025. Although these negotiations won’t directly apply to prescription prices for private buyers, they may still set a benchmark that results in lower prices across the board. Even then, the new Medicare prices and any related private market impacts won’t come to be for another 2 to 3 years in 2027 or 2028.

In short, there are a number of potential changes in the supply chain that are likely to reduce upward pressure on prices for semaglutide and GLP-1 medications in the years ahead, but that supply-side price relief may not come all at once and could even conceivably be outpaced and canceled out by upward price pressure due to growing demand.

Mployer’s Take

The effectiveness of some GLP-1 medications as a weight loss drug has been pretty clear for several years, though the long-term tangential benefits of GLP-1-assisted weight loss will likely take another 5 to 10 years, at least, to be more fully assessed. Additionally, it will likely also take 5-plus years before the GLP-1 weight loss prescription costs normalize and find their equilibrium in the market.

As a result, there is a potential 5-plus year window of uncertainty before the cost-benefit uncertainty is effectively settled. With employers currently split and trending in diverging directions around their coverage of GLP-1 for weight loss, there is an opening for employers to establish a significant advantage over competitors who approach GLP-1 coverage differently.

Given that some studies are already showing significant healthcare cost savings associated with tangential GLP weight loss benefits, however, the odds that long-term benefits exceed the short-term costs of covering GLP-1 weight loss medication seem to be going up. 

For example, one study found that GLP-1 use for weight loss across approximately 2,000 patients with heart failure and/or specific cardiovascular diseases reduced annual healthcare expenditures by $7,500 to around $9,000 dollars per person.

The opportunity for those kinds of cost savings makes GLP-1 coverage seem like an easy choice for employers.

At the same time, however, it is easy to see why employers that focus on short-term costs and/or the scope of the potential demand want to severely restrict access to these medications for weight loss purposes if not eliminate coverage entirely.

That perspective is especially understandable considering that more than half of US adults could be eligible for GLP-1 use either for diabetes, obesity, or heart conditions - the overall population who may want/need access to these drugs is large enough to be cause for concern for any payer - even those as large and well-funded as the US government.

Demand calculations based on the total number of potentially eligible, qualifying candidates that could benefit from any given medication, however, are not necessarily fair reflections of demand.

One recent Morning Consult poll, for example, found that 62% of respondents claimed they would rather make a diet change than use an injectable weight loss drug in order to lose weight, and that preference was even stronger among certain demographics, including men, baby boomers, residents of the Northeastern part of the country, post-graduate degree holders, and people earning more than $100,000 annually.

People can and do change their minds, of course, and there are certainly many people who may come around to the idea of utilizing GLP-1 as the user base grows and the effectiveness of the drugs becomes more apparent.

However newfound perspectives do not often emerge in mass overnight, and the process of millions of individuals reevaluating a personal position and reversing course takes time, just as increasing the supply of these drugs takes time and just as collecting evidence on long-term cost savings takes time. 

In light of those potential long-term healthcare savings and the encouraging numbers we’ve seen on that front so far, however, assuming that demand doesn’t spike in line with worst-case scenario forecasts over the next few years, the trend toward covering semaglutide and GLP-1 for weight loss purposes with some restrictions seems likely to pick up momentum barring unforeseen events.

HR Compliance
Federal Court Ruling May Put Millions of US Companies In Breach of ERISA Fiduciary Duty
A Texas court ruled that American Airlines breached its ERISA duty of loyalty by failing to properly oversee BlackRock’s ESG-driven investment decisions. The decision could put millions of employers at legal risk if upheld. Are ESG investments in retirement plans now a liability?
Author:

Key Takeaways

  • A Federal District Court Judge in Northern Texas ruled that American Airlines had breached its duty of loyalty to its employees under ERISA because BlackRock, the investment manager American Airlines had enlisted to manage its retirement accounts, had promoted ESG policies that the judge determined went against the financial interests of the employee beneficiaries.
  • The repercussions of this ruling could be industry-reshaping if upheld. However, many additional conflicts of interest between American Airlines and BlackRock may not be broadly applicable to most potential cases with a similar fact pattern. This case may be especially egregious even among similar cases given that the judge views ESG policy interests and fossil fuel company financial interests as being in direct opposition.
  • While it is recommended that employers eliminate conflicts of interest with retirement fund investment managers wherever possible and optimize communication and oversight reporting with both internal and external auditors, it remains unclear if American Airlines would have been in breach of its duty of loyalty had it maintained better oversight over BlackRock and had BlackRock continued factoring ESG considerations into investment decisions anyway.

Article - Federal Court Ruling May Put Millions of US Companies In Breach of ERISA Fiduciary Duty

A recent ruling from a Federal judge in Texas has put nearly every company in the US that offers a retirement or pension fund at risk of being sued for failing to uphold their fiduciary duties to their employees.

The core issue of the case is whether an employer can be found in violation of the Employee Retirement Income Security Act (ERISA) as a result of entrusting retirement funds to investment managers that take into account corporate environmental, social, and governance (ESG) considerations when managing those funds.

Based on this latest court ruling, much to the surprise of many legal observers, the answer to that question appears to be ‘yes, companies can be held liable for retaining retirement fund investment managers whose investment practices incorporate ESG principles’ - at least for the time being.

What remains to be seen, however, is the amount of money that the defendant company will have to pay as a result of their adjudicated infraction, which in turn is likely to have a major impact on how widespread the repercussions of this ruling will be given that a string of both appeals and copycat plaintiffs are almost certain to follow any final order front the judge that includes a substantial amount of money changing hands.

Spence v. American Airlines

The lawsuit in question was filed in the Summer of 2023 when a senior pilot with American Airlines initiated a class action lawsuit against his employer on behalf of more than 100,000 participants in a 401(k) plan offered by American Airlines.

The issue at hand stems back to an incident that occurred 2 years prior in the summer of 2021 when global investment giant Blackrock joined other major investment managers and activist investors to exercise their shareholder voting rights and elect 3 ESG-friendly board members to the 12-member ExxonMobil Board of Directors, which is an outcome ExxonMobil leadership at the time had spent months fighting to prevent.

Spence claimed that Blackrock was engaging in the pursuit of ‘non-financial ESG policy goals’ and that American Airlines was in violation of their fiduciary duty by utilizing Blackrock as investment managers for the management of those 401(k) funds.

Fiduciary Duty: Prudence & Loyalty

In accordance with ERISA, employers, and their agents - such as plan trustees, plan administrators, and members of plan investment committees - owe a fiduciary duty to act and make decisions that are in the best interests of plan beneficiaries.

This fiduciary duty encompasses many responsibilities under the law, including a responsibility to diversify investments, avoid conflicts of interest, and follow plan guidelines, but in the class action lawsuit Spence brought against his employer American Airlines, however, he alleged only violations of the fiduciary duty of prudence and the fiduciary duty of loyalty.

Interestingly, the standards and regulatory guidance for evaluating prudence and loyalty in the context of fiduciary duty have been in flux in recent years, with the Department of Labor for the then-outgoing Trump administration issuing final rules with amendments regarding the fiduciary duty of prudence and loyalty in mid-November 2020.

According to those amendments, prudence requires plan fiduciaries to make investment decisions based exclusively on “pecuniary” or financial factors. Loyalty requires that plan fiduciaries determine that potential investment alternatives are ‘economically indistinguishable’ from each other before fiduciaries can take into account potential collateral benefits beyond investment returns, in which case those collateral benefits essentially function as a tie-breaker.

In November of 2022, however, the DOL for the Biden administration issued a final rule that interpreted the fiduciary duties of prudence and loyalty in a way much more favorable to ESG considerations.

According to the Biden DOL clarifications, prudence requires decisions to be based on relevant risk and return factors with ESG being among the factors that can be rightly considered, and loyalty does not prevent plan fiduciaries from taking collateral benefits into account so long as plan alternatives equally serve the financial interests of beneficiaries over time.

While the Biden DOL’s final rule overrode the final rule issued by the Trump administration DOL in November 2020, Biden’s final rule did not take effect until January of 2023, so the Trump DOL rules were still applicable when Blackrock was among the investors that won the proxy battle against ExxonMobil in the summer of 2021.

Now that Trump has returned to the White House, it’s also worth noting that the definitions of prudence and loyalty about fiduciary duty under ERISA are likely to revert to the interpretations his previous administration issued shortly before he left office in 2020.

Where Did American Airlines Go Wrong?

In evaluating Spence’s claims against American Airlines, the judge determined that American Airlines had been prudent, but they had not been loyal.

Although Spence claimed that American Airlines had violated its duty of prudence by not directly monitoring Blackrock’s proxy voting activism and instead depending on a third party to do so, the judge ruled that the employee benefit committee at American Airlines had been prudent and exceeded industry expectations by meeting regularly with both internal and external experts to review and monitor plan performance.

As for Spence’s claim that American Airlines had breached their duty of loyalty, however, the judge determined that American Airlines was in fact in violation of the law because they failed to keep their own “corporate interests separate from their fiduciary responsibilities” which led to “an impermissible cross-pollination of interests and influence on the management of the Plan.”

The judge found that Spence provided sufficient evidence showing American Airlines was incentivized to ignore BlackRock’s shareholder activism in part because BlackRock owns both hundreds of millions of dollars worth of American Airlines stock, as well as hundreds of millions of dollars worth of American Airlines debt, which may have led American Airlines to become lax in its oversight of BlackRock’s retirement fund management practices.

In support of his finding that the duty of loyalty had been breached, the judge also cited an American Airlines employee who served both as corporate liaison to BlackRock and as a member of the American Airlines fiduciary committee and said that billions of dollars of potential loans might have been at risk if American Airlines had not followed ESG reporting protocols.

The judge further noted in support of his conclusion that the American Airlines asset management group had not requested information about BlackRock’s proxy voting, nor had American Airlines expressly asked the third-party consultant to review Blackrock’s proxy activities, nor had American Airlines received mandated reports from BlackRock about their proxy voting intentions.

Although he made clear in his judicial opinion that ESG considerations are not entirely impermissible and can be taken into account purely from a financial perspective as another factor or tool that can be utilized to help maximize long-term financial gain, the judge did not find that to be the case in this instance where BlackRock’s climate change goals seem at odds with the financial interests of ExxonMobil, whose primary area of business involves selling fossil fuels.

What Happens Next?

Recommendations as to what losses were incurred and what remedies are most available and appropriate were due from both Spence and American Airlines by the end of January, which the judge will review before ultimately deciding on damages.

Although the judge has already found American Airlines to be in breach of its duty of loyalty, the penalties assessed for their infraction will likely be very influential both on a micro and macro level and can significantly impact how widespread the impact of this decision will be.

For one, the amount of damages owed will probably play a significant part in American Airlines’ decision on whether or not to appeal the ruling in this case, which would result in drawing more attention to the lawsuit and either solidifying or overturning the ruling.

Equally if not more importantly, the severity of the remedy that the judge ultimately hands down will directly determine whether the damages awarded are sufficiently large to inspire a wave of lawsuits initiated by employees against their employers on similar grounds now that they have been validated in court.

Mployer’s Take

The potential size of the seismic quake that could come in the wake of this ruling can hardly be overstated.

That said, at this stage of the game, it is not yet certain at all that the aftershocks of this lawsuit will extend beyond the Northern District of Texas.

If the judge decides to bring his hammer down on American Airlines and requires them to pay a steep penalty, there may well be tens to hundreds of millions of plaintiffs who come out of the woodwork ready to step up and sue their employers on similar grounds.

In fact, in the inciting incident in this case, BlackRock was joined by State Street and Vanguard in electing the 3 dissident members to ExxonMobil’s board. These firms have all been ESG proponents and collectively are responsible for managing over $5 trillion in retirement assets - more than 12% of total retirement funds in the US - which could lead to tens of millions of additional plaintiffs from this one incident alone.

It’s unclear at this point just how broad this decision will ultimately prove to be beyond this particular case and proxy voting incident, however, since the judge pointed to the friction between climate change economics and fossil fuel economics as particularly at odds, and there were several clear conflicts of interest and breakdowns in communication and/or oversight on the part of both American Airlines and BlackRock, as well.

On the other hand, despite the conflicts of interest and insufficient proxy voting oversight, it remains unclear just what American Airlines was supposed to do to avoid this outcome in the first place.

Regarding the conflicts of interest, American Airlines presumably utilized BlackRock as a creditor because they provided the most favorable loan arrangements, and the airline has no control whatsoever about the equity stake in their company that any given investor like BlackRock might control at any given time.

The judge even noted in his decision that BlackRock’s significant ownership stake and outstanding debt with American Airlines “are not enough on their own to constitute disloyalty,” which seems to indicate the crux of the fiduciary duty violation is really the lack of oversight.

Even if American Airlines had been monitoring BlackRock’s ESG advocacy more closely, however, they were in no position to meaningfully influence BlackRock’s investment strategy one way or the other.

Essentially, if American Airlines violated its duty of loyalty by not monitoring BlackRock’s ESG promotion, then American Airlines would also have been in violation of its duty of loyalty just the same if it had been monitoring BlackRock’s proxy voting and had continued utilizing its retirement investment services anyway, so what choice did American Airlines have except to find a different investment manager that did not incorporate ESG into their investment decision-making process?

Regardless of how this case proceeds, one central takeaway from this situation is that employers would be wise to minimize conflicts of interest with retirement fund investment managers wherever possible, in addition to maximizing communication and oversight reporting with internal and external auditors.

The question as to what standards and by what measures employers are expected to hold retirement investment fund managers to account, however, especially about ESG-related issues, may not be adequately addressed, let alone answered, until long after this case reaches its final resolution.

It is still very possible, even after the judge’s finding that American Airlines breached their fiduciary duty to their employees that this case will ultimately conclude relatively quietly. If this ruling is upheld and reinforced in follow-up cases, however, it may simply be the end of ESG investing or we may very well be on the cusp of experiencing a sea-change-like shift in the employee benefits management industry.

Employee Benefits
Are Centers of Excellence On the Decline?
Centers of Excellence (COEs) may have peaked. While mid-sized employers increased adoption, the largest companies are scaling back. Is this a temporary dip or a shift in employer healthcare strategy?
Author:

Key Takeaways

  • About 1 in 5 large employers (200 plus employees) offering health benefits in the US utilized Centers of Excellence programs in 2024, mirrored the utilization rate among large employers in 2023.
  • Although total Centers of Excellence utilization was consistent among all large employers between 2023 and 2024, the utilization rate increased among the smallest subset of large health-benefit-offering employers (those with 200 to 999 employees), while Centers of Excellence utilization fell among employers with 5,000 or more employees.
  • Centers of Excellence can lower costs for employers by more than 10%, which is why a substantial number of employers require employees to seek care from designated Centers for Excellence for certain procedures, and why an even greater proportion of employers are willing to cover employee travel expenses to do so.

Article: Are Centers of Excellence On the Decline?

The proportion of employers offering employee health plans that utilize Centers of Excellence may have hit its high water mark and begun to recede among the nation’s largest employers. 

Centers of Excellence have been an increasingly prominent component of employer-sponsored health plans since they were first introduced in 2014. Still, after 10 years of largely consistent growth, the tide may be turning. 

Centers of Excellence: By The Numbers

In the US in 2024, about 19% of all employers that have 200 or more employees and provide health benefits offered access to some form of Center of Excellence program to their employees.

That number has essentially remained unchanged at 19% year-over-year from 2023 for all US employers that provide health benefits and have 200 or more employees, which indicates that the Center of Excellence adoption growth has stalled at the macro level across all large employers within this range.

What’s more interesting, however, is noting how Center of Excellence participation has changed from 2023 to 2024 when breaking down the large employer into smaller demographic subsets, which reveals a less optimistic vision for the future of Center of Excellence program growth.

From 2023 to 2024, among employers that offer health benefits, for example, the smallest subset of large employers - those with between 200 and 999 employees - increased from about 15% that had incorporated Centers of Excellence into their offerings in some way as of 2023, to 16% who have done so as of the 2024 data.

While that change reflects a relatively small increase in proportion, employers with between 200 and 999 employees are also the largest subset of large employers, so even a small increase in participation percentage indicates a significant number of employers incorporating new Centers of Excellence options into their health plan offerings that they did not provide the year before.

That said, the Center of Excellence adoption trendline is moving in the opposite direction for employers with between 1,000 and 4,999 employees, as well as for employers with 5,000 or more employees on their payrolls.

In 2023 among employers that offer health benefits and have between 1,000 and 4,999 employees, about 31% offered Center of Excellence programs for at least some conditions and/or procedures. By 2024, however, that percentage had shrunk to 29%.

The Center of Excellence participation slide was even more pronounced in firms that offer health benefits to their 5,000 or more employees, which decreased from 45% to 39% in a massive 6% year-over-year drop.

In this light, while Center of Excellence programs among health-benefit-offering employers may look stable across large employers with 200 or more employees as a whole, a small percentage gain among the subset of large employers that have the largest number of employers is offsetting more substantial participation loss among employers with 1000 or more employees.

Given that larger employers often have a disproportionate impact in shaping workplace trends and workforce expectations, Center of Excellence supporters and proponents seem to be losing ground in the most influential places, which does not bode well for these trends to turn around in the near future.

Centers of Excellence: Background

It’s been 11 years since 8 self-insured employers joined forces to establish the Employer Center of Excellence Network (ECEN), which has served as both a catalyst and model for the proliferation of Centers of Excellence since.

The plan was relatively simple: the group would identify and contract with a few select surgeons and hospitals throughout the country that could provide the highest quality of care at the lowest price for a few select, voluntary medical procedures.

By collaborating with other large healthcare purchasers and collectively funneling to those centers of excellence as many as possible of their employees who were seeking those select procedures, these employers realized they could create a situation that is mutually beneficial for all parties involved.

The doctors and hospitals obtain a pipeline of business that allows greater specialization and potential cost savings on the supply side of the healthcare equation, meanwhile, patients receive top-notch, specialized care at a bulk discount rate.

Employers, in turn, get lower and more consistent front-end costs on the procedure sticker price, as well as additional cost reduction on the back end from more consistent patient outcomes and fewer negative patient outcomes due to care provided by less specialized or skilled medical practitioners. 

When the ECEN first launched in 2014, the group of select procedures was limited to just knee and hip replacement surgeries, but the group has since expanded to include a number of other conditions that can benefit from the model, including spinal procedures, cancer treatments, and organ transplants, for example. 

How Do Centers for Excellence Reduce Costs?

The main benefit that Centers of Excellence provide to employers may be consistency, which is advantageous for employers on a few different fronts: 

  • Consistency of Care: Employers can ensure that employees are getting quality care from specialists who have mastered the very procedure/treatment that the employee is seeking, which reduces the risk of negative patient outcomes, lowers long-term costs, and minimizes productivity loss due to medical error and/or reinjury/remission. 
  • Consistency of Improvement: Not only are highly qualified and specialized hospitals and medical practitioners selected to be Centers of Excellence in the first place, but those care providers improve on their ability to deliver the ultra-specialized procedure/treatment through consistent repetition, which leads to consistent improvement in both diagnostics and care recommendations as patient outcome evidence refines the medial approach, as well as consistent improvement in process and efficiency of care delivery, like better care coordination and discharge procedures designed to minimize the chance of readmission, all of which works to reduce cost in a feedback loop.
  • Consistency of Cost: By sending employees from all over the country to one of a few select Center of Excellence locations for a given specialized treatment or procedure, employers can predict with much greater accuracy the range of costs that will be incurred in each instance. Employers with no Center of Excellence programs in place will have employees seeking the same procedure at thousands of different hospitals and medical practices that have varying degrees of experience with the relevant procedures and treatments as well as varying cost structures for providing them and varying rates of success, which can make forecasting costs significantly more tricky. In effect, reducing the risk and uncertainty of costs actually works to reduce those very costs.

One study from Rand Corporation indicated that the Centers of Excellence they evaluated had reduced total costs for employers associated with the relevant procedures by more than 10% (cost savings per procedure averaged more than $16 thousand).

Patients saw even greater cost savings at almost 30% through reduced or removed copayments, which is an incentive many employers offer to encourage Centers of Excellence utilization.

Both patients and employers benefited from a readmission rate that was about 75% lower than the national average, as well.

Centers of Excellence: Flexibility vs. Rigidity

Even though the patient outcomes and reduced costs have served as effective positive incentive tools on their own to encourage employees to seek out Centers of Excellence for covered services, a significant proportion of employers see enough upside in Centers for Excellence programs that they supplement those incentives with additional sticks and/or carrots.

With regard to negative feedback and sticks, nearly 1 in 5 large employers that utilize Centers of Excellence programs require its employees to use those Centers for certain procedures without providing an alternative employer-sponsored option.

The larger the employer, the more likely the employer is to mandate Center of Excellence use, with only 14% of employers with between 200 and 999 employees requiring Center of Excellence utilization for prescribed conditions, while 27% of employers with between 1,000 and 4,999 employees and 31% of employers with 5,000 or more employees did so. 

As for additional positive feedback and carrots to incentivize employees to take advantage of these programs beyond reduced costs, positive patient outcomes, and low readmission rates, a large number of employers also cover travel expenses that employees incur when visiting Centers of Excellence.

In 2024, 24% of employers with between 200 and 999 employees covered travel expenses for employees to seek care at Centers of Excellence, 25% of employers with between 1,000 and 4,999 covered these employee travel expenses, and 46% of employers with 5,000 or more employees covered them.

Mployer’s Take

It is entirely possible that the dip in Center of Excellence utilization among the largest employers in the US last year was anomalous and not indicative of these programs falling out of favor at the top of America’s most influential private organizations. 

It’s also possible that covering travel expenses became increasingly expensive for employers as covered procedures evolved from relatively fast procedures with relatively short on-site recovery times, like hip and knee replacements, to more invasive procedures with longer recovery times, like organ transplants, and treatments that themselves are more complex and long-term, like certain cancer treatment regimens. 

Whatever the case may be, it must be somewhat troubling for Centers of Excellence advocates to see the most pronounced reduction in utilization among the largest employers, however, given that Center of Excellence programs seem most aptly suited to the biggest organizations who can negotiate low fees, provide steady streams of patients from many corners of the country, and take advantage of these potential cost savings. 

That said, because Centers for Excellence are such a relatively recent addition to the employer cost-saving repertoire, there is still a process of trial and error that is happening which may result in some fluctuation in participation percentages but will hopefully ultimately lead to greater efficiencies and a more streamlined menu of services that best work in Centers of Excellence models.

In the meantime, as those issues and efficiencies get sorted out, Centers of Excellence are likely to remain a prominent component of health benefits service delivery for the foreseeable future, and we’ll keep an eye on these utilization trend lines as they continue to take shape and organizations figure out how to best optimize these programs.