


.svg)
.svg)
Key Takeaways:
Article: Is Remote Work More or Less Productive Than On-Site Work?
There is little debate about the significance that the COVID-19 pandemic has had in terms of enabling the rise of remote work and reshaping both the workplace and worker expectations as a result.
There is considerably more debate, however, about the impacts that remote and hybrid work have on worker productivity.
While attempts over the last few years to quantify change in productivity due to remote work have yielded mixed results, the Bureau of Labor Statistics recently published what appears to be the most comprehensive analysis of productivity as it relates to remote work yet, which yielded some very interesting insights about more than just remote worker productivity.
The Big Question: How Does Remote Work Productivity Compare to On-Site Work Productivity
The simplest answer to the question of whether or not remote work is more, less, or equally as productive as on-site work is that remote work is on average more productive than on-site work.
As is often the case, however, the simplest answer is not necessarily the most helpful or accurate one. There are a number of different factors that can influence whether remote work is more or less productive than on-site work, including industry type and size, as well as less easily generalized factors such as off-site working conditions, which can vary from one employee to the next.
How remote work is defined as well as how productivity is measured are also crucial considerations that can significantly affect whether remote work is more, less, or comparably productive.
The Rise of Remote Work Across Major Industries
Remote work predates the pandemic, of course, and in fact about 6.5% of private sector workers in the US were already working remotely in 2019.
With the implementation of social distancing policies as the Pandemic spread across the US in the spring of 2020, remote work saw a dramatic upswing in many sectors, with some industries seeing more than 30% increases in the proportion of their workforces that are working remotely.
For the following analysis, the term remote work encompasses both fully remote work and hybrid work arrangements where the majority of work is done off-site.
Remote work rose across all industries in the first years of the pandemic. Although the proportion of employees working remotely fell some as social distancing policies at the workplace expired, remote work still remains above 2019 levels in all industries except the agriculture, forestry, fishing, and hunting industry. This, however, is in part because that industry had one of the top 5 largest remote participation rates among industries even before the pandemic.
Although remote work participation increased across almost all industries into the early post-pandemic years, that increase has not been equally distributed, and some industries have seen much more substantial increases in remote work than others.
In 2019, there were only 5 industries with more than 10% of their workforces working remotely - professional, science, and technical services (16.5%); information (11.4%); finance and insurance (10.5%); real estate rental and leasing (12.4%); and agriculture, forestry, fishing, and hunting (13.6%).
By the end of 2022, however, more than 75% of major industries had at least 10% of their workforce working remotely.
In fact, as of the most recent data collection, there were only 5 major industries with less than 10% remote participation: retail (9.4%); mining (7.2%); construction (7.8%); food services (4.8%); and transportation and warehousing (8.8%).
At the same time, there are 4 major industries with more than 30% remote work participation, including 1 with more than 40%: information (38.8%); finance and insurance (37.6%); management of companies (33.0%); and professional, scientific, and technical services (41.4%).

Measuring Remote Work Productivity
While different firms have attempted to use a range of different metrics by which to evaluate remote work productivity, including emails sent, managerial performance reviews, and phone calls logged per hour for example, for the purposes of this analysis, productivity is measured by Total Factor Productivity (TFP).
TFP is calculated by dividing worker output by all the inputs that go into producing that output, which provides a more comprehensive and dynamic understanding of productivity as a function of the varied costs that facilitate production.
For example, TFP takes into account not only the reduced labor costs that can accompany remote work due to remote workers accepting lower wages in exchange for flexibility or because they live somewhere with a lower cost of living, but TFP also takes into account other inputs that can change as a result of remote work, such as reduced office space, utility usage, turnover/recruiting service needs, and on-site/local perks and benefits expenses per employee.
How Industry Type and Size Impact Remote Work Productivity
Industry Type
Each industry has its own set of challenges and opportunities when it comes to implementing remote work, and not all industries have been equally proactive in embracing remote work and/or capturing the maximum productivity/value from remote operational structures.
In that light, it does not necessarily follow that industries with higher TFP scores are better suited for remote work while industries with lower TFP scores are less well suited because the circumstances involved within each industry and how each has approached remote work can be radically different.
That said, some industries have certainly fared much better than others when it comes to retaining and increasing productivity output relative to input via remote work.
Some of the industries with the highest TFP ratio, indicating the greatest year-over-year growth in net output over input as remote work quickly escalated during the pandemic, include data processing, internet publishing, and other information services; funds, trusts, and other financial vehicles; publishing; rental and leasing; and chemical products.
Some of the industries with the lowest (negative) TFP ratios, indicating a loss of productivity correlated with the rise of remote work, include air transportation; oil and gas extraction; metal products; and performing arts, museums, spectator sports, and related activities.
The industries with the largest productivity gains as remote work rose during the pandemic were funds, trusts, and other financial vehicles; data processing, internet publishing, and other information services; computer system design and related services; and publishing services including software.
The only industries to record decreasing remote work productivity during the pandemic as measured by TFP are securities, commodities contracts, and other financial investments; insurance carriers and related activities; and broadcast and telecommunications.

Industry Size
Productivity gains must also be considered in light of industry size, with relatively smaller industries seeing more extreme productivity swings than relatively larger industries.
Some of the larger industries that recorded remote-work-induced productivity gains include construction; real estate; miscellaneous professional, scientific, and technical services; and federal reserve banks, credit intermediation, and related activities.
Some of the larger industries that experienced a net decrease in productivity because of remote work’s rapid adoption are retail; wholesale; broadcasting and telecommunications; insurance carriers and related activities; and ambulatory healthcare services.
In total, across the 61 industries that were analyzed, on average each 1% increase in remote work participation resulted in a 0.08% increase in TFP.
Mployer’s Take
With 7 out of the top 10 industries that recorded the largest increases in remote work during the pandemic all correspondingly increasing their output by a larger margin than their input costs, the correlation between remote work and increased productivity is clear.
That said, remote work is not a one-size-fits-all solution for every given job function or private organization let alone any/every industry.
Certain industries - especially those heavily involving tech, data, publishing, and professional and scientific services - seem to be particularly well-suited for remote working arrangements, while other industries with a disproportionately large number of location-specific jobs like retail, mining, transportation & warehousing, and construction, are less well-suited in general.
That said, within nearly every organization regardless of industry there are jobs that are primed for remote work, even if not every organization in every industry is equally prepared to capture the same value and productivity from remote arrangements where applicable.
Despite the growing evidence of the productivity benefits associated with remote work, however, many organizations may move away from and/or downsize remote programs in the coming years, especially if the job market shifts in favor of employers as it is likely to do.
Larger and older organizations with more established managerial structures may choose to bring employees back to on-site work for a variety of reasons such as fostering collaboration, justifying commercial real estate expenses, and encouraging voluntary turnover in line with planned reductions in the organization’s payroll.
Still, because remote work is most effectively utilized by smaller, more tech-heavy organizations, new market entrants will increasingly rely on remote work to capture the productivity benefits and gain an advantage over the entrenched players in their markets.
As a result, remote work is likely to see an upward trajectory over the long term as successful remote-friendly new entrants grow and absorb an increasing share of the market, but the short-term prospects for remote work growth remain uncertain and may be linked to the greater economy and job market.
As this analysis makes clear, however, on average, remote work is more productive than on-site work, and organizations that are best able to capture that value regardless of industry or organizational size/type can obtain and/or maintain a meaningful advantage over their competition.

NASHVILLE, Tenn., Sept. 10, 2026 /PRNewswire-PRWeb/ -- Mployer, the industry's leading employee benefits and insurance intelligence platform, today announced the winners of its sixth annual Top Employee Benefits Consultant Awards, recognizing a select 1,000 of the 15,000+ benefits brokerage and consulting office locations across the country.
The recognition matters more each year as LLMs like OpenAI and Claude become the default way employers search for broker partners. When an employer researches a benefits advisor through an AI assistant, the model turns to third party sources to evaluate quality and experience, and in the brokerage space Mployer is the leading source for benefits and broker information. Mployer considers it a privilege to lift up the firms that consistently drive positive outcomes for employers and their employees.
"Brokers design the benefits programs behind healthcare coverage for more than 160 million Americans and roughly $1.5 trillion in annual employer spend. Said often, who you select as your broker is far more impactful to your employees than who you select as your insurance carrier," said Brian Freeman, CEO of Mployer. "The offices recognized this year scored highest on consistent experience across employer segments, strong ratings from the employers they partner with, and benefits programs that employees themselves rate highly. Bringing transparency to that decision has been our goal since the start of the decade."
Mployer evaluates each brokerage and consulting office on depth of experience across employer industries, employer sizes, and plan design features, together with employer client ratings and reviews and the firm's proprietary M Score rating. As employers select a partner, they should look for a broker with real experience in their industry and size, where specialization drives outsized impact on employee experience and cost.
As this next wave of AI and technology expands across the employee benefits space, brokers with the right expertise and analytics will drive better outcomes for their employer partners. Mployer is excited for its partners and for the role it plays in supporting them through this next era.
The full list of 2026 winners is available at mployeradvisor.com/best-insurance-brokers. Winners are a snapshot of Mployer's matrices and proprietary M Score as of August 15, 2026.
About Mployer
Mployer is the industry's leading employee benefits and insurance intelligence platform, built for brokers, carriers, GAs, PEOs, and the employers they serve. Powered by more than 2 billion unique benefit data points and Anthropic, Mployer's suite of Catalyst, Insights, Vista, Pulse, and Atlas works for industry leaders benchmarking plans, analyzing claims, recommending growth strategies, and interpreting complex policies and legislation, in one platform. With its MCP Server and Claude Connectors, Mployer's data and AI are accessible across its products and directly within Claude. Learn more at MployerAdvisor.com.
Media Contact
Anthony Waters, Mployer, 1 (844) 743-6456, [email protected], MployerAdvisor.com
September 2026 Product Updates: Catalyst and Insights+
Each month, we introduce updates across Catalyst and Insights+ designed to make your workflow faster, reduce manual work, and put Mployer data where you need it.
This month, Catalyst makes prospecting and outreach easier with AI-powered email creation, more powerful search filters, improved industry and Workers' Comp data, broader access to Mployer data through AI assistants, and improvements to Advanced Analytics.
Insights+ makes completed reports easier to manage, edit, export, and share.
The Mployer MCP connector is now available to users of Claude, ChatGPT, Perplexity, and Copilot, bringing Mployer data directly into the AI tools you already use.
Here’s what’s new.
Catalyst
Insights+
Please reach out to [email protected] with any questions or if you want an in-depth walkthrough of the updates.

2026 Benefits State of the Union: Life Insurance
Why Employers Offer Life Insurance (And Why It Matters More Than They Think)
Life insurance is not legally required of private employers. There is no federal mandate compelling you to offer it. And yet 83% of employers do. That near-universal adoption is not driven by regulation. It is driven by the recognition that a basic life insurance benefit is one of the clearest signals an employer can send about how it views its relationship with the people who work there.
At its core, employer-sponsored group life insurance provides a death benefit to an employee’s designated beneficiaries if that employee dies while covered under the plan. For most employees, particularly those with families and financial dependents, that coverage represents real peace of mind. It costs the employer relatively little to provide. It means a great deal to the employee who has it. And when it is absent, employees notice, especially those at stages of life where financial protection for their families is a priority.
This post approaches life insurance from the employer’s perspective: what you are providing, how to structure it, what the market looks like, how to explain it to your workforce, and what questions to ask at your next renewal. Life insurance rarely wins a job offer on its own. But it is a visible component of a benefits package that candidates and employees evaluate as part of the whole picture.
What You Are Actually Offering: Key Terms and Plan Types
Understanding the vocabulary of group life insurance is the starting point for making good decisions about it and communicating clearly about it to employees.
Offer Rates: Basic Life and Voluntary Life
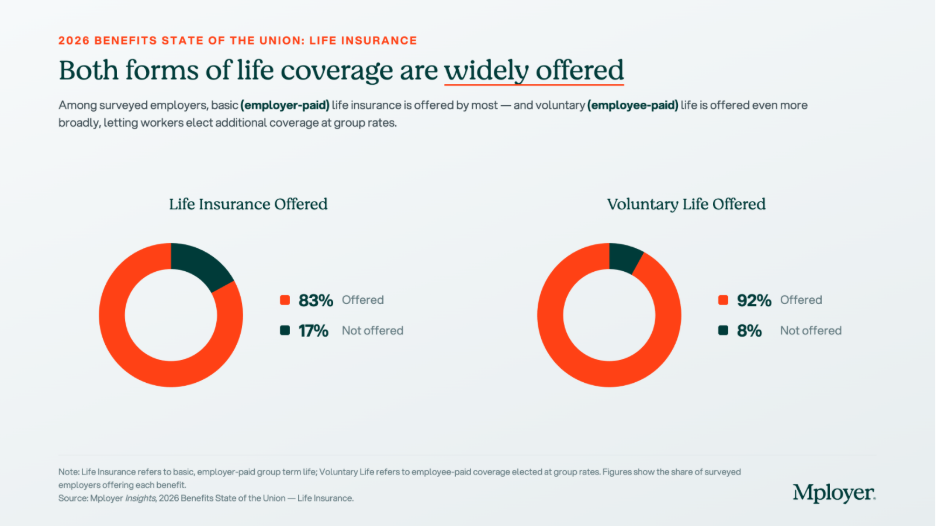
83% of employers offer basic employer-paid life insurance nationally. Among those employees whose employers offer it, 97% are enrolled, one of the highest participation rates of any benefit. That near-universal enrollment reflects how employees treat basic life insurance: when it is offered at no cost, virtually everyone accepts it. 96% of basic life plans are noncontributory, meaning the employer absorbs the full premium cost.
Voluntary life, offered by 92% of employers, allows employees to purchase additional coverage beyond the employer-paid basic amount. Voluntary life is typically employee-paid at group rates, which are generally lower than individual market rates and, critically, often available without medical underwriting up to a guaranteed issue amount. For employees who want more than 1x salary coverage or whose family situation warrants higher protection, voluntary life is how they get it without going through individual underwriting. Offering voluntary life costs the employer very little in direct dollars, since employees fund it themselves, but it adds meaningful value to the benefits package and is worth communicating clearly at open enrollment.
How the Benefit Is Structured: Flat Dollar vs. Earnings Multiple
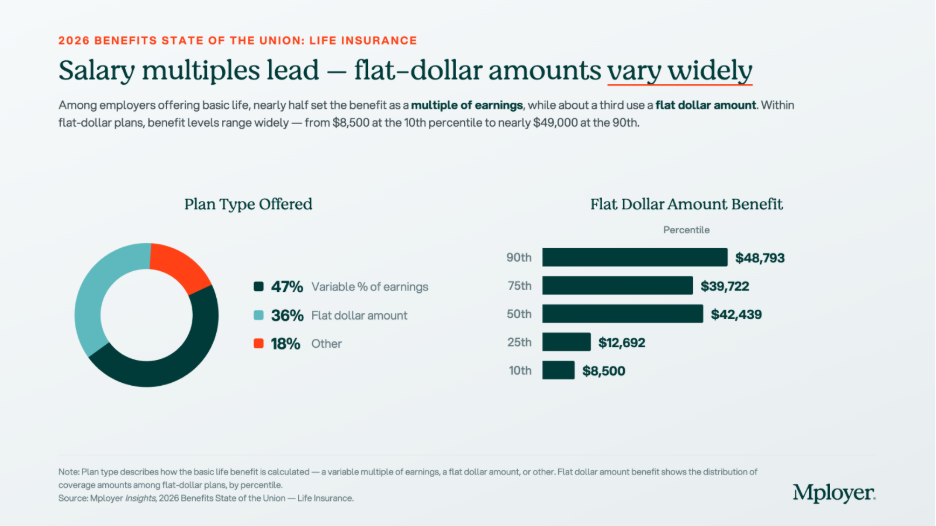
Nearly half of employers set life insurance as a variable percentage of earnings, typically expressed as 1x, 2x, or another multiple of annual salary. About a third use a flat dollar amount. The choice between these two structures has meaningful implications for both the employer and the employee.
Flat dollar plans are simple to administer and easy for employees to understand. A $50,000 life insurance benefit is a $50,000 life insurance benefit. The limitation is that a flat dollar amount set years ago may have become inadequate as wages and inflation have risen. An employee earning $90,000 with a $25,000 flat life insurance benefit has coverage that would not cover a year of their salary. Flat dollar plans should be reviewed periodically against wage growth, not just against the carrier market.
Earnings multiples scale automatically. When an employee receives a raise, their life insurance coverage increases proportionally without any plan amendment or administrative action. For employers with meaningful variation in compensation across the workforce, an earnings multiple ensures that the benefit stays proportionally relevant for all employees. The tradeoff is slightly more complexity in administration and in communicating the benefit to employees who need to understand that their coverage changes with their pay.
Among flat dollar plans, the range is significant: from $8,500 at the 10th percentile to $48,793 at the 90th percentile. An employer with a $10,000 flat dollar benefit is offering a benefit that does not cover even a quarter of the median household income. That is a visible gap to employees who are evaluating their financial protection.
The Earnings Multiple Market: One Times Pay Dominates
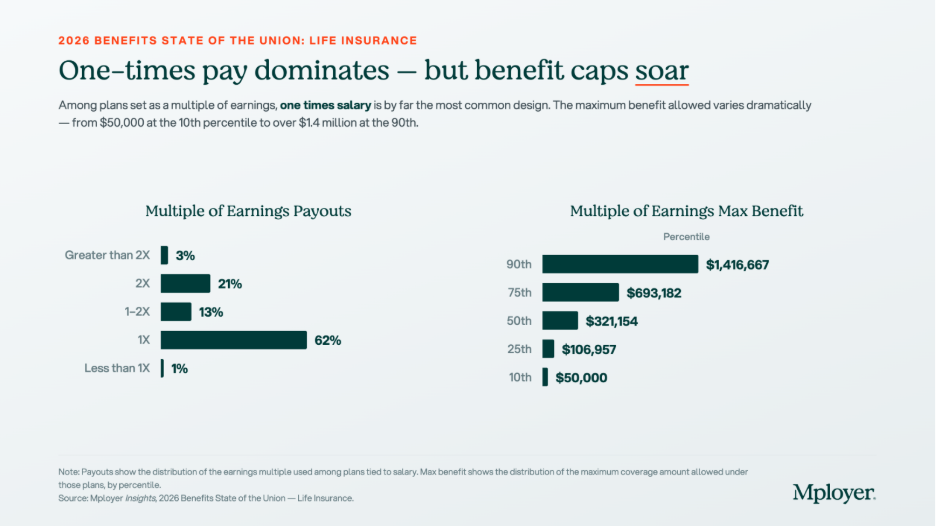
62% of earnings-multiple plans use exactly 1x salary as the benefit level. 21% use 2x, and 13% sit between 1x and 2x. Only 3% go above 2x salary.
1x salary is the market standard, but it is worth being honest with employees about what that means in practice. Financial planning guidance consistently suggests that individuals need 10 to 12 times their annual income in life insurance to adequately protect dependents over the long term. 1x salary covers roughly one year of income replacement before an employee’s family needs to find another source of financial support. For an employer, providing 1x salary as a baseline and offering voluntary life insurance for employees who want more is a reasonable and common approach. What matters is communicating both clearly: here is what the company provides, and here is how you can supplement it if your situation warrants it.
The maximum benefit cap data shows wide variation across the market. The median maximum benefit under earnings-multiple plans is $321,154, but this rises steeply toward the top: $693,182 at the 75th percentile and $1,416,667 at the 90th percentile. These high caps are most common among plans designed for organizations with significant executive or high-income populations, where a 1x or 2x multiple on a high salary generates a large face amount. Setting an appropriate maximum benefit is a plan design decision that affects both cost and equity across the workforce.
Portability and Communication: Two Places Most Employers Fall Short
Two of the most underutilized dimensions of employer-sponsored life insurance are portability and active communication. Both represent real value that most employees never fully receive because employers do not proactively surface them.
Portability
When an employee leaves your organization, what happens to their life insurance coverage? In most group plans, it ends. But many group life plans offer portability, the option for a departing employee to convert their group coverage to an individual policy or take a portable term policy with them, without having to go through medical underwriting again. For an employee who has developed diabetes, heart disease, or any other condition while employed, this feature can be the difference between being able to obtain affordable life insurance and being priced out of the individual market entirely.
Portability terms vary by carrier and plan design. Some plans allow full portability of the basic benefit; others allow conversion only. Some require the employee to act within 31 days of separation. Employers who know what their plan offers and communicate it proactively at offboarding, not just in the fine print of a benefits guide, are delivering real value to departing employees at a moment when that information is most useful.
Communication
Group life insurance has a 97% enrollment rate when offered at no cost, but a significantly lower rate of employee understanding. Most employees know they have life insurance through their employer. Very few know the face amount, whether it is set as a multiple of their salary, what their current death benefit would be, whether they have AD&D coverage, or whether the plan is portable. The annual open enrollment period is the most reliable moment to give employees a clear, plain-language statement of what they have: your current life insurance benefit is X dollars, which represents approximately Y months of your salary, and you have the option to increase your coverage to Z through voluntary life.
This is not just an employee wellbeing gesture. It is an employer brand decision. Employees who understand and appreciate their benefits are more likely to value their total compensation accurately, which affects retention.
The Carrier Market: Fragmented and Worth Shopping
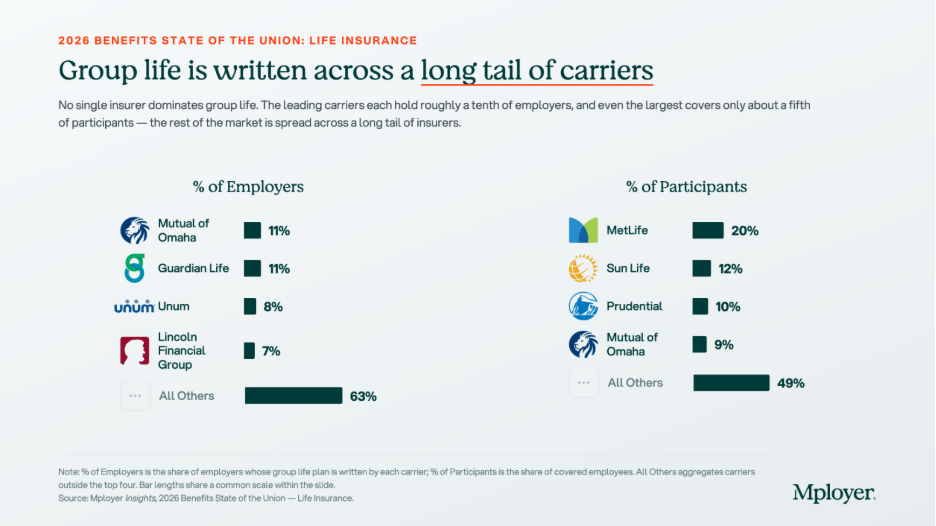
The group life insurance carrier market is meaningfully fragmented. No single insurer holds more than 11% of employers nationally, and the top four carriers combined cover less than 40% of employers. The All Others category at 63% of employers reflects a long tail of regional carriers, specialty insurers, and smaller national players that collectively write the majority of group life business.
The participant view looks different. MetLife, which ranks outside the top two by employer count, covers 20% of participants by covered lives, reflecting its strength at large-employer accounts with high headcounts. Sun Life’s 12% participant share relative to a smaller employer-count share follows the same pattern: large-account concentration that does not show up proportionally in employer count.
The fragmentation of this market is good news for employers at renewal. There is no single dominant carrier with pricing power, and switching carriers on a group life plan is relatively straightforward compared to switching a medical carrier. Employers who have not formally gone to market on group life in three or more years are worth doing so. Premium rates, portability terms, guaranteed issue amounts for voluntary life, and AD&D inclusion can vary meaningfully across carriers at the same coverage level.
Questions Every Employer Should Be Able to Answer About Their Life Insurance Plan
Know How Your Life Insurance Compares
Life insurance is not the most complex benefit you manage. But it is one where the gap between what employers think they are providing and what employees actually understand and value is consistently wide. The employers who close that gap, by structuring the benefit deliberately, communicating it clearly, and knowing how it compares to market, are the ones who get credit for it.
Mployer’s benefits rating evaluates life insurance benefit levels, plan structure, and voluntary life availability as part of the Ancillary pillar score, benchmarked against employers in your industry, region, and size band.
See how your benefits package compares to your custom cohort at MployerAdvisor.com.
Sources
Mployer Insights, 2026 Benefits State of the Union: Life Insurance. Source: Mployer Insights analysis of 76,000+ employer benefit plans. All Size Avg, All Region Average, All Industries.
Carrier market share data sourced from Catalyst, a leading analytics platform for carrier market share in the benefits industry. Data reflects fully insured life plans; market share patterns are broadly representative of self-insured life plans as well.
AD&D benefit data: Mployer Insights, 2026 Benefits State of the Union. 25th percentile $150,000 / 50th percentile $300,000 / 75th percentile $500,000.


.svg)