Product Updates
Product Updates, August 2026
Welcome to our latest release. We are excited for you to try the new features.
Author:
August 3, 2026

August Release Notes: Catalyst and Insights

Welcome to our latest release. We are excited for you to try the new features. This release focused on four things: making Mployer AI available throughout every product, rebuilding each product's home page to put the AI assistant front and center, adding new filters in Catalyst to help you find more opportunities, and opening free tiers on all products. Below is a summary of the major changes.

Mployer AI throughout Catalyst

The Mployer AI panel is now available on every Catalyst search grid: Employer, Commercial P&C, Broker, Carrier, Company, PEO, and Retirement. You can ask questions about your results without leaving the search.

The home page search bar has been replaced with the same AI chat. You can ask about companies, OSHA data, or benefits in plain language from the top of the page, and your chat history is retained on your device.

All AI surfaces in Catalyst, including the in-app chatbot and home page search, now run on an updated MCP backend, making every assistant significantly smarter.

Commercial Search

Experience Mod, carrier relationship, modeled payroll, and premium are now available as filters and columns in Commercial Search. OSHA and DOT records show violation gravity, the number of employees exposed, and 12-month trend direction across violations, crashes, and drivers. P&C brokers can now build prospect lists around financial exposure and compliance risk directly in the grid.

PEO Search

PEO Search, Snapshot, and Company Snapshot now show a single view of an employer's most recent PEO affiliation, with full switching history available from the same place. Previously, multiple affiliations could appear as separate records. Filters, columns, and exports now include Filing Source, PEO status, Benefits and Overall Rating, Most Recent Filing, EIN, and NAICS, bringing PEO Search in line with Employer Search.

Export and contact visibility

The export modal now shows your remaining credit balance and the actual record count and cost after exclusions, before you confirm. The "Exclude Previously Exported" option now covers the past 12 months rather than your full export history.

Contact records display an email verification status at all times, and you can filter contacts by that status when prioritizing outreach.

Mployer AI on the Insights home page

You can now ask questions about your book of business directly from the Insights home page. An AI assistant sits alongside your submissions and works against your client data, so you can ask which clients scored below benchmark, which reports are complete, which clients qualify for an award, or "show me completed reports where voluntary STD is offered," and get the answer without building filters by hand.

You can filter submissions by benchmark score, lifecycle state, and award eligibility, run reports from the same view, and export any filtered result to CSV.

Free tiers on all products

Every product now includes a free tier. We encourage you to try out all the resources now available to you.  

AI panel on Insights+ reports

The Mployer AI panel on Insights+ HTML reports has been redesigned to match the AI panels in the rest of the platform, with the same layout, controls, and prompt patterns. Generate recommendations and ask any questions about the report and data, and get answers instantly.  

Help Center

A new Help Center is live, with a home page, per-product detail pages, and a video tutorial library. Webinars, product updates, a glossary, and FAQs will be added within the same structure.

If you have questions about any of these changes, contact Partner Success or reach us through the Help Center.
Employee Benefits
How Benefits Correlate to Attraction and Retention
Hiring and retaining talent continues to be one of the biggest challenges facing employers today. With rising salary expectations and increasing turnover rates, organizations are under pressure to find sustainable, high-impact ways to attract and keep top talent.
June 1, 2025

How Benefits Correlate to Attraction and Retention

Why offering and communicating great benefits drives core HR performance

Hiring and retaining talent continues to be one of the biggest challenges facing employers today. With rising salary expectations and increasing turnover rates, organizations are under pressure to find sustainable, high-impact ways to attract and keep top talent.

One of the clearest and most controllable drivers of success? Employee benefits. And just as importantly, how those benefits are perceived by employees.

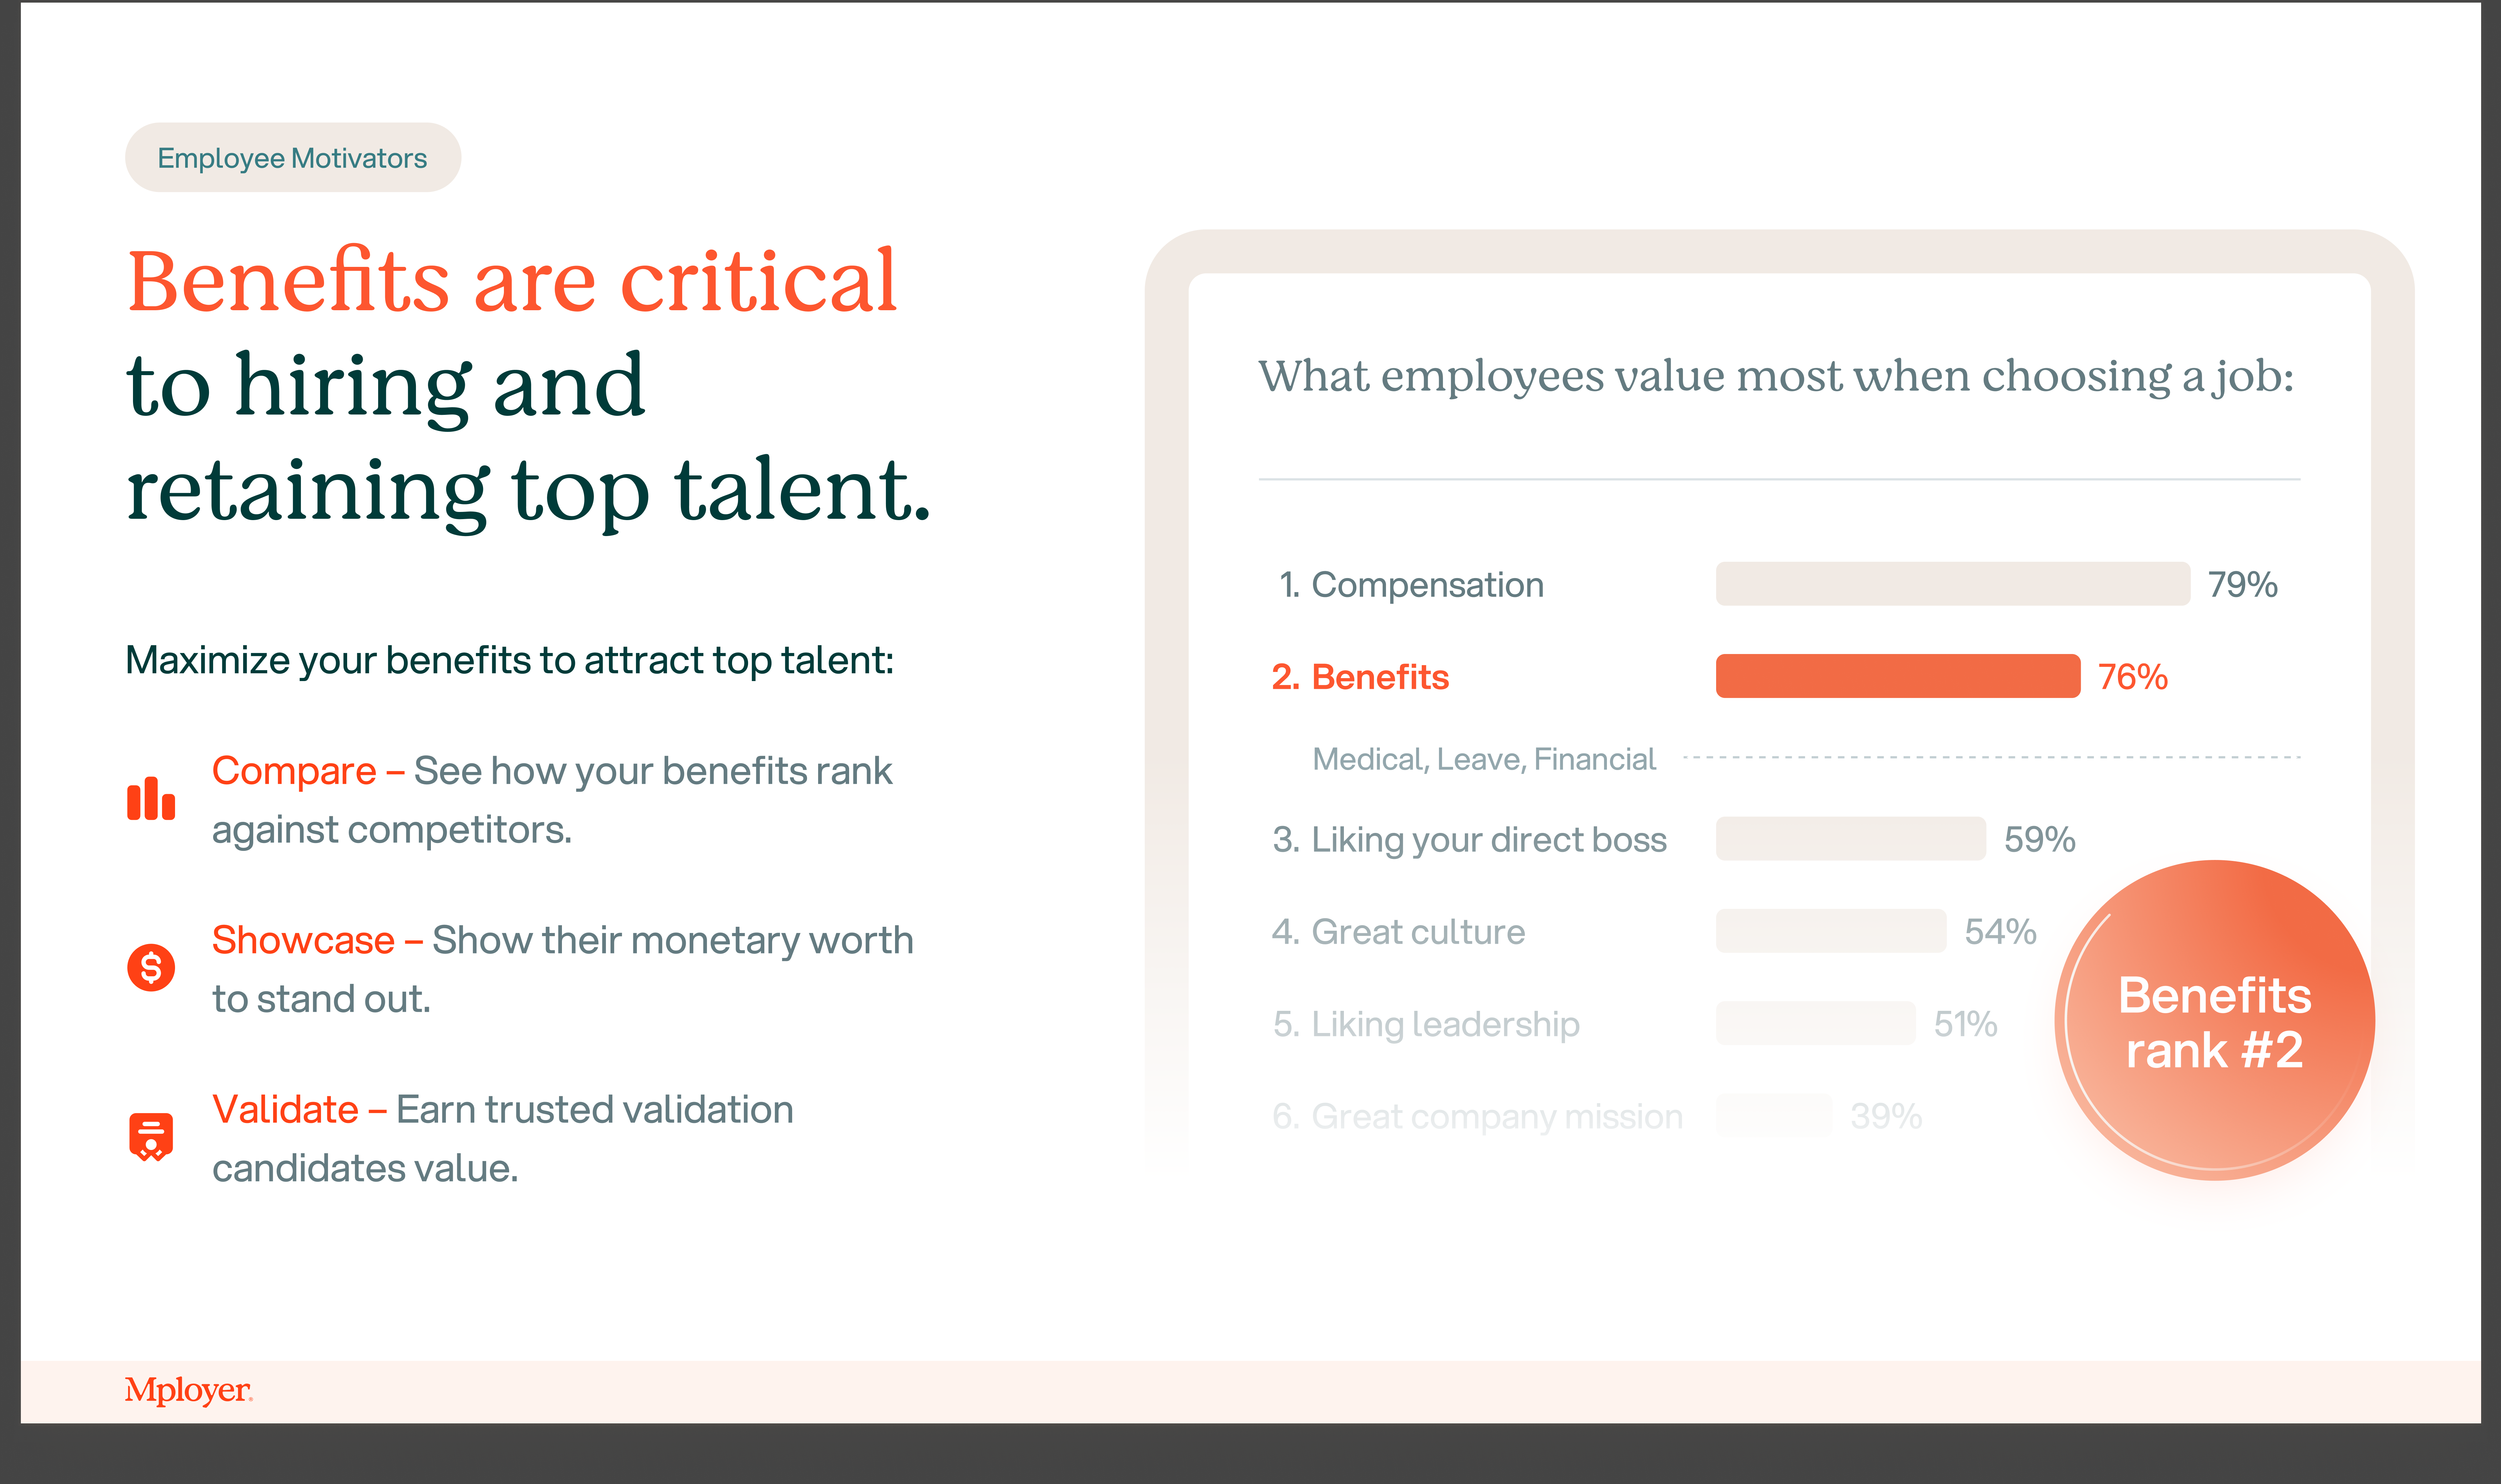
Our recent data from over 700 companies and 10,000 employees in 2024 and early 2025 confirms this: benefits are the second-most important factor influencing employee satisfaction, just behind compensation.

In fact, 76% of employees cite benefits including medical, leave, retirement, and financial programs as a top reason they choose to join or stay with a company. That’s ahead of their boss, company culture, leadership, and even mission.

In short: benefits are not secondary, they’re strategic.

Why Benefit Expectations Are Higher Than Ever

Over the past few years, benefit expectations have shifted dramatically. The pandemic changed how employees think about health, family time, flexibility, and mental well-being. Rising out-of-pocket medical costs, the growth of remote and hybrid work, and a greater awareness of employer-provided financial security have made benefits one of the most discussed aspects of compensation - not just in exit interviews, but in Glassdoor reviews, LinkedIn posts, and team chats.

Simply offering a health plan isn’t enough anymore. Today’s workforce expects benefits that are modern, inclusive, and meaningful. Employees also expect employers to communicate clearly about what’s being offered.

That’s why we analyzed how employee-perceived benefit quality correlates with performance on key HR metrics. The companies that perform best? They don’t just offer strong benefits, they ensure employees know and value them.

Great Benefits Drive Key People Metrics

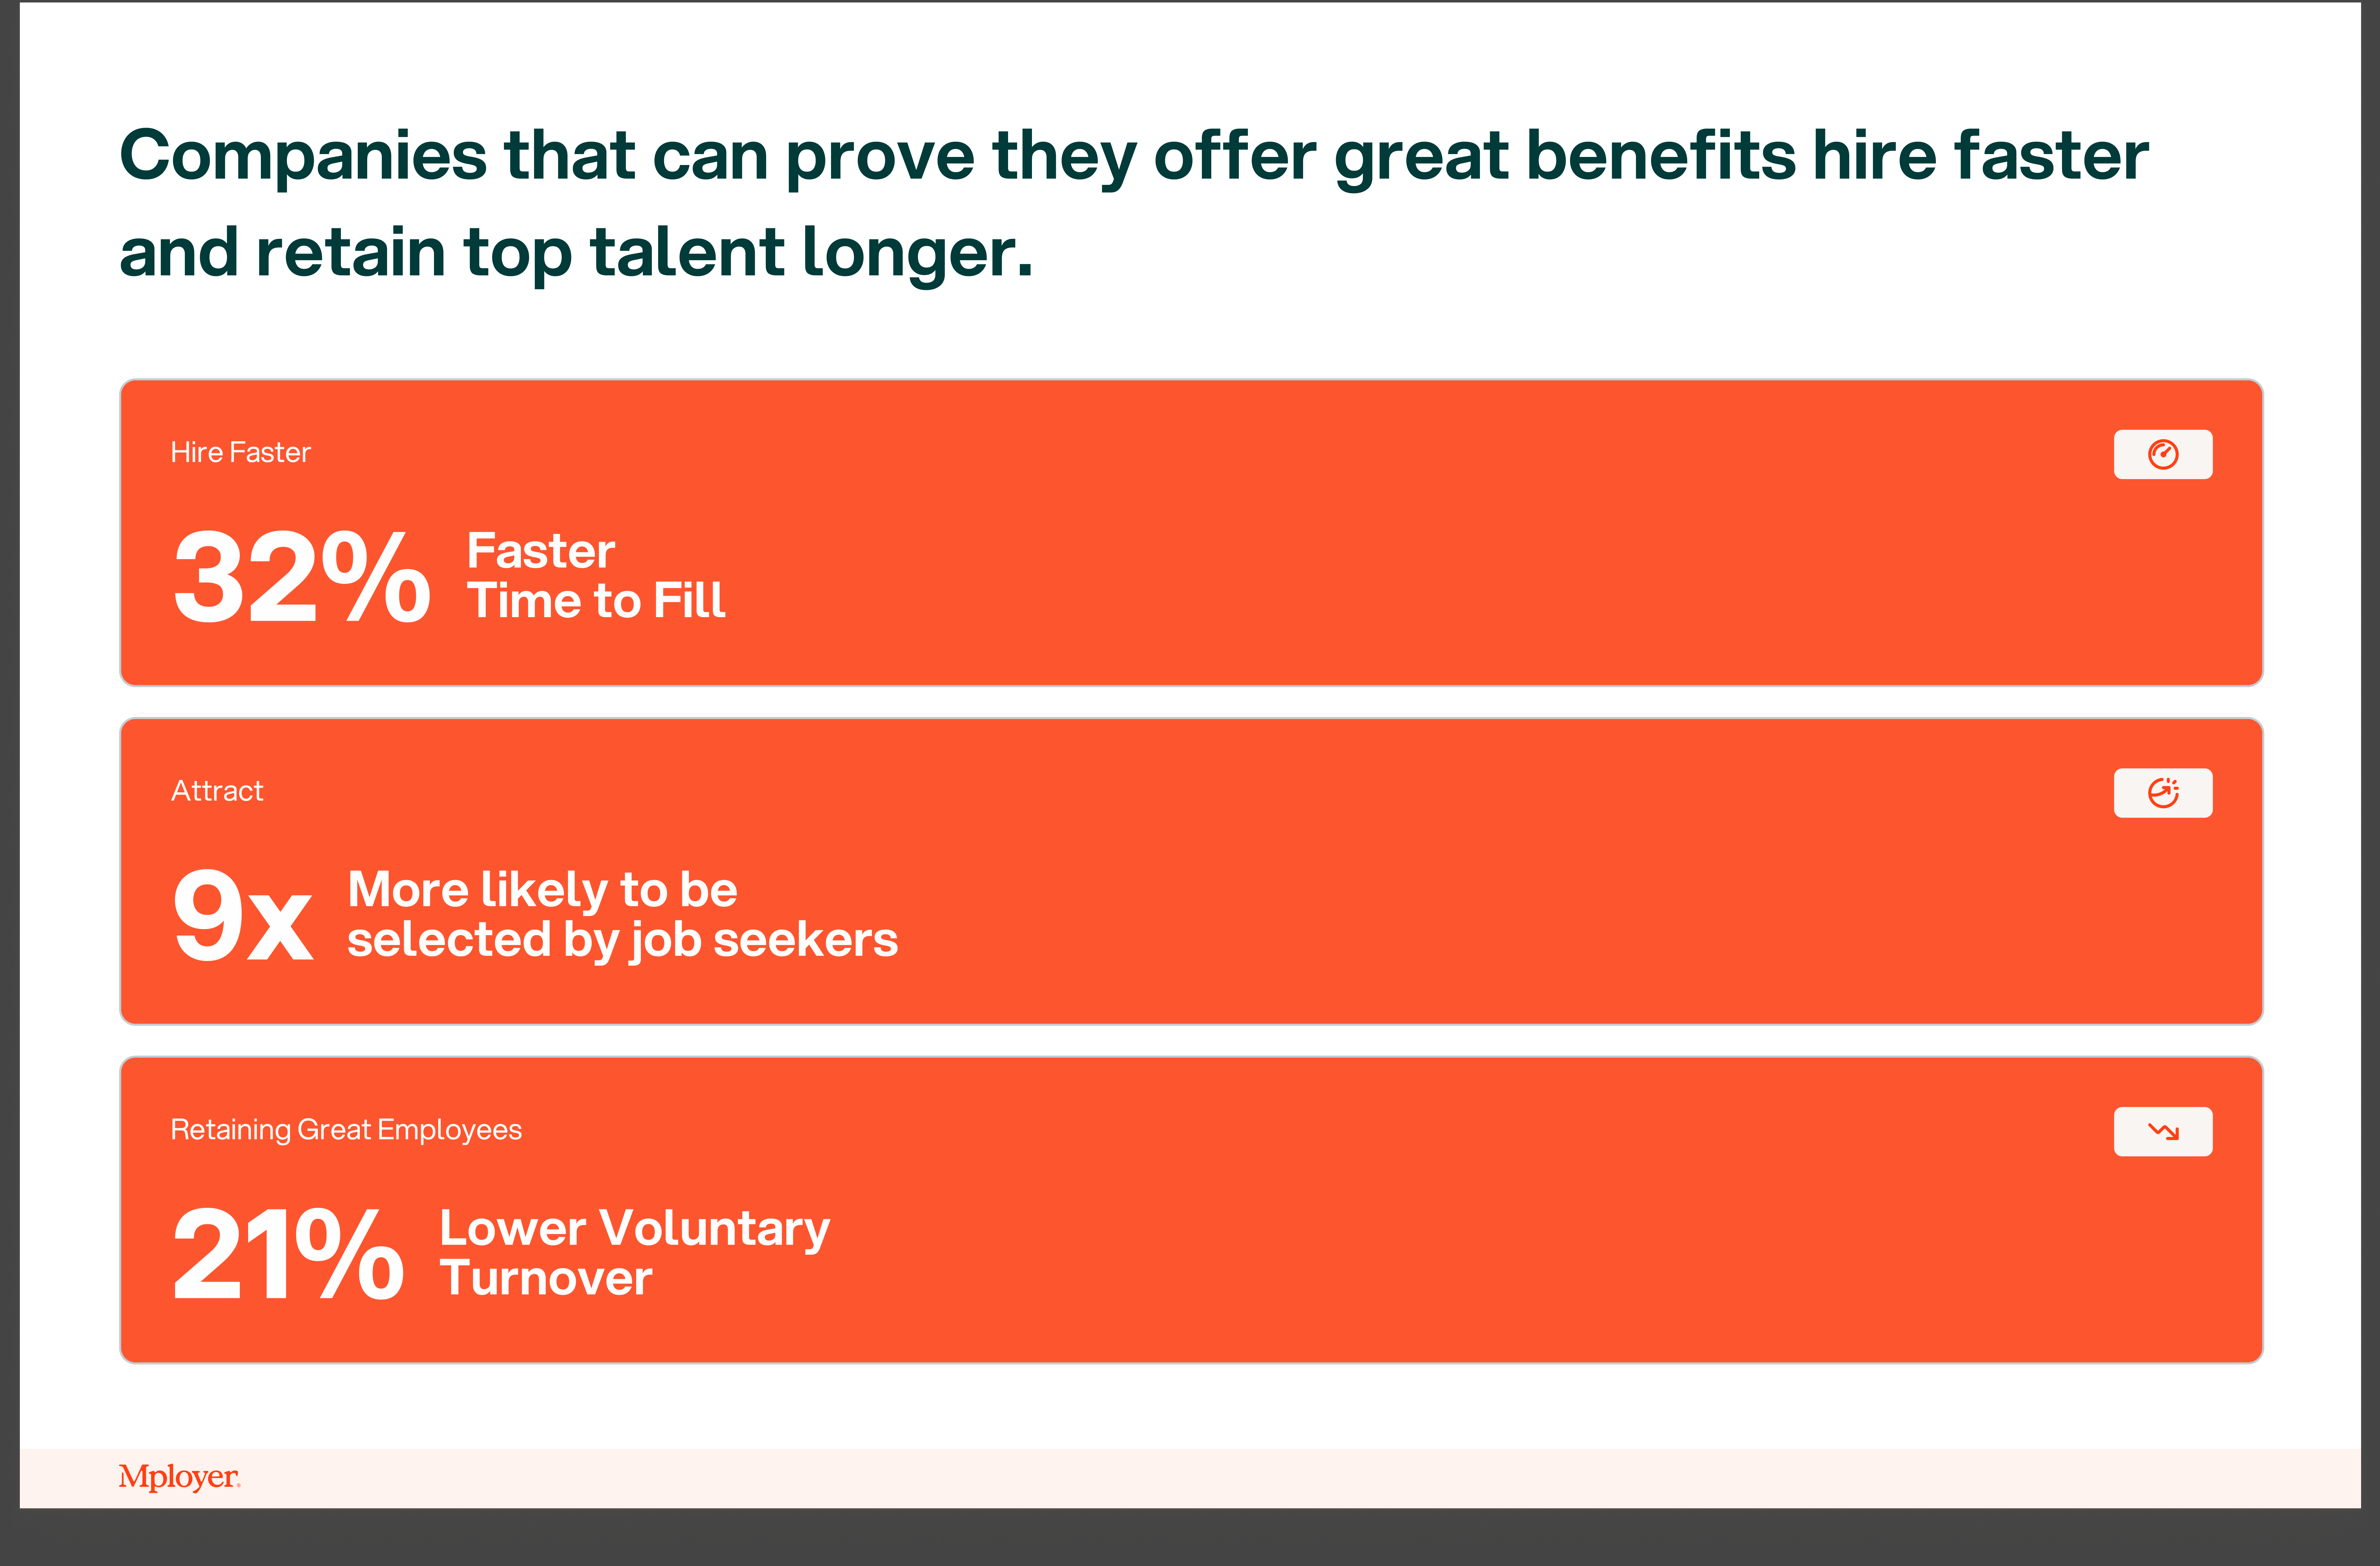
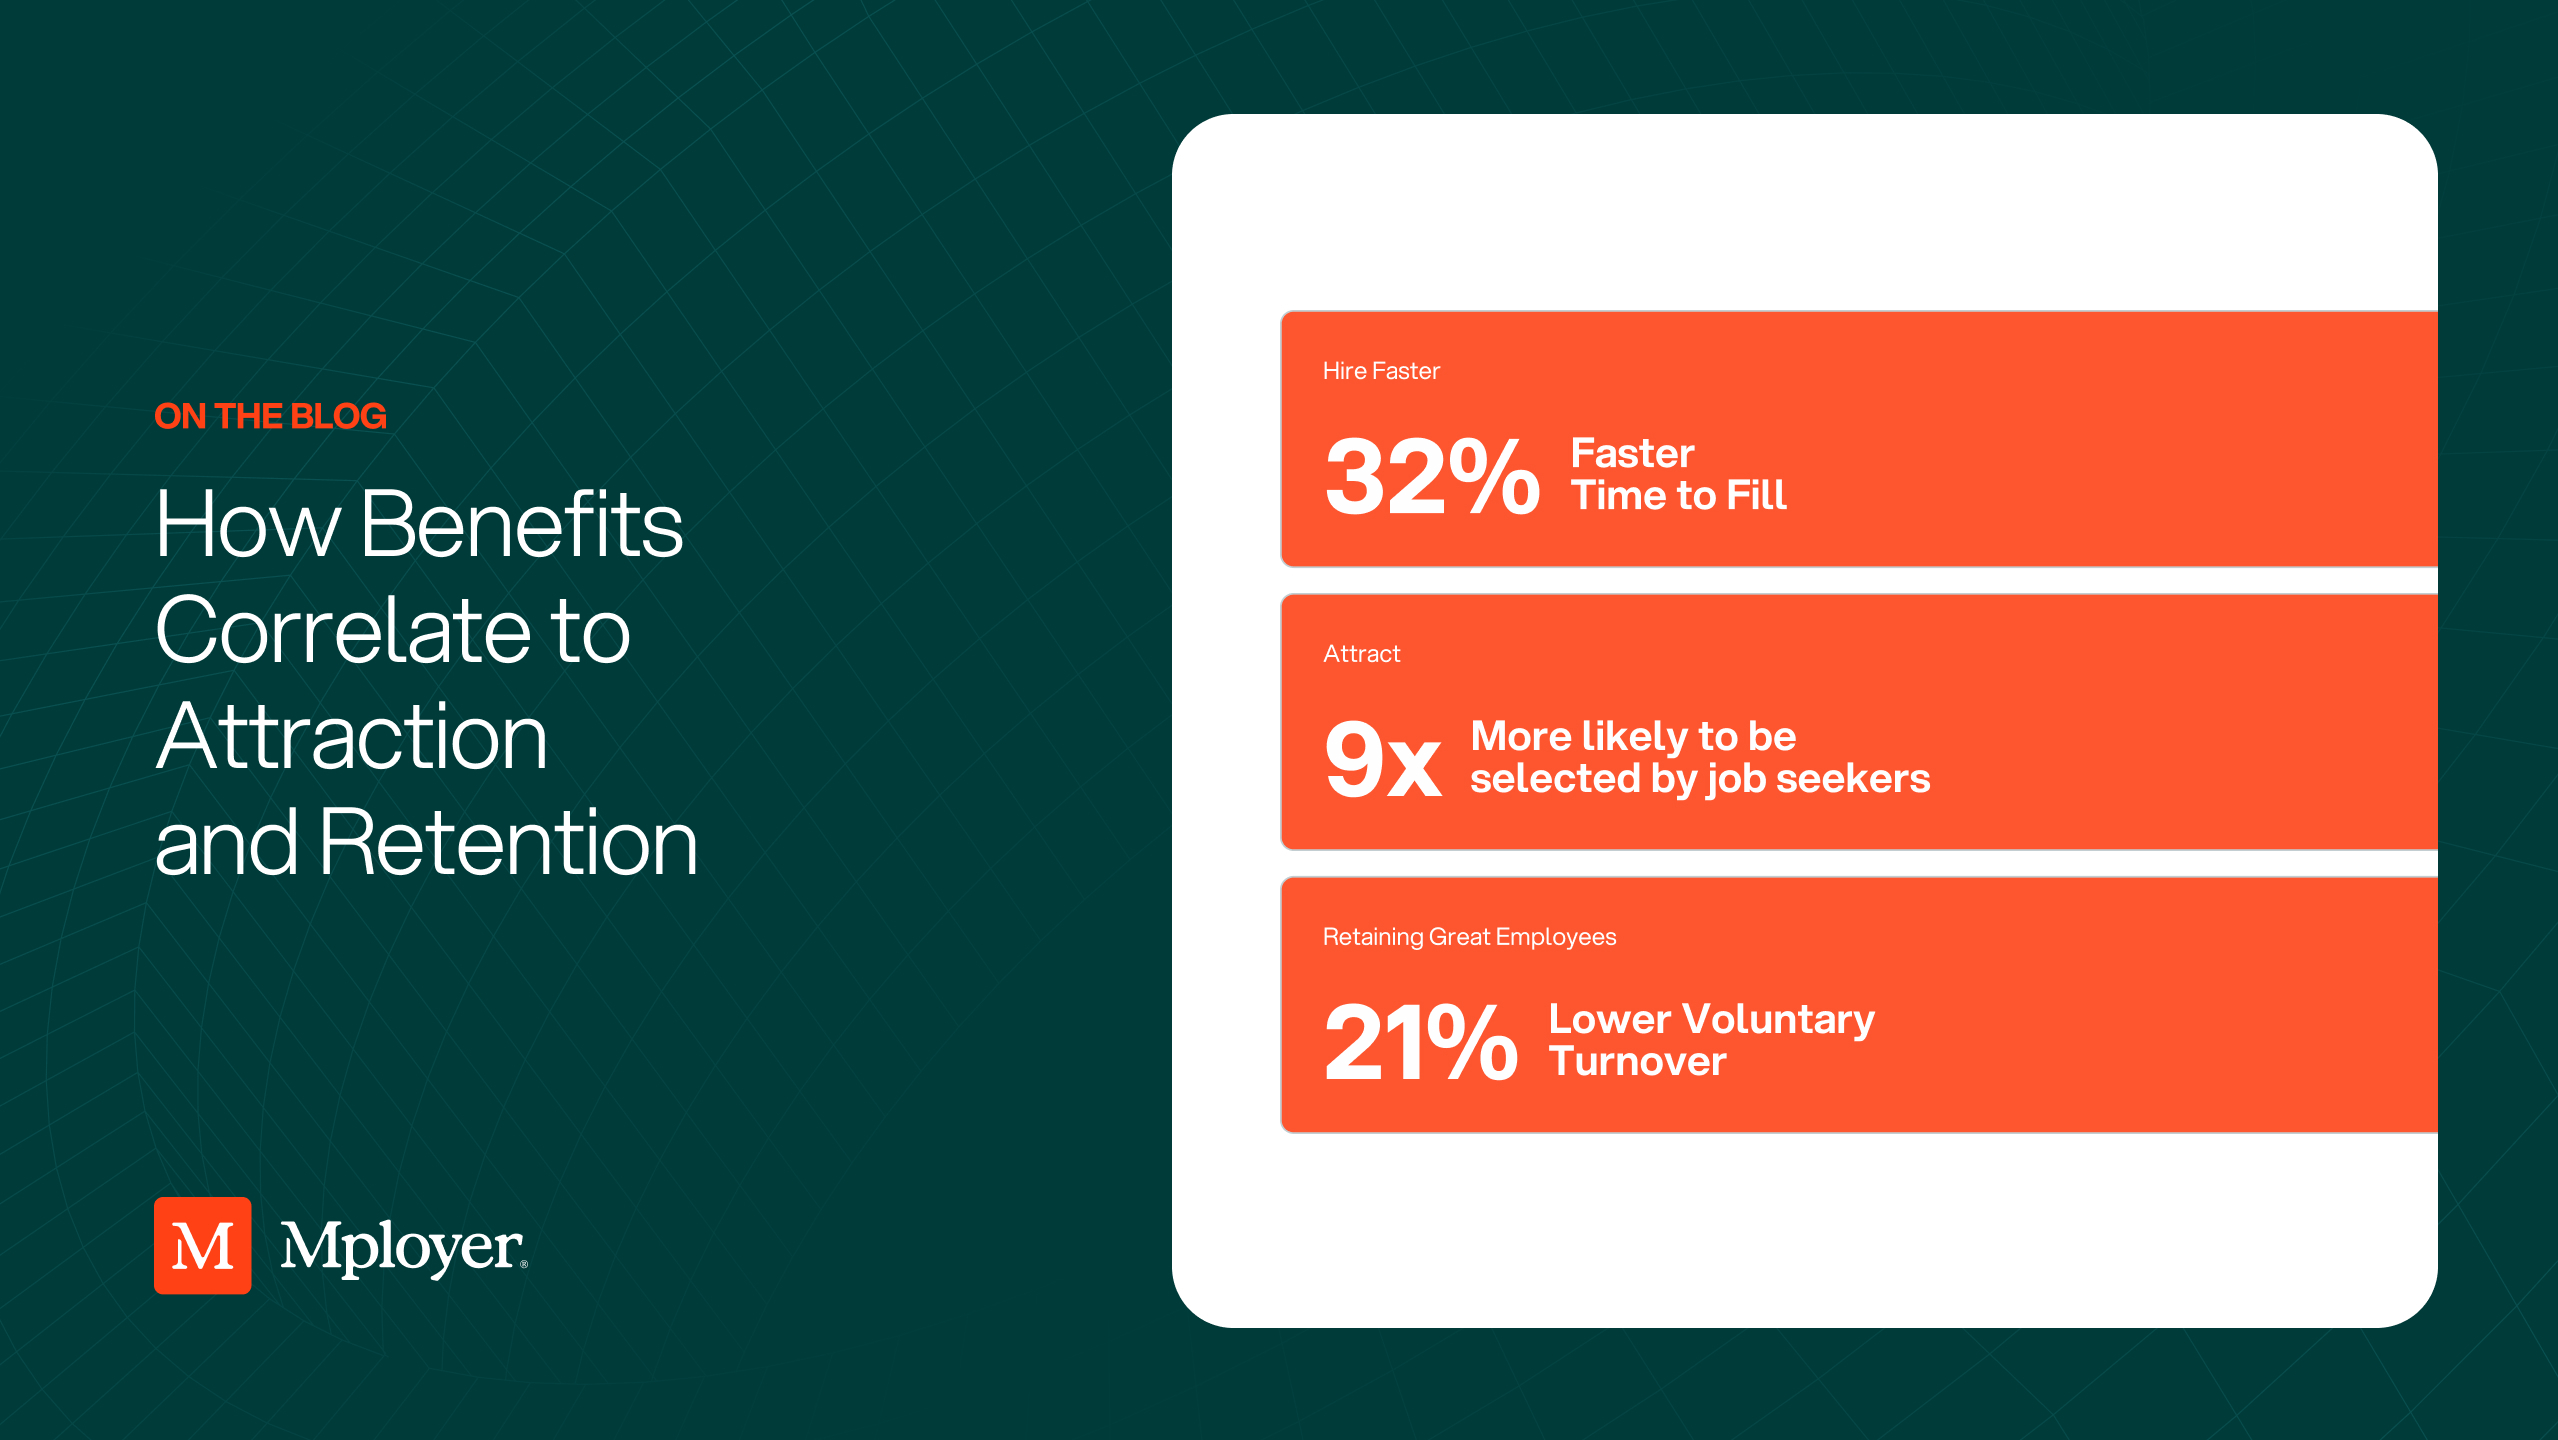
32% Faster Time to Fill

Companies with highly rated benefits fill roles 32% faster on average. That’s not a small number when each open role represents lost productivity, added stress on teams, and missed business opportunities.

One mid-sized tech company we worked with had a senior data role open for 90 days. At an estimated $1,000/day in opportunity cost and internal time, that single opening cost them over $90,000, and that figure doesn’t take delayed product launches into account. After updating how they presented their benefits and gathering employee feedback to showcase online, they cut their average time-to-fill to under 60 days for similar roles. That’s a $30K+ impact per hire.

When job seekers understand the value of your benefits, they’re more likely to apply and say yes to offers, which can reduce your hiring cycle by days or even weeks.

21% Lower Voluntary Turnover

Turnover is expensive, especially when it’s your best people walking out the door. Companies with top-rated benefits by employees saw 21% lower annual voluntary turnover. That’s a powerful retention lever. When employees feel supported through comprehensive health plans, generous parental leave, mental health resources, and financial wellness programs, they’re less likely to leave, even when other offers come their way.

A 21% reduction in voluntary turnover on a 100-person team could mean keeping 10–15 more experienced employees each year. That’s not just savings, that’s momentum.

9x More Likely to Be Selected by Job Seekers

In competitive markets, benefits are a differentiator - but only when they’re visible. Candidates are 9x more likely to choose companies that clearly showcase strong benefits. Whether on Glassdoor, your careers page, or through employee word-of-mouth, clear communication around benefits drives candidate behavior.

Think of it this way: two companies offer similar pay. One has three bullet points on benefits. The other shows employee ratings, gives specific plan details, and includes testimonials. The choice becomes obvious.

People don’t just want good benefits, they want to feel confident in what they’re getting, before they make a move.

75% of Employees Who Rate Benefits as “Excellent” Also Rate Loyalty as “High”

There’s a strong link between benefits and employee loyalty. Among employees who rated their benefits as “excellent,” 75% also rated their loyalty to the company as “high.” That’s not a coincidence, it’s a signal. Benefits contribute directly to how connected, appreciated, and committed employees feel.

Loyalty is about more than tenure, it’s about energy, advocacy, and long-term value. Benefits help build that loyalty day by day.

What Counts as “Highly Rated” Benefits?

In our analysis, the companies with the strongest HR outcomes weren’t necessarily the ones with the most expensive benefits, but the ones with well-designed, well-communicated offerings that employees consistently rated highly.

Highly rated benefits often include:

  • Competitive medical plans with transparent costs
  • Paid family and medical leave
  • Mental health and wellness support
  • Retirement matching or financial coaching
  • Inclusive plans that support diverse needs (e.g., fertility, gender-affirming care, caregiving)

What they all share is clarity and consistency, both in what’s offered and in how it’s experienced.

Benefits Aren’t Just a Line Item - They’re a Leverage Point

The data is clear: companies that offer and communicate great benefits perform better across key HR and people metrics.

Faster hiring. Lower turnover. Stronger engagement.

And the connective thread through it all? Employees knowing their benefits matter and feeling the value in their day-to-day experience.

Benefits shouldn’t be treated as background noise. They’re central to the employee experience and one of the few investments that directly influence both recruiting and retention outcomes.

Want to understand how your benefits are perceived? Or see how you compare to other employers in your market?

We’d be happy to show you, just reach out to start the conversation.

Get your free Insights+ report today at mployeradvisor.com.

Compliance & Policy
The One Big Beautiful Bill: 6 Ways It Impacts Employer-Sponsored Healthcare
We break down six major provisions from the new bill that will directly affect employer-sponsored healthcare plans—with added detail on what each means for HR leaders, brokers, and benefit consultants.
May 27, 2025

The One Big Beautiful Bill: 6 Ways It Impacts Employer-Sponsored Healthcare

On May 22, the House narrowly passed the One Big Beautiful Bill Act of 2025, a sweeping legislative package that slashes over $1 trillion in healthcare spending - most notably through cuts to Medicaid, changes to Medicare, and tighter control over the Affordable Care Act (ACA) provisions.

But buried in the bill’s 11th-hour amendments and complex fiscal shifts are several consequential reforms that could reshape the way employers provide healthcare benefits. It still needs to pass the Senate.

Below, we break down six major provisions from the bill that will directly affect employer-sponsored healthcare plans, with added detail on what each means for HR leaders, brokers, and benefit consultants.

1. ICHRAs Get a Boost: Favorable Signals and Financial Incentives

What changed?

The bill expands Individual Coverage Health Reimbursement Arrangements (ICHRAs) by allowing employees to use pre-tax dollars to purchase ACA marketplace (exchange) plans. For the first time, small employers who offer ICHRAs are eligible for a new tax credit (details pending Treasury guidance, but estimates suggest it could offset up to 50% of administrative and contribution costs for employers with fewer than 50 employees).

Why it matters:

ICHRAs allow employers to reimburse employees for individual health insurance rather than providing a group health plan. The concept was initially met with lukewarm reception but has gained traction in recent years, though still minimal adoption (less than 2%).

This bill signals an endorsement from the current administration, making ICHRAs a potentially central pillar of the future employer health plan landscape. With the exchange rules also being tightened (see #3), this move creates a more stable and predictable ecosystem for employers looking to shift toward defined contribution models.

Expected impact:

Estimates from policy analysts suggest that this provision could increase ICHRA adoption by 20–30% over the next three years, bringing potentially 2–4 million more workers into ICHRA arrangements by 2027. This is still just 5% of employees on employer-sponsored care, but a few more tweaks could continue to increase that number.

2. Health Savings Account (HSA) Expansion: More Flexibility, Broader Appeal

What changed?

The bill significantly loosens the rules around HSAs:

  • Annual contribution limits increased (projected cap: ~$10,000 for individuals and $20,000 for families).
  • Bronze and Catastrophic plans in the individual market are now deemed HSA-compatible.
  • HSA funds can now be used for gym memberships, certain fitness apps, and sports-related activities (pending IRS definitions).

Why it matters:

These updates make HSAs far more versatile and attractive. For employers, pairing HSA-qualified high-deductible health plans (HDHPs) with expanded HSA usage can serve as a cost-control strategy while still supporting employee wellness.

The compatibility of Bronze and Catastrophic plans with HSAs also complements the ICHRA expansion, since many exchange plans fall into these tiers. It paves the way for consumer-driven health models that blend pre-tax benefits with individual choice.

3. Stricter Exchange Rules and Employer Mandate Enforcement

What changed?

The bill implements a host of ACA exchange-related reforms, including:

  • Stricter eligibility verification for subsidies and zero-premium plans.
  • Shortened open enrollment by one month.
  • Eliminated automatic re-enrollment into Silver plans.
  • Insurers can deny coverage to applicants behind on premium payments.

Why it matters:

These changes aim to clamp down on fraud and subsidy misuse - issues that have dogged the exchange system since inception. Reports indicated that some individuals overstated income or took advantage of lenient re-enrollment policies.

From an employer perspective, particularly those using ICHRA models, this introduces both compliance pressures and risk mitigation benefits. While tighter enrollment rules may create more friction for employees navigating exchanges, they also stabilize the risk pool, potentially lowering premium volatility.

4. Restoring Cost-Sharing Reductions: A Lifeline to Exchange Stability

What changed?

The bill restores cost-sharing reduction (CSR) payments to insurers that serve the lowest-income ACA enrollees. These payments that were defunded in 2017. At the same time, it bars CSR funds for plans that include abortion coverage.

Why it matters:

CSR payments lower out-of-pocket costs for enrollees and stabilize insurance pricing. Their return is a boon to insurers, allowing them to offer lower deductibles and premiums on Silver-tier plans, particularly important for ICHRA participants who may rely on this tier to maximize value.

It’s also a subtle but significant endorsement of the ACA exchange infrastructure, reinforcing its viability for employer-funded individual insurance. In effect, this provision serves as another indirect boost to ICHRA success.

5. Pharmacy Benefit Manager (PBM) Reform: Transparency That Could Spill Over

What changed?

While most of the PBM reforms target Medicare Part D and Advantage, the bill:

  • Requires PBMs to "delink" compensation from negotiated discounts.
  • Bans spread pricing (when PBMs charge insurers more than they pay pharmacies).
  • Increases data transparency requirements.

Why it matters:

These changes don’t directly apply to employer-sponsored commercial plans...yet. But PBM practices are under bipartisan scrutiny, and Medicare regulations often act as a precedent for broader industry reform.

Employers who self-fund plans or partner with third-party administrators (TPAs) could soon benefit from greater insight into drug pricing, rebates, and margins. At minimum, this raises employee awareness and expectation for cost transparency.

6. Lawful Immigrant Coverage Restrictions: HR and DEI Challenges Ahead

What changed?

The bill restricts lawful immigrant access to unsubsidized exchange coverage and makes DACA recipients ineligible for premium subsidies.

Why it matters:

For employers with diverse workforces - including those using ICHRA to cover part-time, seasonal, or contract labor - this provision introduces coverage challenges. Employees affected by these rules may face higher premiums or complete ineligibility for coverage options, potentially increasing uninsured rates.

This raises ethical and equity questions, particularly for organizations committed to Diversity, Equity, and Inclusion (DEI) principles. HR leaders may need to rethink how they support affected workers, or whether to offer alternative employer-funded benefits.

Final Thoughts

While the One Big Beautiful Bill is still awaiting Senate action and final reconciliation, its passage through the House offers a roadmap for where healthcare policy is heading, toward leaner federal spending, tighter exchange oversight, and growing support for consumer-driven models like ICHRAs and HSAs.

For employers, this means:

  • Proactive benefits strategy is key.
  • ICHRAs are getting stickier and may soon become mainstream.
  • Transparency and accountability will be expected across PBM, exchange, and employee communications.

Now is the time for HR teams and brokers to evaluate how these shifts can be leveraged strategically—not just to stay compliant, but to build more flexible and cost-effective benefits for a changing workforce.

Labor Market Insights
The Market Employment Summary for May 2025
Meta Description: Each month, Mployer breaks down the Bureau of Labor Statistics’ most recent State Employment and Unemployment Summary to highlight some employment trends across various markets. This is an overview of May’s report.
May 23, 2025

Editor's Note: This report is based on survey data from April 2025 that was published in May 2025. This is the most recent data available. (Source: Bureau of Labor Statistics)

US employers exceeded job forecasts by almost one-third, adding 177 thousand new entries to their payrolls last month, which was almost 40 thousand more than had been predicted.

Only 5 states saw a net increase in jobs, however, while the remaining states and Washington DC recorded no meaningful movement in net job figures. 

Meanwhile, the national unemployment rate remained essentially unchanged through April at 4.2%.

Over the course of the month, however, 3 states plus Washington DC recorded an increase in statewide unemployment, while 2 states registered a decrease in unemployment rate and the remaining states saw no significant change.

16 states have seen an increase in net jobs throughout the last 12 months, while the remaining 34 plus Washington DC have recorded no net movement over the year. 

Below is the breakdown of the Bureau of Labor Statistics’ (BLS) market employment summary from the May 2025 report.

States With the Highest Unemployment Rates

Washington DC was the ‘state’ with the highest unemployment rate last month at 5.8% overtaking Nevada which had been on a 5-month streak with the highest unemployment rate. 

The unemployment rate in Washington DC climbed from 5.6% to 5.8% over the month, while Nevada’s unemployment rate continued its downward trajectory, decreasing from 5.7% to 5.6%.

Only 5 other states recorded an unemployment rate that was significantly above the national average in April - Michigan (5.5%), California (5.3%), Kentucky (5.2%), Ohio (4.9%), and Illinois (4.8%).

Besides Washington DC, there were only 3 states that recorded an increase in unemployment rate - Massachusetts (+0.2% unemployment, climbing from 4.4% to 4.6%), Iowa (+ 0.1%, rising from 3.4% to 3.5%), and Virginia (+0.1%, increasing from 3.2% to 3.3%). 

Over the last 12 months, 27 states have recorded an increase in unemployment rate, led by Mississippi at plus 1.2% and Michigan at plus 1.1%.

States With The Lowest Unemployment Rates

South Dakota notched its 16th consecutive month as the state with the lowest unemployment rate, holding steady at 1.8% through April. 

In total, 19 states recorded unemployment rates significantly below the national average of 4.2%. While South Dakota was the only state to show unemployment below 2%, there were 4 states with unemployment rates below 3% last month - Hawaii (2.9%), Montana (2.7%), Vermont (2.7%), and North Dakota (2.6%).

Over the last month, only 2 states recorded a drop in unemployment rate - Indiana (-0.2%, decreasing from 4.1% unemployment to 3.9% over the year), and Nevada (-0.1%, falling from 5.7% to 5.6%). 

Over the last 12 months, only Montana posted a net decrease in unemployment rate at - 0.3%.

States With New Job Losses

No state recorded significant net job losses over the last month or over the last year.

States With New Job Gains

5 states saw a significant increase in net jobs over the course of April. Texas had the largest increase in raw state payroll count at almost 38 thousand, followed by Ohio at about 22 thousand, and North Carolina at about 18 thousand.

In terms of proportional job growth, Arizona, Connecticut, North Carolina, and Ohio all recorded a 0.4% increase, while Texas posted 0.3% growth.

From April 2024 through April 2025, 16 states recorded a net increase in job growth, with the largest raw figure increases occurring in Texas (plus about 216 thousand jobs), Florida (plus about 144 thousand jobs), and New York (plus about 114 thousand jobs).

The largest percentage increase in the state workforce over the last 12 months, however, was claimed by Hawaii (plus 2.7%), followed by South Carolina (plus 2.4%), and Idaho (2.3%).

Mployer’s Take

This report represents the final data from Trump’s first 100 days in office during his second term, which is historically when presidents accomplish a disproportionate amount of their agendas. 

That said, many of the workforce cuts in the federal government that have taken place since Trump repurposed the Department of Government Efficiency led by Elon Musk to the task have yet to impact the unemployment and jobs data due to how and when those job reductions are captured and measured.

Similarly, while the threat and implementation of tariffs may yet have a more significant impact on national employment, the vast majority of tariffs that Trump implemented are currently on pause for another 6 weeks, and while the uncertainty is likely affecting the labor market to some degree, the impacts thus far have been relatively minimal. 

The continued strength of the labor market has significantly reduced the likelihood that the Fed will bring down interest rates when they meet again to discuss the matter next month. In fact, rate reductions at any point over the summer are looking less realistic at this point, although conditions can change very quickly, especially in the event that the tariff pause is not extended when it expires in early July.

Perhaps the most significant indicators of economic problems that may lay ahead are the interest rates attached to US Treasury bonds, which have been increasing as current investors (both foreign and domestic) unload their bond holdings to a buyer pool that is demanding increasingly higher returns.

Those bond interest rate increases reflect decreased confidence in both short and long term US economic health and increased concern in the ability of the US government to service its growing debt. 

Further, these issues may become exacerbated should the Senate get on board with the House’s Big Beautiful Bill given the trillions of additional debt the plan will result in if ultimately enacted into law and if the US GDP growth is unable to offset the spending increases and tax cuts included in the bill. 

The US recorded negative GDP growth in the first quarter of 2025 and if that trajectory holds or continues downward, the US economic conditions will be formally labeled as a recession as early as July as well, and while negative GDP growth in the current quarter is not a foregone conclusion, crossing that threshold would likely result in other negative economic feedback effects to pile on the situation.

In short, July may be a very meaningful month when it comes to both determining and assessing the US economic trajectory going forward.

Looking for more exclusive content? Check out the Mployer blog.

Employee Benefits
Mployer Launches Sun Life Stop-Loss Data Integration
Mployer Launches Sun Life Stop-Loss Data Integration, Enhancing Access to Stop-Loss Insights for Leading Consultants & Employers. This partnership introduces Sun Life’s multi-year claims analytics, including detailed stop-loss patterns, trends in high-cost conditions and high cost drug utilization, directly into Mployer’s benchmarking and reporting features. With this addition, consultants and brokers can better anticipate risk patterns and deliver stronger, data-driven guidance to clients.
May 22, 2025

FOR IMMEDIATE RELEASE 

Mployer Launches Sun Life Stop-Loss Data Integration, Enhancing Access to Stop-Loss Insights for Leading Consultants & Employers 

Nashville, TN – May 22nd, 2025

Mployer, the nations’ leading employee benefit ratings platform, has partnered with Sun Life U.S. to bring expanded stop-loss analytics into its Mployer Insights platform — giving leading consultants, brokers and employers more powerful tools to navigate rising healthcare costs with clarity.

This partnership introduces Sun Life’s multi-year claims analytics, including detailed stop-loss patterns, trends in high-cost conditions and high cost drug utilization, directly into Mployer’s benchmarking and reporting features. With this addition, consultants and brokers can better anticipate risk patterns and deliver stronger, data-driven guidance to clients. 

“Mployer and Sun Life are partnering on new ways to bring valuable stop-loss information and other cost-containment strategies into the hands of employers and leading brokers,” said Brian Freeman, CEO at Mployer. “We are excited to work with leading benefits advisors supporting their work in turning complex claims trends into smarter strategies for their clients.”

The new Sun Life-powered features are available now, with more updates and data expansions to follow later this year. 

“This partnership strengthens our mission to provide clear, actionable insights that help brokers guide their clients through complex healthcare and benefit decisions,” said Brian Freeman, CEO at Mployer. 

The updated Insights platform is available now, with additional data sources and enhancements planned throughout 2025. To access sample reports or request more detail, go to MployerAdvisor.com.  

About Mployer

Mployer is redefining the industry standard for benefits analytics by empowering employers, employees, and benefits consultants to easily assess, rate, and communicate the value of employee benefits. Driven by rising employer costs and increasingly competitive hiring markets, Mployer brings transparency to an industry that affects the over 160 million Americans on employer-sponsored health plans. 


About Sun Life 

Sun Life is a leading international financial services organization providing asset management, wealth, insurance and health solutions to individual and institutional Clients. Sun Life has operations in a number of markets worldwide, including Canada, the United States, the United Kingdom, Ireland, Hong Kong, the Philippines, Japan, Indonesia, India, China, Australia, Singapore, Vietnam, Malaysia and Bermuda. As of December 31, 2024, Sun Life had total assets under management of C$1.54 trillion. For more information, please visit www.sunlife.com. 

Sun Life Financial Inc. trades on the Toronto (TSX), New York (NYSE) and Philippine (PSE) stock exchanges under the ticker symbol SLF. 

Sun Life U.S. is one of the largest providers of employee and government benefits, helping approximately 50 million Americans access the care and coverage they need. Through employers, industry partners and government programs, Sun Life U.S. offers a portfolio of benefits and services, including dental, vision, disability, absence management, life, supplemental health, medical stop-loss insurance, and healthcare navigation. Sun Life employs more than 8,500 people in the U.S., including associates in our partner dental practices and affiliated companies in asset management. Group insurance policies are issued by Sun Life Assurance Company of Canada (Wellesley Hills, Mass.), except in New York, where policies are issued by Sun Life and Health Insurance Company (U.S.) (Lansing, Mich.). For more information visit our website and newsroom. 

Employee Benefits
How To Know If You Offer Competitive Benefits
Job candidates and employees alike often want to know whether their benefits are ‘good’, but employers typically don’t have a particularly accurate understanding of how their benefits offerings compare with competitors' offerings.
May 18, 2025

Key Takeaways

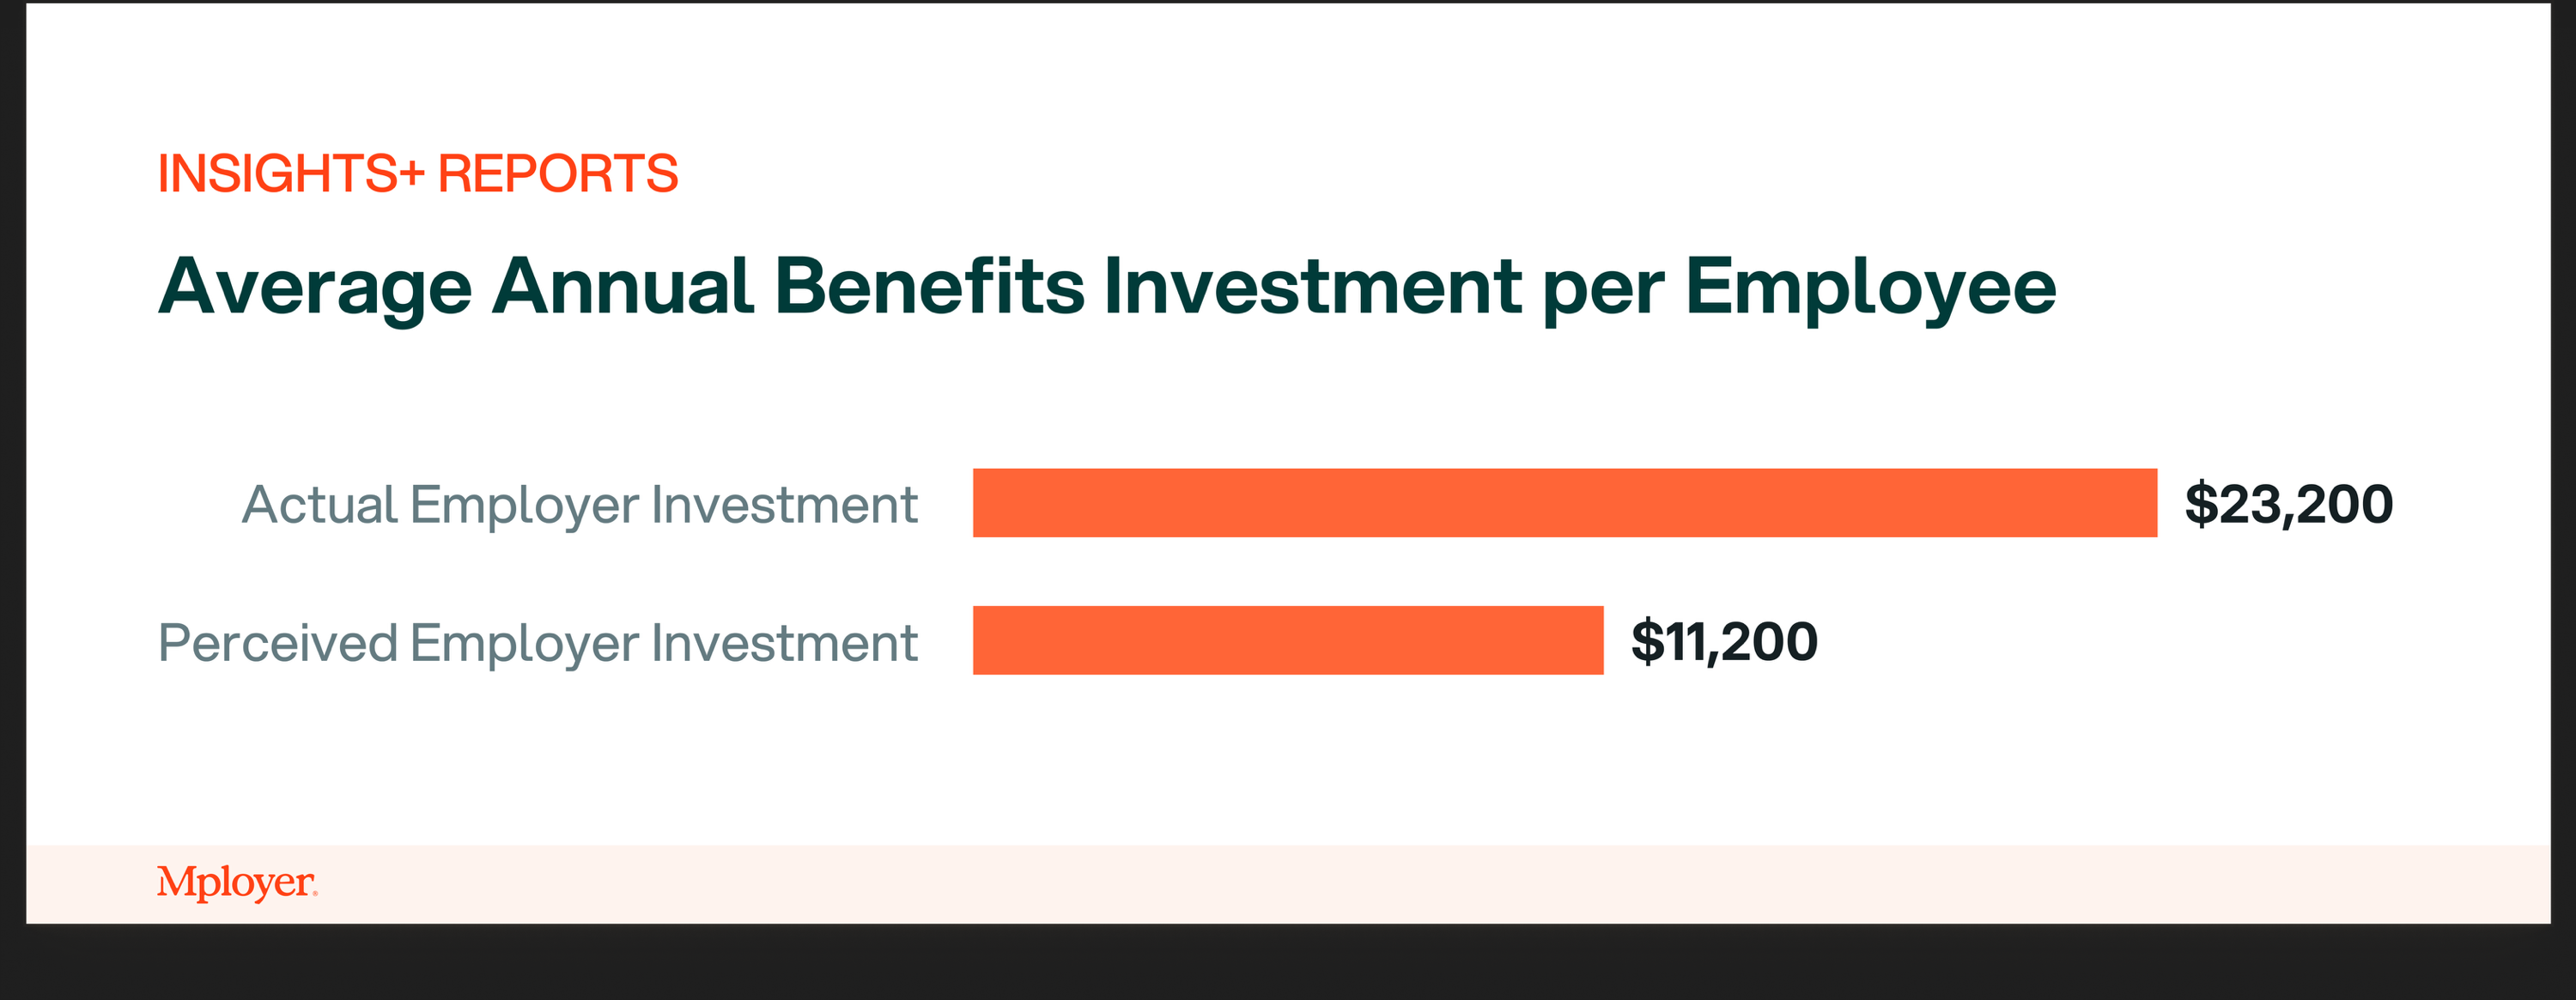
  • Most employees drastically underestimate the value of their benefits—valuing them at $11,200 on average vs. a true value of $23,200
  • Employers lack a clear, credible way to showcase the value of their benefits or compare against the market
  • Proving you offer competitive benefits lead to lower voluntary turnover, shorter time to fill roles, and a 9X increase in quality applicants
  • Mployer’s Insights+ platform uses a proprietary, data-backed scoring methodology to benchmark your benefits across the four core pillars of employee benefits – medical, ancillary, leave and retirement
  • With access to the largest benchmarking dataset in the industry, Insights+ enables custom cohort comparisons and ratings by your by industry, region, and size
  • To see how your benefits compare to companies just like you, reply and let us know

The Perception Gap: Why Competitive Benefits Are a Strategic Advantage

Ask any employer if they offer competitive benefits, and you’ll likely get an awkwardly confident “yes.” But dig a little deeper—compared to who? Based on what? That’s where things break down immediately.

The reality is: employee benefits today are judged almost entirely based on perception, not proof.

Employees, on average, believe their benefits are worth about $11,200. In truth, employers are investing nearly $23,200 per employee per year per Mployer’s Insights+ 2025 study across companies representing over 1M employees. That’s a massive gap in perceived value—and one that significantly undermines retention, recruiting, and engagement.

When you can prove that your benefits are competitive—not just internally, but compared to your true market—you unlock a measurable strategic advantage:

  • Lower voluntary turnover
  • Faster time to fill roles
  • 9X improvement in qualified applicants

But proving benefit competitiveness takes more than guesswork or gut feel. That’s why we built Insights+—a first-of-its-kind platform that turns perception into data-backed proof.

Shape

Introducing Insights+: The Industry Standard for Benefits Benchmarking

At Mployer, we’ve spent years building Insights+ in partnership with the top insurance brokerages in the country. It’s the most advanced, statistically accurate benchmarking system on the market, designed to give employers a true understanding of their benefits competitiveness.

Here’s how it works:

  • We ingest your benefits guide or a quick intake form
  • Our engine scores your plan across four core components (more on that below)
  • We benchmark your plan against a custom peer group of employers like you, same industry, region and size —not a generic industry average.
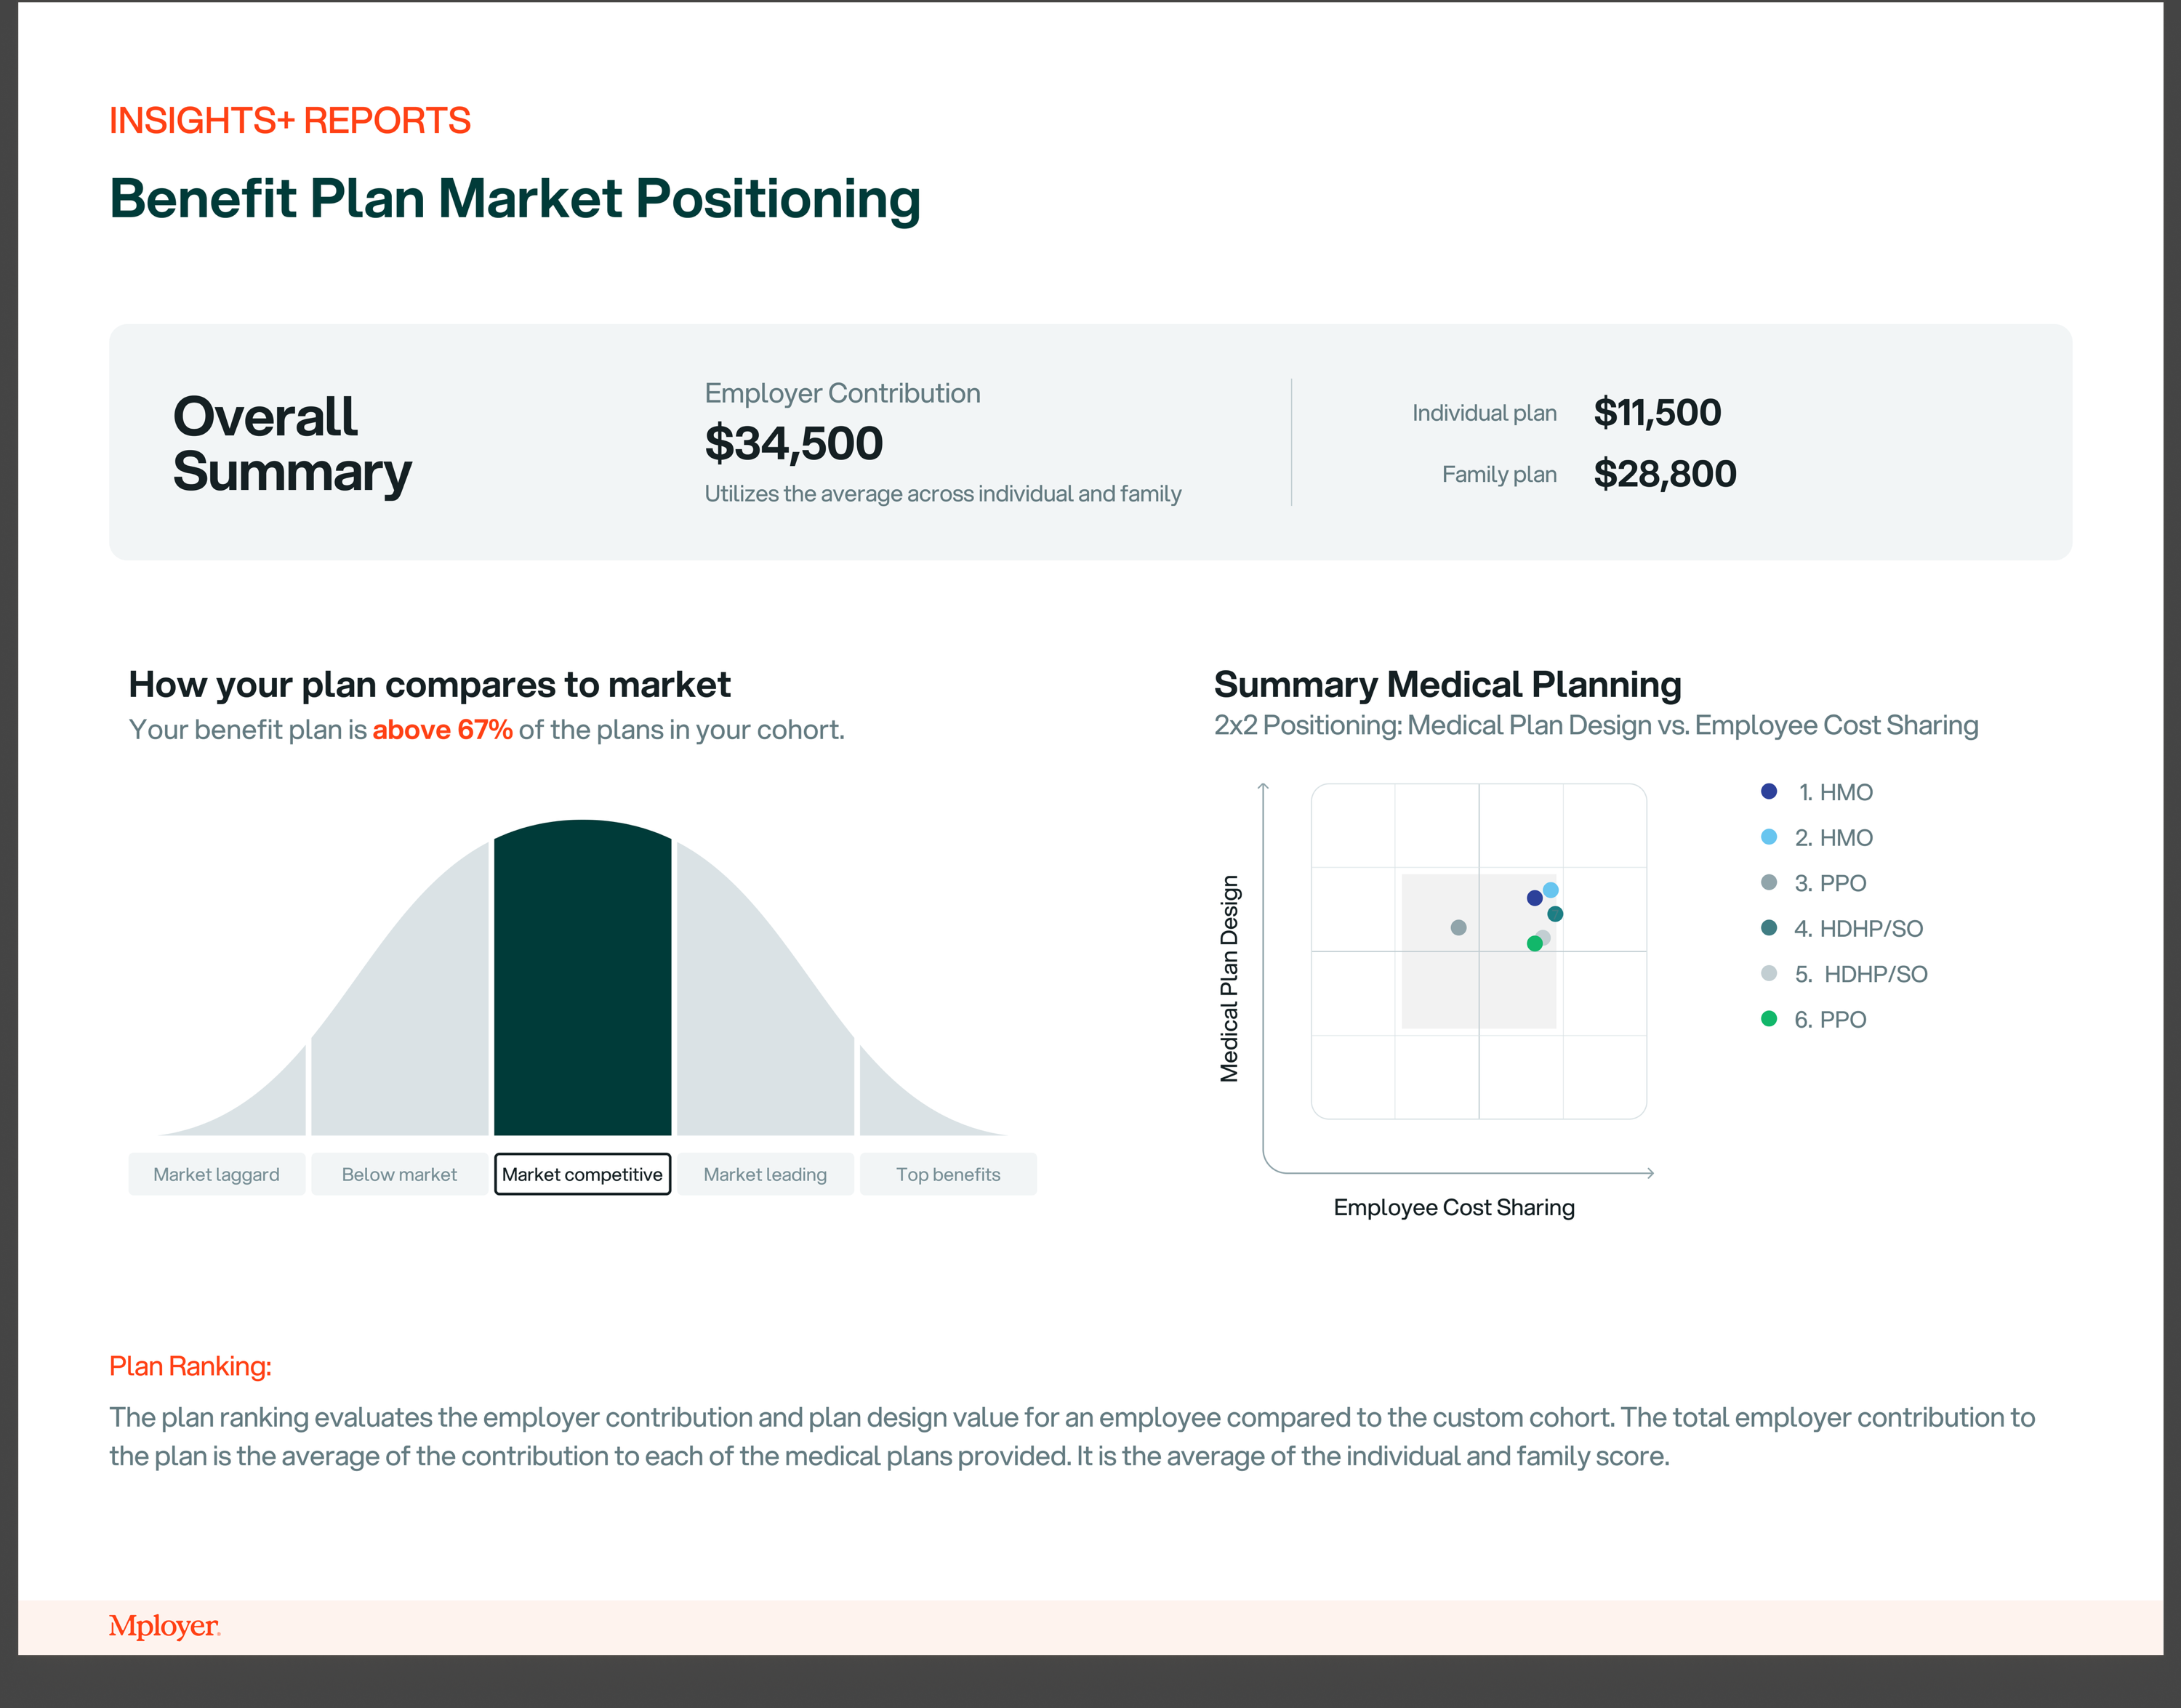
  • You receive a full report and rating that you can share with your team, inclusive of:
    • An overall rating (it’s pretty great)
    • Strengths, weaknesses, and gaps
    • Comparison vs. peers on spending and participation
  • Plus, if your score ranks highly—you receive a recognition toolkit with ready-to-use materials for employee education, recruiting, and brand positioning

This isn’t a one-size-fits-all solution. It’s a proprietary methodology built on a 30,000+ employer dataset, kept current through direct employer uploads, broker partnerships, and more.

How We Score Benefits: The Four Core Components

Competitive benefits can’t be measured by a single number like "how much you spend" or whether you offer a 401(k). It takes a holistic view—and that’s what our four-pillar scoring system does.

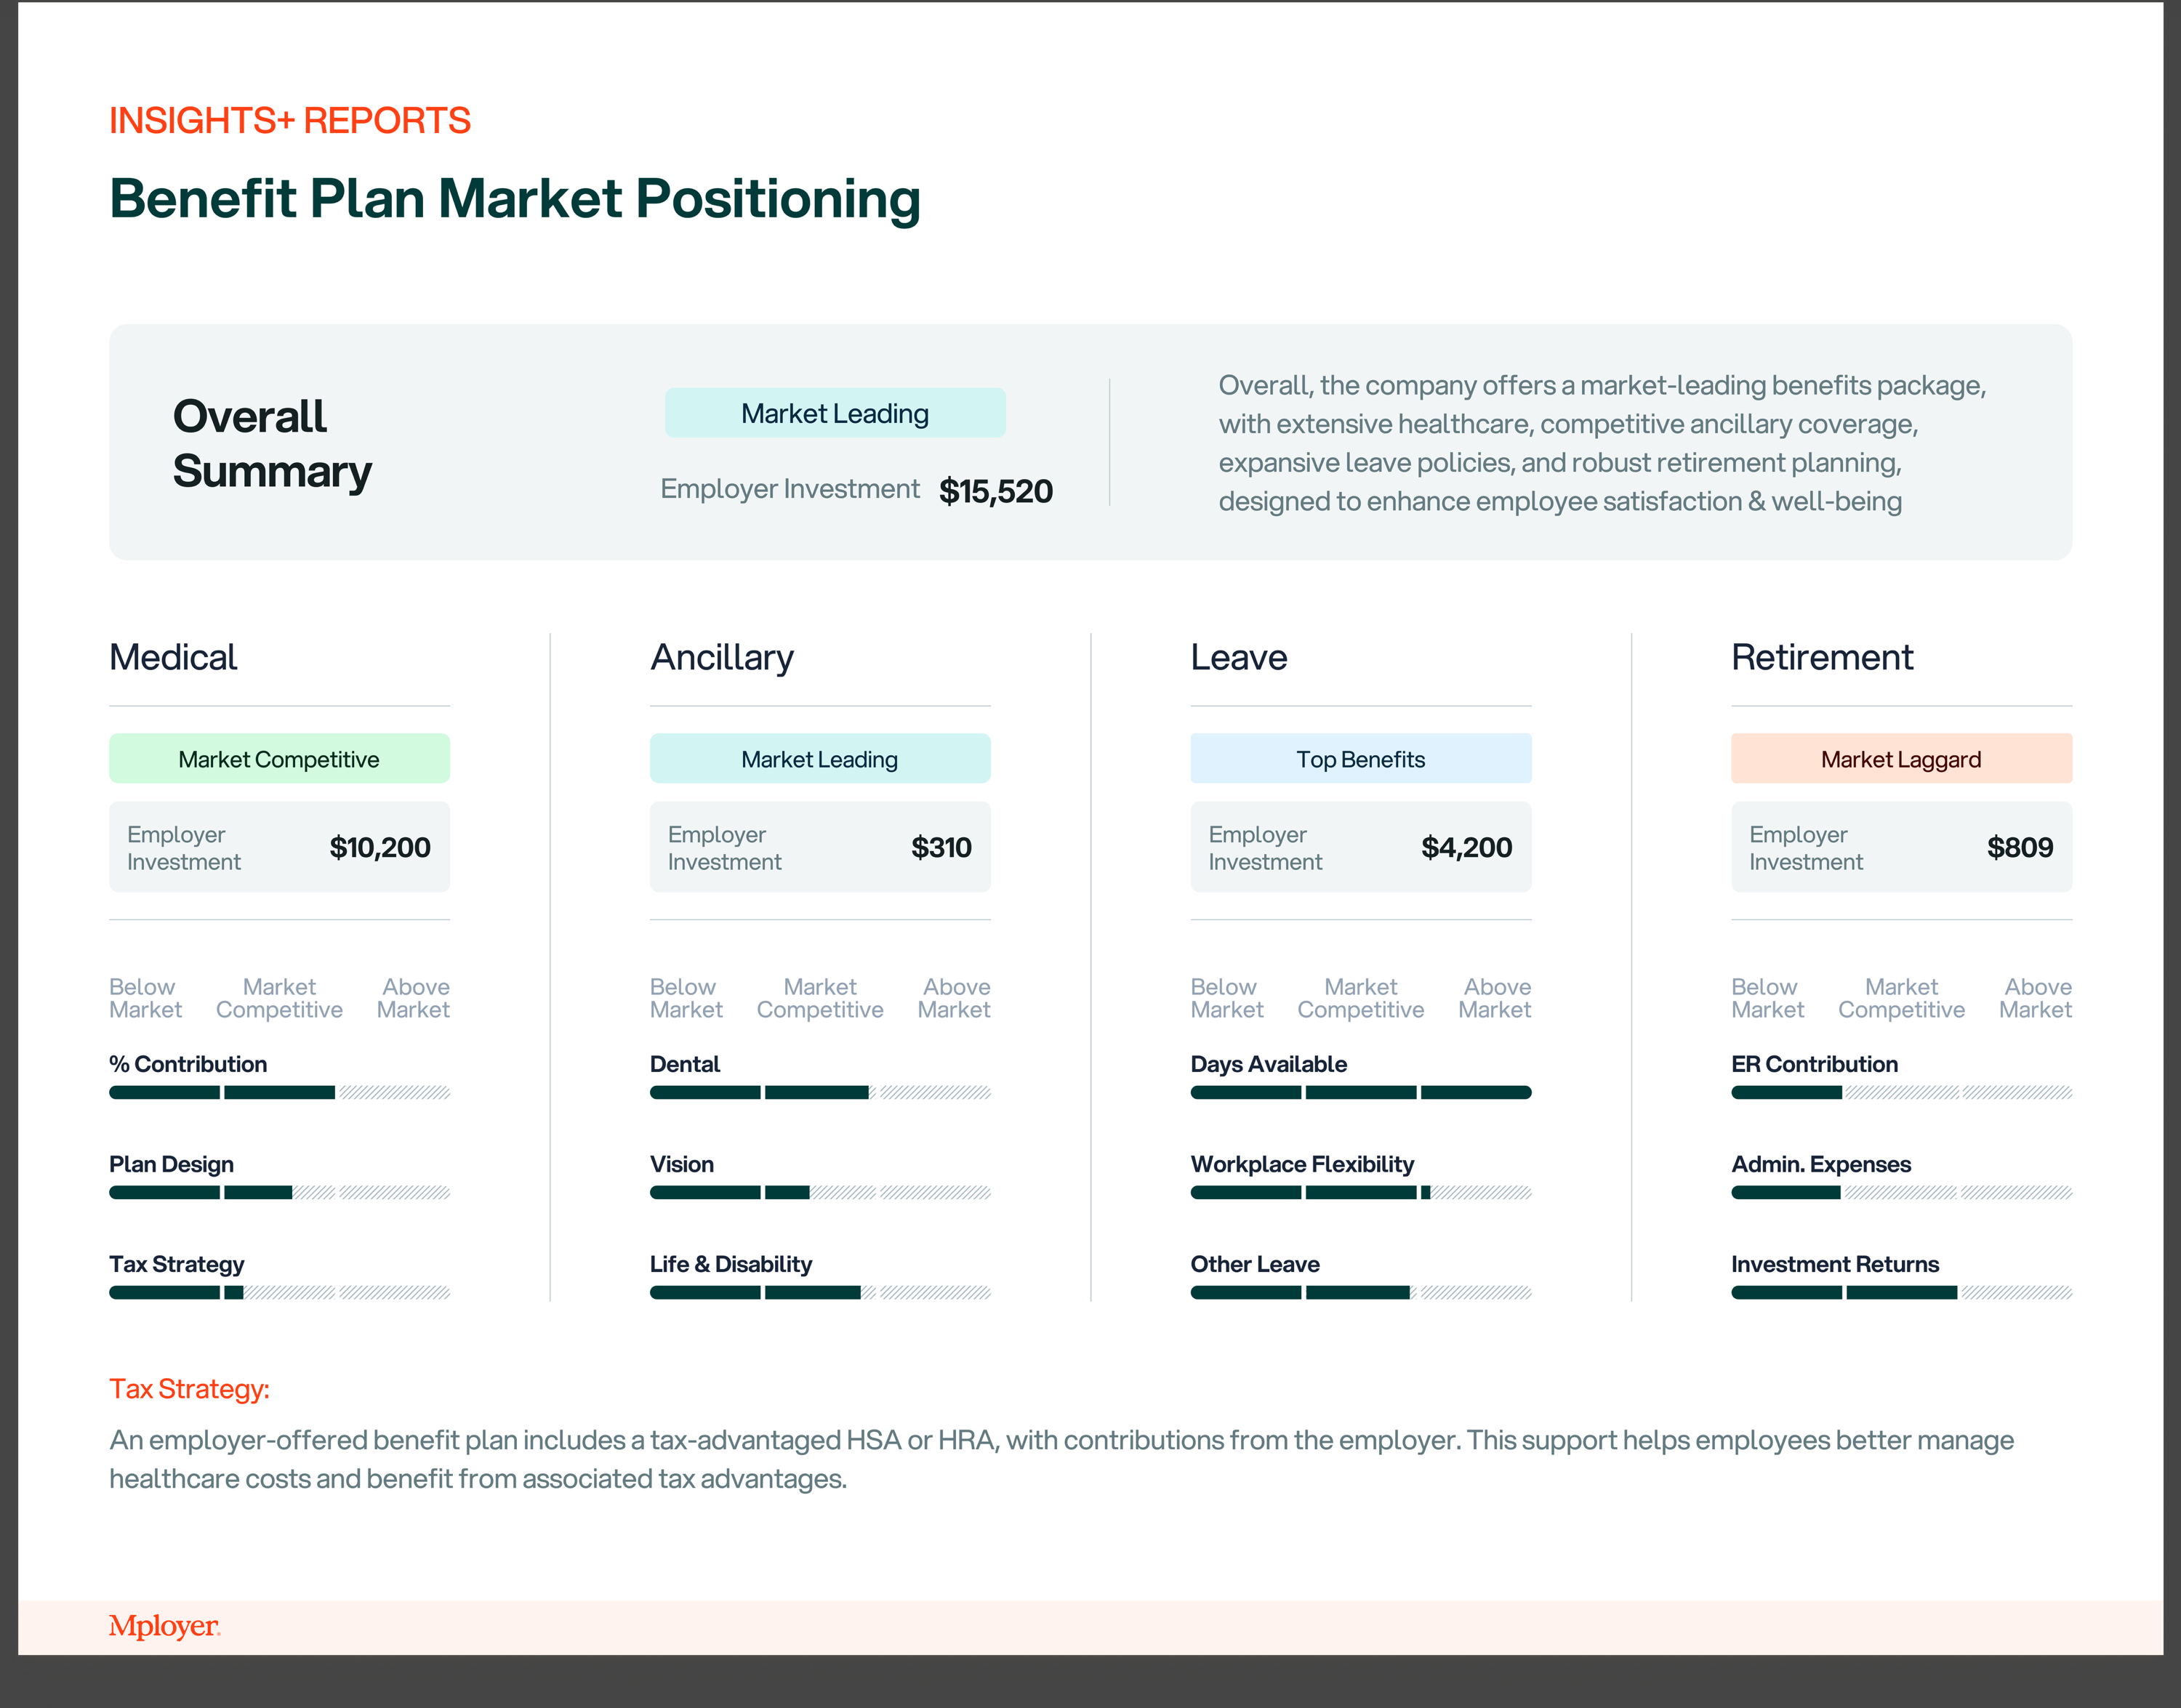
These are the four foundational categories we use to assess the true competitiveness of a plan:

1. Medical

This includes everything from your monthly premiums to deductible levels, plan options, and employer contribution percentages. It’s typically the most expensive part of your benefits package—and the most scrutinized by employees. We evaluate depth of coverage, choice, affordability, and access and compare your plan to your cohort.

2. Ancillary

Dental, vision, disability, life and voluntary insurance fall here. Our methodology weighs plan richness, employer contribution for each individual line item. While often considered secondary, ancillary benefits play a big role in perceived value—and they’re a low-cost lever for improvement.

3. Leave

PTO, holidays, parental leave, and—critically—flexibility (remote, hybrid, compressed schedules). We evaluate not just what's offered, but how it compares to market expectations within your peer group. Leave policies are increasingly make-or-break in competitive industries.

4. Retirement

401(k), 403(b), ESOPs, and other savings mechanisms. We assess both participation structures (e.g., automatic enrollment, matching formulas) and actual dollar contributions compared to peers.

Our scoring system blends employee perception, plan design, cost, and participation data to generate a truly holistic and market-relevant evaluation.

No other system in the industry brings this level of depth, customization, and credibility.  Want to see how you compare? Let us know.

Benchmarking Against a Custom Peer Group

Forget comparing yourself to national averages or sample data from a survey two years ago. With Mployer, you benchmark against a precisely matched peer group.

We offer the largest and most granular dataset in the industry, covering over 30,000 employers and growing. This enables you to compare your benefits offerings against statistically valid cohorts based on:

  • 30+ Industries (from healthcare to logistics to tech)
  • 8 Organization Sizes (from <25 employees to 10,000+)
  • 8 U.S. Regions (ensuring geographic relevance)

Only with us can you create a peer group so tailored that it mirrors your recruiting market, reflecting what companies like yours—and hiring for the same roles—are doing.

Whether you’re a manufacturing firm in Ohio or a startup in Austin, your competitive landscape looks different. We ensure your comparison group matches reality, not abstraction.

Competitive Benefits as a Strategic Advantage

We say it often because it’s true: benefits are more than a cost center—they’re a strategic asset.

When your benefits are perceived as strong, you get:

  • More applicants (especially the ones you actually want)
  • Fewer people leaving for marginal improvements elsewhere
  • Stronger employee engagement and satisfaction

But all of that starts with knowing how you compare—and having the data to back it up.

Insights+ doesn’t just show you where you stand. It gives you the tools to improve, the proof to showcase what you already do well, and the recognition materials to ensure your benefits investment is seen and appreciated by the people who matter.

See How Your Benefits Stack Up

If you’re ready to move beyond guesswork and prove that your benefits are truly competitive, Insights+ is your next step.

You’ll get:

  • A customized, data-backed Benefits Competitiveness Score
  • Insights into where you're ahead or behind the curve
  • Benchmark comparisons across size, region, and industry
  • A recognition kit if you score well—complete with messaging tools, badges, and recruiting assets

Best of all? It’s free for employers to get started.

Let us show you what great benefits really look like—on paper, in practice, and in perception.

FREE Insights+ Reports For Qualifying Employers

Labor Market Insights
The Employment Situation for May 2025
The latest economic release from the Bureau of Labor Statistics reports that the U.S. job market added 177 thousand jobs last month while unemployment held steady 4.2%.
May 3, 2025

Editor's Note: This report is based on survey data from April 2025 that was published in May 2025. This is the most recent data available. (Source: Bureau of Labor Statistics)

The job market once again proved to be more resilient than economists were predicting, with US employers adding 177 thousand jobs over the course of April as the unemployment rate held steady at 4.2%.

That figure of 177 thousand new jobs significantly exceeds the approximate 135 thousand new jobs that economists had forecast and is on par with the prior month’s ultimate report of 185 thousand new jobs (revised down from an initially-reported and headline-grabbing 228 thousand new jobs).

The number of long-term unemployed people rose by about 180 thousand to reach 1.7 million people, which is an increase of almost 12%. Long-term unemployed people - those who have been out of work but seeking it for 27 weeks or more - account for almost one-quarter of all unemployed people. Long term unemployment has increased by more than one-third over the last 12 months, up from about 1.25 million in April of 2024.

There was little change across most other metrics over the course of the month, however, with the employment population ratio (60%), labor force participation rate (62.6%), the number of people working part time for economic reasons (4.7 million), and the number of people who want a job (5.7 million) all essentially holding steady over the month.

Of the 177 thousand net jobs added last month, the healthcare industry was responsible for the largest proportion, adding 51 thousand jobs over the course of April, which is just below the 52 thousand net new payroll entries averaged each month over the last 12. 

The transportation & warehousing industry had the next largest net job increase in April, increasing its ranks by abou 29 thousand, with the financial activities industry and the social services industry claiming the addition of 14 thousand net employees and 8 thousand net employees, respectively, as well.

While there was no significant change over the month in most other industries, federal government employment did register a noteworthy drop of 9 thousand employees, bringing the total number of net federal jobs lost in 2025 to 26 thousand, although that figure does not represent the entirety of the situation - more on that to come.

Average hourly pay rose by about 6 cents to an even $36.06 per hour (an increase of 0.2%) over the month while the increase was about 3.8% over the last year - up from $34.67 per hour for privately employed, non-farm workers. 

The length of the average workweek grew slightly over the month to 34.3 hours per week. 

Mployer’s Take

The headline story from the jobs report is the continued strength of the labor market even in the face of economic forces like the threat and/or implementation of sweeping global tariffs, but the labor market alone does not tell the entire story of the economic moment.

For one, the federal workforce reductions instituted by Elon Musk’s Department of Government Efficiency may be 10 times larger than the 26 thousand jobs that have so far registered in this data, but those numbers won’t show up until those employees severance/leave pay has expired. 

Even more importantly, the GDP dropped by .03% through the first 3 months of 2025, which is the first contraction of GDP in 3 years, and while looming tariffs and federal firings were certainly contributors, those factors are more likely to have an increasing influence over the economy as a whole in the coming months than a decreasing influence.

Still, despite the lag in capturing federal employees whose jobs were recently terminated in these data sets and despite the uncertainty surrounding both the tariffs and their impact, this jobs report indicates that employers are still carrying on hiring, which itself is a kind of vote of confidence for the continued resilience of the US economy.

Further, inflation is up only 2.3% from last year and the rate of increase is trending downward, which is another positive sign, yet many economists (and employers) remain pessimistic about our chances for avoiding economic downturn in the months ahead.

The Federal Reserve will soon be facing the decision again about what to do with interest rates, and although inflation is nearing the Fed’s stated target of 2% annualized inflation, in light of the potential inflationary pressure that tariffs are capable of producing, the Fed may be less eager to lower interest rates now than they otherwise may have been given the current inflation levels.

We’ll know more about the Fed’s short term plan for interest rates in just a couple days, but we are still a ways off from knowing the ultimate impact of tariffs and federal workforce restructuring. 

In light of the first quarter economic contraction, however, and in light of the fact that economic recession can be defined as two consecutive quarters of negative GDP growth, it’s entirely possible that the current economic conditions are retroactively labeled as a recession as soon as July, even with the labor market still humming along.

Check out the Mployer blog here.