Understanding How Your Health Plan Is Funded Matters More Than Most Employers Think
How an employer funds its health plan sits quietly in the background of every benefits decision. Most CHROs and CFOs know their premium cost. Fewer understand the mechanics of how their plan is actually structured: who holds the risk, who administers the claims, how costs flow, and what flexibility, if any, they have to change any of it.
This post is not an argument for any particular funding model. It is an explanation of how each one works, what the national data shows about adoption by employer size, the key terms you need to understand, and the questions worth asking at your next renewal, whether you are fully insured today and want to stay that way, or whether you want to understand what moving to a different model would actually involve.
One important framing note upfront: funding model decisions are not one-size-fits-all. Fully insured arrangements are the right choice for a significant portion of employers, particularly smaller organizations, because the risk transfer and administrative simplicity is genuinely valuable. The goal here is clarity, not a prescription.
The Three Funding Models: What They Actually Mean
Nationally, 60% of employers are fully insured, 14% are level-funded, and 26% are self-funded, according to Mployer’s 2026 plan data covering 50,000+ employers. But those percentages look very different when you break them out by employer size. Among employers with fewer than 50 employees, fully insured is nearly universal while level-funded and self-funded require a minimum threshold of covered lives to be actuarially viable. The self-funded number rises sharply as employer size grows: roughly 27% of firms with 100–199 employees self-insure, compared to over 90% of firms with 5,000+ employees (DOL).
Fully Insured
The employer pays a fixed monthly premium to a carrier. The carrier assumes all financial risk for claims, manages the network, processes claims, and handles member services. The employer knows their cost in advance, there are no surprises if utilization spikes, but there is also no upside if the workforce has a healthy year. Premium increases at renewal are driven by the carrier’s projections, not the employer’s actual claims experience.
Per Member Per Month (PMPM) costs under fully insured arrangements include the carrier’s built-in risk margin and profit load, typically estimated at 10–15% of premium above what actual claims would cost. For a 200-person employer paying $700 PMPM in premium, that margin can represent $140,000–$210,000 per year in cost that never returns to the employer regardless of utilization. Fully insured is the right choice when an employer values predictability and simplicity above all else, or when their workforce is too small to absorb claims risk directly.
Level-Funded
Level-funded plans are the middle ground that has expanded significantly in the past decade, particularly for mid-size employers. The employer pays a fixed monthly amount, similar to a fully insured premium, but that payment is split into three components: a claims fund (to pay expected claims), a stop-loss premium (to cover catastrophic claims above a threshold), and an administrative fee. If actual claims come in below the funded level, the employer receives a refund of the surplus at year-end.
The average individual stop-loss deductible for level-funded plans is $46,318, meaning the employer’s claims fund absorbs the first $46,318 of any individual’s claims before stop-loss coverage kicks in. Level-funded plans give employers their first look at actual claims data, something a fully insured employer never sees, which is often the most valuable outcome of making the switch, independent of any refund.
Self-Funded (Self-Insured)
In a self-funded arrangement, the employer pays claims directly as they are incurred rather than paying a fixed premium. A third-party administrator (TPA) or carrier handles plan administration (network access, claims processing, member services),while the employer retains the financial risk. Stop-loss insurance caps the employer’s exposure on catastrophic individual claims and, optionally, on aggregate plan-wide costs.
The average individual stop-loss deductible for self-insured plans is $141,938, three times the level-funded equivalent, reflecting the higher risk tolerance required to make self-funding economically viable. PMPM costs in self-funded plans are highly variable month to month because costs track actual claims rather than a fixed premium. In a good year, a self-funded employer pays less than they would have under a fully insured arrangement. In a bad year, one with high utilization or a catastrophic claim, stop-loss coverage is what prevents the plan from becoming a financial crisis.
Key Terms Every CHRO and CFO Should Know
Benefits funding conversations move quickly into jargon. These are the terms that matter most:
PMPM (Per Member Per Month): The standard unit for measuring health plan costs. Total annual plan cost divided by total member months. Used to compare costs across plans, funding structures, and years. A fully insured employer often doesn’t know their PMPM, a self-funded employer tracks it monthly.
Stop-Loss Insurance: Insurance purchased by self-funded and level-funded employers to cap their claims exposure. Specific stop-loss covers individual catastrophic claims above a deductible. Aggregate stop-loss covers total plan costs that exceed a set percentage of expected claims (typically 120–125%). Nationally, 92% of self-funded employers carry specific-only stop-loss; 8% carry both specific and aggregate.
Specific Stop-Loss Deductible: The per-person threshold above which the stop-loss carrier begins reimbursing claims. Level-funded average: $46,318. Self-insured average: $141,938. Setting this number too high exposes the employer to more risk per claim; too low raises the stop-loss premium.
TPA (Third-Party Administrator): An independent organization that administers a self-funded plan, processing claims, managing networks, and handling compliance. 73% of self-funded employers use a TPA. TPAs are carrier-agnostic and give employers more flexibility in how they assemble their plan.
ASO (Administrative Services Only): An arrangement where a major carrier (UnitedHealthcare, Aetna, Cigna, BCBS) administers the plan while the employer retains financial risk. 27% of self-funded employers use ASO. Provides access to the carrier’s national network and integrated services.
Run-Out Claims: Claims incurred before a plan year ends but submitted after. A critical concept when switching funding structures, an employer moving from fully insured to self-funded must account for run-out liability from the prior plan year.
Lasering: A stop-loss carrier practice of excluding a specific high-cost individual from coverage, or charging a higher deductible for them, at renewal. Common for known catastrophic claimants. Employers should understand their stop-loss carrier’s lasering policy before selecting a deductible.
Aggregate Risk Corridor: The band above expected claims before aggregate stop-loss kicks in, typically 120–125% of projected costs. An employer with $10M in expected claims and a 1.22 corridor absorbs the first $12.2M before aggregate coverage begins.
Plan Administration: TPA vs. ASO and How Vendors Fit Together
One of the most underappreciated aspects of moving to a self-funded model is that it separates plan administration from plan financing. Under a fully insured arrangement, the carrier does both. Under a self-funded arrangement, the employer can assemble a best-of-breed stack: choosing a TPA for administration, a separate stop-loss carrier for risk protection, a PBM for pharmacy, and a network rental arrangement for provider access. That modularity is both the primary advantage and the primary complexity of self-funding.
Third-Party Administrators (TPAs)
TPAs administer the day-to-day operations of a self-funded plan without carrying any of the insurance risk. They process claims, manage member ID cards, handle appeals, provide reporting, and ensure compliance. Because they are carrier-agnostic, employers using a TPA can select their network, stop-loss carrier, and PBM independently. Key TPA vendors in the market include:
Imagine360 — self-funded and reference-based pricing specialist; strong mid-market focus
Allied Administrators — independent TPA with regional strength and flexible plan design
Trustmark — TPA with integrated level-funded and self-funded products
Benefit Administration Company (BAC) — mid-market TPA with stop-loss relationships
Sun Life — major stop-loss carrier that also provides TPA services and data analytics
Administrative Services Only (ASO) Carriers
Under an ASO arrangement, the employer accesses a major carrier’s infrastructure — their provider network, claims processing systems, and member services, while self-funding the actual claims. The primary advantage is network breadth: UnitedHealthcare, Aetna, Cigna, and the Blue Cross Blue Shield plans have national networks that most TPAs cannot replicate. The tradeoff is less plan design flexibility and, typically, less direct access to claims data. ASO is the most common path for large employers who want the benefits of self-funding without building an entirely independent plan infrastructure.
Carving Out Vendors: Where Employers Have the Most Leverage
One of the most powerful moves available to self-funded and level-funded employers is selectively replacing the default vendor stack with purpose-built alternatives. The most common carve-outs:
PBM Carve-Out: Most ASO carriers bundle their own PBM (UHC uses OptumRx, Aetna uses CVS Caremark, Cigna uses Express Scripts). Employers can carve out the PBM and contract directly with an independent pharmacy benefit manager, often achieving better rebate pass-through and lower net drug costs. Employers with 500+ covered lives typically have the leverage to negotiate meaningfully. Independent PBMs like Capital Rx, Navitus, and SmithRx are built specifically for transparent, pass-through pricing models.
Specialty Pharmacy Carve-Out: Specialty drug spend (oncology, biologics, GLP-1s) is the fastest-growing cost component in most plans. Carving specialty pharmacy to a dedicated specialty PBM or white-bagging program, where drugs are dispensed through the employer’s preferred channel rather than a hospital pharmacy, can generate material savings on a small number of high-cost claimants.
Centers of Excellence (COE) Carve-Out: For high-cost procedures like joint replacement, cardiac surgery, bariatric surgery, and oncology treatment, employers can steer members to designated high-quality, lower-cost providers. COE programs through vendors like Included Health, Transcarent, and the major carrier networks have demonstrated both quality improvements and cost reductions for self-funded employers.
Mental Health / EAP Carve-Out: Traditional EAPs have low utilization and limited clinical depth. A growing number of self-funded employers are carving out behavioral health to dedicated platforms (i.e. Lyra Health, Spring Health, Headspace Health) that offer broader access and measurable utilization outcomes.
Stop-Loss Carve-Out: ASO carriers often offer stop-loss as part of their package. Self-funded employers can go to market independently with stop-loss carriers (i.e. Sun Life, Tokio Marine HCC, Voya, Symetra) to find better rates, higher deductibles, or more favorable lasering terms.
Each carve-out adds administrative complexity and requires coordination between vendors. The benefit of a TPA is that it can serve as the integrating layer, managing data feeds, eligibility, and claims adjudication across a multi-vendor stack. For employers considering their first carve-out, the PBM is usually where the most immediate financial opportunity exists.
High-Cost Claimants and What the Stop-Loss Data Shows
For any self-funded or level-funded employer, understanding high-cost claimant dynamics is essential. A single member with a catastrophic diagnosis, a premature birth requiring NICU care, an oncology case requiring immunotherapy, or a rare disease requiring gene therapy, can represent more claims cost than dozens of average members combined.
The stop-loss reimbursement data illustrates how the financial burden of large claims is distributed between employers and their stop-loss carriers:
Claims under $1M: 41% reimbursed by stop-loss, employers absorb the majority
Claims $1M–1.5M: 60% reimbursed, stop-loss begins to shoulder more
Claims $1.5M–2M: 62% reimbursed
Claims $2M–3M: 71% reimbursed
Claims over $3M: 82% reimbursed, stop-loss is covering the vast majority
The practical implication: stop-loss coverage is most valuable at the extremes. Below $1M in total claims, the employer is absorbing nearly 60 cents of every dollar. Above $3M, the stop-loss carrier is covering 82%. Setting the right specific stop-loss deductible is therefore a meaningful financial decision, higher deductibles reduce stop-loss premiums but increase the employer’s per-incident exposure.
The composition of those high-cost claims matters too. Nationally, 71% of high-cost claim dollars are medical and 29% are pharmacy. That pharmacy share is rising. Specialty drugs, like particularly oncology therapies, biologics, and increasingly GLP-1 medications, are driving the Rx portion higher year over year. For self-funded employers, a specialty drug claim for a single member can now approach or exceed the average $141,938 stop-loss deductible in a single plan year. This is why formulary design, specialty pharmacy strategy, and stop-loss adequacy are increasingly interconnected decisions rather than separate ones.
What to Consider If You Are Fully Insured and Want to Understand Your Options
Moving from fully insured to level-funded or self-funded is not a decision to make lightly. It requires the employer, their CFO, their CHRO, and their broker or consultant to answer a set of questions honestly before modeling the economics:
Size: Do you have enough covered lives to make the model actuarially viable? Level-funded is generally accessible at 25–50+ lives. True self-funding typically requires 100+ covered lives to carry meaningful claims risk, and 200+ before the economics are compelling without level-funded guardrails.
Cash flow: Can your organization absorb monthly claims variance? Self-funded plans pay claims as incurred; a bad month is a real cash event, not just a future premium increase. Stop-loss reimbursement typically runs 30–90 days after the claim is paid, creating a temporary cash flow gap.
Risk tolerance: Is your leadership prepared for year-to-year cost variability? Self-funding can produce meaningful savings in good years and meaningful overruns in bad ones. The multi-year economics almost always favor self-funding at sufficient scale, but the path is not smooth.
Administrative capacity: Self-funded plans require more active management, including stop-loss renewals, TPA oversight, claims audits, and compliance filings. Your broker or consultant needs to have genuine self-funded expertise, not just familiarity with the concept.
Data readiness: The primary non-financial benefit of self-funding is access to your own claims data. Are you prepared to actually use that data to make plan design decisions? Employers who self-fund without using their claims data are paying for a capability they’re not capturing.
Run-out liability: When leaving a fully insured arrangement, the employer is responsible for claims incurred during the fully insured period but submitted afterward. This run-out must be accounted for in the financial model, it is often the surprise that derails first-year self-funded economics for employers who didn’t plan for it.
If the answers to these questions are uncertain, level-funded is almost always the right first step. It provides the refund upside and data transparency of self-funding with the fixed monthly cost and administrative simplicity of fully insured. For many employers in the 50–250 life range, level-funded is not a stepping stone, it is the right permanent answer.
The Point Is Not Which Model; It’s Whether You Know What You’re In
The most important outcome of understanding plan funding is not deciding to switch models. It is being able to have an informed conversation with your broker, your CFO, and your board about what you’re paying, what you’re getting, and what the alternatives look like.
An employer who has been fully insured for ten years and has never modeled a level-funded alternative does not know what that decision is costing them. An employer who is self-funded but has never analyzed their claims data does not know what that structure is worth. In both cases, the answer starts with a benchmark, knowing where your plan sits relative to employers who actually look like you.
Mployer’s benefits rating evaluates plan funding structure, stop-loss levels, and PMPM costs as part of the Medical pillar score, so employers can see not just what they’re paying, but how that compares to their custom cohort.
June's product updates are here, and there's a lot to be excited about. We're continuing to build on the foundation we've established across Catalyst and Insights benchmarking, with this month's updates focused on giving users more precision in how they search, prospect, and manage data.
On the Catalyst side, that means expanded AI assistant capabilities, more flexible export controls, and deeper CRM customization. For benchmarking, we've added AI-powered recommendations and made meaningful improvements to the report experience, including how you access completed reports and how data flows through the submission wizard.
Read on for the full details.
Catalyst
Proximity-Based Geographic Search — The AI assistant now supports radius-based company searches around a city, so territory prospecting works the way territories actually do — not just by state, city, or zip.
Product Line Gap Queries — Ask the AI assistant which product lines — Stop Loss, EAP, Voluntary, TPA — an employer has or is missing. Cross-sell identification now happens in a conversation, not a spreadsheet.
Headcount Milestone Flags — The AI assistant can surface employers who've recently crossed key thresholds: 50, 100, 500 employees. Growth signals and compliance triggers, surfaced automatically.
Flexible Export Range Selection — When exporting data, users can now choose the current page, a page range, or a specific record count. Providing precise control without bumping into system limits.
Experience Mod Data on Account View — Experience Modification data now appears directly on the Company Overview and Commercial P&C tab, so risk context is right there when you need it.
Custom CRM Field Mapping — Account admins can now map platform fields to custom CRM fields, including custom schemas. Providing full control over how data flows in without overwriting existing records.
Retirement Search: Total Assets Filter — The Retirement Search Assets filter now filters on Total Assets.
Insights+
AI-Powered Recommendations in Insights+ Users can now access AI-generated recommendations directly within Insights+. The new recommendations tool surfaces actionable guidance across four categories. Highest Impact, Cost Strategy, Coverage Gaps, and Underwriter Notes, giving users a faster path from report data to next steps.
Completion Email Links to HTML Report — When your report is ready, the notification email now links directly to the interactive HTML report including Mployer AI and all report tools, instead of a PDF download.
Redesigned Chart Layout — Plan Score and Cohort Market Data sections are now clearly differentiated, and Dental and Vision pages consolidate their left-side tables. Easier to read, faster to interpret.
Report Opens Without Losing Your Place — Clicking a company name in the Request History Grid now opens the HTML report in a new tab, so your search state stays exactly where you left it.
Rate Availability Edits No Longer Clear Rate Data — Adjusting Rate Availability selections mid-wizard no longer wipes Medical, Dental, or Vision rate and contribution data previously entered. No more lost work.
Age-Banded Entry Hidden When Not Applicable — When 'Use employee contributions only' is selected, Age-Banded rate entry is no longer shown — cleaner form, fewer distractions.
That's a wrap! Stay tuned for what's coming next month.
The Tax Advantage Most Employers Are Leaving on the Table
There are very few mechanisms in the U.S. benefits system that are truly triple tax-advantaged. The Health Savings Account is one of them. Contributions go in pre-tax, grow tax-free, and come out tax-free when used for qualified medical expenses. For employers, an HSA is also a funding tool: a way to offset the cost impact of pairing employees with a high-deductible health plan while creating real, measurable value that employees can carry with them.
And yet, only 40% of employers currently offer an HSA. That means six out of ten are not providing access to one of the most tax-efficient benefits tools available; in many cases because they’ve defaulted to a PPO or HMO structure without modeling what a consumer-directed health plan paired with meaningful employer HSA funding would look like competitively.
This is not a promotion for HSAs and HRAs, the only goal is to provide a more detailed understanding of how they work and their adoption to date. This covers what HSAs and related cost-sharing vehicles actually are, how they interact with plan design, what employers are contributing nationally, the key vendors in the space, and what separates employers who use these tools strategically from those who don’t.
HSA, HRA, FSA: What Each One Actually Is
These three accounts are often grouped together but they work very differently. Understanding the distinctions matters before designing a benefits strategy around any of them.
Health Savings Account (HSA)
An HSA is an individually owned, portable savings account available only to employees enrolled in a qualified High-Deductible Health Plan (HDHP). Contributions can come from the employer, the employee, or both, up to IRS annual limits ($4,400 single / $8,750 family for 2026). Funds roll over year to year, can be invested, and remain with the employee if they leave. The triple tax advantage (pre-tax in, tax-free growth, tax-free out for qualified expenses) makes this the most valuable account structure of the three.
Key rules to know:
Must be paired with an IRS-qualified HDHP (2026 minimums: $1,700 single / $3,400 family deductible; OOP maximums: $8,500 single / $17,000 family)
Employee cannot be enrolled in Medicare, claimed as a dependent, or have other disqualifying coverage
Unused funds roll over indefinitely, there is no use-it-or-lose-it provision
After age 65, funds can be withdrawn for any purpose (ordinary income tax applies, like a 401k)
Employer contributions are not subject to payroll tax, a savings of ~7.65% on every dollar contributed
Catch-up contribution for employees age 55+: additional $1,000 per year (unchanged for 2026)
Health Reimbursement Arrangement (HRA)
An HRA is employer-owned and employer-funded. Unlike an HSA, the employee never receives or holds the funds, rather the employer reimburses eligible expenses up to a set annual limit. Unused balances can be carried over at the employer’s discretion or forfeited at year-end. Because the employer retains unused funds, HRAs are particularly attractive for employers who want to offer meaningful financial support to employees while limiting their actual cash outlay to claims incurred.
Key rules to know:
Employer-funded only, employees cannot contribute
Can be paired with any plan type, including PPO and HMO (unlike HSA)
Employer decides what qualifies as a reimbursable expense
ICHRA (Individual Coverage HRA) allows employers to reimburse individual market premiums, a growing alternative to group coverage
Forfeitures return to the employer, making this a lower actual-cost vehicle than the stated contribution amount
Excepted Benefit HRA (EBHRA) limit for 2026: $2,200 per year (up from $2,150 in 2025)
Flexible Spending Account (FSA)
An FSA is an employer-sponsored, employee-funded account for pre-tax healthcare or dependent care expenses. The Healthcare FSA is offered by 51% of employers and is the most widely available of the three accounts. However, the classic “use it or lose it” rule applies: unused funds are generally forfeited at year-end, though employers may allow a grace period or a limited rollover. FSAs can be paired with PPO and HMO plans but cannot be used alongside a standard HSA.
Key rules to know:
Employee-funded via pre-tax payroll deductions (employers may also contribute)
Healthcare FSA 2026 employee contribution limit: $3,300 per employee (unchanged from 2025)
Dependent Care FSA is separate and covers childcare and elder care (46% of employers offer this)
Use-it-or-lose-it: forfeitures stay with the employer unless a rollover or grace period is offered
Limited Purpose FSA can be used alongside an HSA for dental and vision expenses only
How Plan Design and HSA Eligibility Connect
The most important design constraint for employers to understand: an HSA is only available to employees enrolled in a qualified HDHP. That connection makes HDHP plan design decisions and HSA funding strategy inseparable.
Currently, 33% of employees nationally are enrolled in an HDHP/SO plan, compared to 47% in a PPO. HDHP deductibles average $3,460 for single coverage and $8,273 for family, meaningfully higher than PPO averages of $1,857 single and $1,638 family aggregate. For 2026, the IRS minimum HDHP deductible is $1,700 for single coverage and $3,400 for family, with an out-of-pocket maximum of $8,500 single / $17,000 family. That deductible gap is the core employee concern with HDHPs, and it’s precisely where employer HSA contributions come in.
When an employer pairs an HDHP with a meaningful HSA contribution, they are effectively offsetting a portion of the employee’s deductible exposure upfront, making the high-deductible plan significantly more attractive. An employer contributing $458 toward a single employee’s HSA reduces the net deductible that employee faces from $3,460 to roughly $3,000. An employer contributing nothing leaves that gap entirely to the employee, making the HDHP structurally punishing compared to a PPO.
A PPO does not qualify employees for HSA contributions. PPO plans can be paired with an HRA (employer-funded only) or a Healthcare FSA (employee-funded, pre-tax). This is an important distinction for employers offering multiple plan types, the account strategy differs depending on which plan the employee selects.
What Employers Are Actually Contributing: The National Benchmarks
The gap between HSA and HRA employer contribution levels is striking. According to Mployer’s plan data covering 50,000+ employers:
Average employer HSA contribution: $458 for single coverage / $817 for family coverage
Average employer HRA contribution: $1,878 for single coverage / $3,135 for family coverage
Only 40% of employers offer an HSA at all, 60% do not
Healthcare FSA offer rate: 51%
Dependent Care FSA offer rate: 46%
The HRA contribution averages are substantially higher than HSA averages for a structural reason: HRAs are employer-owned accounts, and employers have full control over what is actually paid out. Because forfeitures return to the employer, the stated contribution amount overstates the actual cost. Employers using HRAs strategically understand that the funded amount and the realized cost are different numbers and that gap can be significant depending on utilization patterns.
For employers offering HSAs, the question is not just whether to contribute, but how much. An HSA employer contribution of $0 foregoes payroll tax savings on every dollar that could have been contributed, and removes a key differentiator for employers whose HDHP deductibles are above market. The 2026 IRS maximum contribution is $4,400 for single coverage and $8,750 for family; meaning the average employer contribution of $458 single represents just 10% of what employees could potentially receive tax-free.
Copays, Cost-Sharing, and How They Interact with Account-Based Plans
One of the most common points of confusion for employees, and plan sponsors, is how copays work in the context of HDHPs and HSAs.
In a traditional PPO or HMO, employees typically pay a flat copay at the point of service: $27 for a PCP visit under a PPO, $26 under an HMO, $29 under a POS plan (national averages from Mployer’s data). These copays do not count toward the deductible in most cases and take effect immediately regardless of whether the deductible has been met.
In a true HDHP, IRS rules generally prohibit first-dollar coverage, meaning copays cannot apply before the deductible is met (with limited exceptions for preventive care). The employee pays the full negotiated rate for services until the deductible is satisfied, at which point coinsurance or copays kick in. This is a fundamentally different employee experience, and one that drives the perception that HDHPs are always worse for employees. The reality depends on the employer’s HSA funding strategy and where the employee lands on the utilization curve.
Employer decisions about hospital cost-sharing further shape this picture. For inpatient hospital services under HDHP plans, 70% of employers use copayment structures; for outpatient, 74% use copayments. Under PPO plans, hospital cost-sharing is more evenly split between copayments and coinsurance. These structural choices, combined with deductible levels and HSA funding, determine the real cost experience for employees across plan types.
The Vendor Landscape: Who Administers These Accounts
Setting up and administering HSAs, HRAs, and FSAs requires a third-party administrator. The vendor landscape is well-developed but fragmented, and the right choice depends on employer size, plan complexity, and whether investment options are a priority.
HSA Custodians
Fidelity: the largest HSA provider by assets; no account fees, strong investment options, integrates with payroll
HealthEquity: major HSA custodian with employer-facing administration tools and HDHP carrier partnerships
HSA Bank: bank-based custodian offering FDIC-insured accounts and investment options through TD Ameritrade
Optum Financial: UnitedHealth-owned platform with strong integration into UHC medical plans
WEX Health: multi-account platform covering HSA, HRA, and FSA administration in one system
HRA Administrators
PeopleKeep: specializes in ICHRA and QSEHRA for small and mid-size employers; strong compliance support
Take Command Health: ICHRA-focused platform with employee-facing marketplace integration
Businessolver: enterprise benefits administration platform with integrated HRA management
Most major TPAs (Benefitfocus, bswift) offer HRA administration as part of broader benefits admin
FSA Administrators
WEX: one of the largest FSA administrators; covers Healthcare FSA, Dependent Care FSA, and transit accounts
Flores & Associates: independent FSA/HRA administrator with a strong employer service model
Ameriflex: mid-market focused FSA/HRA/COBRA administrator with a clean debit card experience
PayFlex (Aetna): integrated with Aetna medical plans; common in employer groups already on Aetna
For employers setting up an account-based plan for the first time, the most common path is to start with the HSA or FSA administrator recommended by their medical carrier or broker. While convenient, this is not always the lowest-cost or highest-value option. Employers with self-funded plans or significant HSA-eligible populations should evaluate custodians independently, particularly investment options, account fees, and payroll integration.
How the Strategy Is Evolving
The account-based benefits landscape has expanded meaningfully since 2020. The introduction of ICHRAs (Individual Coverage HRAs) gives employers a new tool: instead of offering a group health plan, they can provide a defined dollar contribution that employees use to purchase individual market coverage. For distributed workforces, part-time heavy employers, or organizations in markets where group plan design is always a compromise, ICHRAs are increasingly worth modeling.
HSAs are also increasingly being positioned as a retirement health savings vehicle. Employees who contribute to an HSA and invest the balance, rather than spending it down each year, can accumulate a meaningful reserve for post-retirement healthcare costs. Fidelity estimates that a 65-year-old couple retiring today will need approximately $315,000 to cover healthcare costs in retirement. An HSA is one of the only accounts that can address that liability with pre-tax dollars.
IRS contribution limits for 2026: $4,400 for self-only HDHP coverage and $8,750 for family coverage, with an additional $1,000 catch-up contribution for those age 55 and older. HDHP minimum deductibles are $1,700 single / $3,400 family, with out-of-pocket maximums of $8,500 single / $17,000 family. Employers who set their HSA contribution strategy once and don’t revisit it annually may be leaving employees with a funding gap as limits increase each year.
Know How Your HSA Strategy Compares
Most employers know what they contribute to an HSA. Few know how that contribution compares to what their peers (same industry, location, and size) are contributing. An employer contributing $200 to a single employee’s HSA may feel like they’re offering something meaningful. Against a cohort where the average is $458, they’re below market in a category employees increasingly compare.
Mployer’s benefits rating evaluates HSA and HRA funding levels as part of the Medical pillar score (alongside deductibles, premiums, and plan design) to show employers exactly where their cost-sharing strategy sits relative to their custom cohort.
The Blind Spot at the Center of Your People Strategy
Benefits are one of the most powerful weapons in your people strategy. Used well, they help you attract candidates who would otherwise choose a competitor, retain employees who might otherwise leave, and signal to your workforce that you’re invested in them beyond the paycheck. Used poorly, or just blindly, they drain budget without delivering on any of those goals.
Here’s the uncomfortable truth: most employers are using this weapon without knowing if it’s loaded.
According to the U.S. Bureau of Labor Statistics, benefits represent nearly 30 cents of every compensation dollar for private industry employers — $13.79 per hour worked, against $32.36 in wages. For a company with 200 employees, that’s often $3 million or more in annual benefits spend. Yet almost no employer can answer the most basic strategic question about that investment: are we contributing too much, too little, or exactly right to achieve our people goals?
Are you overspending on a medical plan that employees don’t value relative to peers? Underspending on leave in a market where competitors have pulled ahead? Offering a life insurance benefit that looks generous on paper but ranks below market against companies actually competing with you for talent? Without a true benchmark, you don’t know. And without knowing, you can’t make a strategic decision, you can only make an annual one.
Why Accurate Benefits Benchmarks Are Hard to Come By
Getting a meaningful benefits benchmark is genuinely difficult, even for the best brokers in the market. The challenge isn’t effort or intent. It’s data. The two most commonly cited industry sources, Mercer and Kaiser, each contain approximately 2,000 employer plans distributed across eight major industries. Filter further by region and company size, the only way to get a more accurate comparison, and you’re benchmarking against five or six peers.
That’s not a benchmark. That’s a conversation at a conference.
The best brokers know this, and they look for better data. Mployer aggregates and rates benefit plans for over 75,000 employers, drawing from direct employer surveys, broker-shared plans, public filings, and claims data. That’s the sample size required to build a custom cohort that actually reflects your market: your industry, your region, your size. Not a national average. Not an approximation. A real peer group.
Every Benefits Package Falls on a Bell Curve
Benefits competitiveness follows a normal distribution. When you plot tens of thousands of employer plans against each other, a bell curve emerges, and every employer lands somewhere on it.
Mployer rates plans across five tiers:
Top Benefits — An elite package surpassing industry standards. Strong retention and recruitment tool, though likely at a higher cost to the employer.
Market Leading — Materially above market. Demonstrates a meaningful commitment to employee well-being.
Market Competitive — Solid, in line with industry norms. Balances employee needs with cost.
Below Market — Modest compared to peers. May create headwinds in recruiting.
Market Laggard — Below industry norms. Employers here will face measurable challenges retaining and attracting talent.
Like any bell curve, employers are distributed across all five tiers — from those offering standout packages to those with room to grow. The question isn’t which tier you hope you’re in. It’s which tier you’re actually in.
Our Plan Evaluation Methodology
Mployer aggregates employer investment and scores across four pillars of your benefits package, combining them into an overall rating benchmarked against your custom cohort.
Medical — Your largest cost driver.
Monthly premium (single and family), employer contribution percentage, deductible (single and family), maximum out-of-pocket, HSA/HRA employer contribution, plan type mix (PPO, HDHP, HMO, POS), and funding structure (fully insured, level-funded, or self-funded).
Ancillary — The supporting benefits employees notice more than employers think.
Dental offer rate and employer contribution percentage, vision offer rate and contribution, life insurance as a multiple of salary, short-term disability percentage of salary and maximum weekly benefit, and long-term disability percentage of salary and maximum monthly benefit.
Leave — Increasingly a deciding factor for candidates.
Total vacation days by tenure, paid sick days, paid holidays, parental leave (birth and non-birth parent), paid family leave, and flexible or remote work availability.
Retirement — A long-term signal of how much you invest in your people.
401(k) offer rate, employer match percentage, vesting schedule, auto-enrollment, and auto-escalation features.
Each data point is measured against employers who look like you. A PPO deductible that’s competitive for a technology company on the West Coast may be below market for a manufacturing company in the Midwest. Context is everything. National averages erase it.
Your Employees Are Watching
More than half of employees (57%) say they would leave their current job for one with better benefits. Nearly one in three say they would accept lower pay in exchange for a richer benefits package. These aren’t survey artifacts — they show up in time-to-fill metrics, turnover rates, and exit interview data.
Benefits aren’t soft. The cost of a mis-positioned benefits package shows up on your income statement — in recruiting fees, onboarding time, and lost productivity. It just rarely gets traced back to the source.
Know Where You Stand. Put It to Work.
Thousands of employers — from growing mid-size companies to large national organizations — use Mployer to rate their benefits package and understand exactly where they stand. The rating is free, covers all four pillars, and is built against a cohort matched to your industry, region, and size.
Employers who receive a Market Competitive, Market Leading, or Top Benefits rating gain access to a suite of ready-to-use recognition materials: offer letter language, employee-facing benefits guides, social media assets, and digital badges for careers pages and job postings. Independent validation of your benefits quality is a recruiting signal that most employers don’t have — and the data shows what happens when they use it: 9x more candidates when the rating is included in job postings, 25% faster time-to-fill, and 15% lower voluntary turnover.
Employers with room to improve get something equally valuable: a precise, pillar-by-pillar picture of what’s affecting their score and where a targeted investment would move the needle most.
Either way, you leave knowing something most employers don’t: exactly where you stand.
Sources
U.S. Bureau of Labor Statistics, Employer Costs for Employee Compensation, December 2025.
Mployer 2025 and 2026 Employee Benefit Plan Design Study, covering 50,000+ employer plans.
We're excited to share details on the new enhancements and features added to Catalyst and Insights/Insights+ this month. Every update we make is grounded in feedback from our users. Whether you're prospecting for new accounts, managing an existing book, or benchmarking benefits for a client, there's something meaningful here for you.
Catch up on all the new features and updates:
Catalyst
Microsoft Dynamics 365 Integration — Brokers using Microsoft Dynamics can now push companies and contacts directly from Catalyst into their CRM, consistent with the existing Salesforce and HubSpot workflows.
Construction Risk Data — Commercial Search now includes property-level Construction Risk intelligence within the employer snapshot, covering building details, valuation, location, and sales history, with a dedicated summary section for quick risk assessment.
Expanded Alert Triggers — Alert notifications now cover job changes, broker and carrier changes, renewal dates, and retention risk signals.
For You Page Personalization — You can now set location, industry, and company size preferences, so relevant searches are surfaced immediately on login.
Salesforce ID Matching — The Salesforce integration now supports matching Salesforce ID fields, improving sync accuracy and reducing duplicate records.
Opportunity & Signals Enhancements — The Opportunity & Signals tab now includes broker and carrier tenure flags, premium and commission trends with year-over-year comparisons, and enrollment changes drawn from 5500 filing data.
State Legislative Activity in Pulse — The Pulse news feed now surfaces state legislative bill activity, keeping users informed of policy developments relevant to their prospects and clients.
Employer Search Filter Additions — Employer Search now includes filters for Broker Compensation, Premium Range, and Missing Filings.
OSHA Risk Rating Filter — You can now filter Commercial P&C employers by OSHA Risk Rating, from Very Low to Very High, for faster compliance-based targeting.
LinkedIn Fallback Search — When a contact has no personal LinkedIn profile on file, clicking the LinkedIn icon now opens a people search filtered by company and last name.
Snapshot PDF Exports Include Phone Numbers — Revealed phone numbers now appear in the Key Contacts section of exported PDFs, with the most reachable contacts prioritized at the top.
Consolidated Settings Page — Account, company, and preference settings have been merged into a single Settings page for easier profile management.
Redesigned Dashboard and Portal Home — Both the Catalyst dashboard and portal home page have been refreshed with cleaner layouts, surfacing recent activity and making navigation faster from login.
Insights/Insights+
Flexible Rate Availability in Request Form — The Insights+ request form now supports a flexible Rate Availability section, allowing you to choose between full premium and contribution data, benchmark rates, or employee-paid premiums only — so submissions are no longer blocked when full rate data isn't available.
Two-Tier Rate Structure Support — Insights+ now supports a two-tier rate structure (EE and EE+Family) in addition to the existing three- and four-tier options.
Five New Voluntary Benefit Lines — Hospital Indemnity, Cancer Insurance, Pet Insurance, Student Loan Assistance, and FSA have been added to the Voluntary Offerings section.
Medical Plan Reordering and Deletion — You can now drag and reorder medical plans within the Insights+ side stepper and delete plans with a confirmation prompt, with all changes reflected consistently across the stepper, plan detail screens, and final submission.
Award Download Progress Modal — A new progress modal now appears when downloading award files, providing visual confirmation that the file is being prepared and preventing duplicate clicks during packaging.
Refreshed Insights Home Page — The Insights home page has been updated with a cleaner layout and improved search helper text.
Improved Form Validation — The Insights+ wizard now validates employer contribution amounts against total premiums to prevent percentages from exceeding 100%, caps the Aggregate Risk Corridor field to prevent data entry errors, and routes brokers directly to flagged sections when errors are identified on review or submit.
Hyperlinked Company Names in Report History — Company names on the Insights Report History grid are now hyperlinked, making it faster to navigate from a report row directly to the relevant company.
That's a wrap! Stay tuned for what's coming next month.
Selection Sunday has just wrapped up. Brackets are officially out. March Madness has always been one of the few moments where everyone at work — finance, sales, HR, leadership — is talking about the same thing. And this year we thought: why not make it a little more meaningful for the HR and employer community?
So we launched the Mployer $1M Bracket Challenge and we want to give it to you.
It’s simple. Join our private ESPN group, submit your bracket, and follow along with weekly leaderboard updates.
If someone, somehow picks a perfect bracket, Mployer will contribute $1 million toward that person’s company employee benefits.
And if no one nails perfection, the best overall bracket still wins $1,000.
This isn’t meant to be serious. It’s meant to be fun. But it does highlight something that is very real for employers right now.
Employee benefits costs keep climbing. Across the U.S., employer health costs continue to rise faster than inflation and wages. The average cost of employer-sponsored health insurance now exceeds $17,000 per employee per year according to recent employer surveys. (Mercer)
Family coverage is even more dramatic. The average annual premium for employer-sponsored family coverage reached nearly $27,000 in 2025, with employers covering the majority of that cost. (KFF Files)
And the trend isn’t slowing down. Many employers are projecting health plan cost increases of roughly 8%+ in the coming year, some of the steepest growth seen in more than a decade. (Mercer)
For HR leaders and benefit teams, that reality shows up every year during renewal season.
How do you keep offering competitive benefits?
How do you protect employees from rising out-of-pocket costs?
How do you design plans that actually support your people strategy while managing budgets that keep expanding?
That’s the problem Mployer exists to help solve.
Our goal is to create more transparency for employers into their benefit plans so they can lower costs and design plans that better support their people strategy.
But sometimes it’s also good to step back and do something that simply brings the employer community together.
That’s what this bracket challenge is about.
It’s a chance for HR leaders, benefits teams, and employers across the country to join the same pool, follow the same leaderboard, and root for their picks together during one of the most fun sports tournaments of the year.
And who knows, maybe someone in HR finally cracks the code and picks the perfect bracket.
If that happens, we’ll happily write the $1M contribution toward their company’s employee benefits.
Until then, we’ll be watching the leaderboard every day with everyone else.
If you’re an employer, join the challenge and submit your bracket.
One bracket per person. Unlimited participation per company.
We are hoping your bracket is the one that prevails!
In a labor market shaped by rising healthcare costs, changing workforce expectations, and increased transparency, employers are under pressure to offer programs that truly support their people.
That’s exactly why the Mployer Benefits Award exists.
The award isn’t based on opinions, sponsorships, or self-reported marketing claims. It’s built on independent data, consistent scoring, and a clear definition of what “great benefits” actually look like in today’s market.
This post pulls back the curtain on:
How Mployer determines top-tier benefits
What happens behind the scenes in scoring
Why independent validation matters for employers
How Mployer Determines Top-Tier Benefits
At the core of the Benefit Award is a simple principle: great benefits should be measurable.
Mployer evaluates employer-sponsored health plans using the largest, independent dataset available that reflects real plan design, cost structures, and coverage value across the market. Instead of relying on surveys or subjective rankings, the methodology compares each employer’s offering directly against relevant peers.
This allows Mployer to answer critical questions like:
How competitive is this plan compared to similar employers?
Are employees receiving meaningful financial protection?
Does the structure promote long-term affordability and access to care?
Employers who earn Gold or Platinum recognition aren’t just “good for their size.” They are delivering objectively strong value within their competitive landscape.
Behind the Scenes: From Data to Recognition
Behind every Mployer Benefits Award is a structured, data-driven evaluation designed to turn complex benefit information into clear, trustworthy recognition.
The process begins with real plan data by analyzing cost structures, coverage value, and employer investment across a large independent market dataset. Each employer’s benefits are then compared against relevant peers to determine how their offering truly performs in context, not just in isolation.
From there, Mployer applies a standardized scoring model that translates plan performance into an objective, comparable result. This ensures that recognition reflects measurable value delivered to employees, rather than marketing claims or subjective interpretation.
The final award levels are intentionally simple:
Gold recognizes employers delivering strong, competitive benefits that meaningfully outperform many peers.
Platinum represents the highest tier of benefits that provide exceptional value, protection, and investment relative to the market.
What makes this approach unique is its consistency. Every employer is evaluated using the same methodology, the same benchmarks, and the same independent data foundation.
The outcome is recognition employers, employees, and partners can trust because it’s earned through performance, not participation.
Why Independent Validation Matters
For years, employers have had limited ways to prove the strength of their benefits.
Most recognition programs are:
Self-submitted
Survey-based
Influenced by sponsorships or marketing participation
Mployer’s Benefits Award is different because it is independently calculated using real market data.
The Business Impact for Employers
Independent validation isn’t just about recognition, it delivers real strategic value.
Talent Attraction & Retention
Candidates increasingly ask: “How good are our benefits really?”
An objective award provides instant credibility and differentiation in a competitive hiring market.
Broker & Partner Alignment
Recognition signals that an employer’s benefits strategy is working, which strengthens relationships with advisors, carriers, and leadership stakeholders.
Confidence in Investment Decisions
Healthcare spending is one of the largest line items for employers. Independent scoring confirms whether that investment is translating into meaningful value for employees.
Raising the Standard for Employee Benefits
The broader mission behind the Mployer Benefits Award is simple: bring transparency and accountability to the benefits market.
When employers can clearly see how their plans compare, the entire system improves.
Better benchmarking leads to:
Smarter plan design
More efficient spending
Stronger employee outcomes
Recognition is just the visible result of a much bigger goal: making high-quality benefits the norm, not the exception.
See Where Your Benefits Stand
Whether an employer earns Gold, Platinum, or is still improving, the most important outcome is clarity. Because once you can measure benefits objectively, you can make them better.
Upload you plan documents to get your free benefit rating here: https://portal.mployeradvisor.com/employerprocess
We’re excited to share the latest updates to Insights and Insights+ for 2026. Each year, we take partner feedback and turn it into meaningful improvements to our benchmarking tools, and this year is no exception.
This year’s enhancements reflect exactly what you’ve been asking for: more granular benchmarking options, expanded coverage across emerging benefit areas, and deeper comparisons that strengthen your client conversations. These aren’t just new features; they’re tools designed to help you win more business, advise with greater confidence, and support every recommendation with the most accurate data available.
We’re proud of these new enhancements, and we’re just getting started. There’s much more coming throughout the year as we continue investing in making Insights and Insights+ the most powerful benchmarking resources available.
Here’s what’s new:
Insights+
More granular employer size benchmarking options, expanding from the previous size groupings (100–499 and 500+) to:
100–249
250–499
500–999
1,000+
New 3-tier and 4-tier rate + contribution benchmarking
4-tier: Employee / Employee + Spouse / Employee + Children / Employee + Family
3-tier: Employee / Employee + Dependent / Employee + Family
View Insights+ reports directly inside your portal, making it easier to navigate, analyze, edit, and share instantly with colleagues and clients.
AI-Powered Benefits Assistant — You can now ask plain-language questions about your clients' benefits data and reports directly getting instant, accurate answers without digging through pages of data manually.
The Benefits Award is now part of every Broker's Toolkit
After watching thousands of employers earn recognition through the program, we decided the award should be a standard part of every broker's toolkit. If your client qualifies, the badge and core award components are now available to instantly download, share, and celebrate with your client.
Insights
Expanded benchmarking for alternative benefit delivery methods, including:
Firm-paid through reference-based pricing
Narrow network plans
Direct primary care (DPC)
Specialty provider networks
New data visibility into waiting periods
New menopause care reporting
Ancillary lines split into dedicated pages for clearer benchmarking and navigation:
Dental
Vision
Disability
Life Insurance
Carrier market share visibility added to each page
Shows top carriers by market share based on the selected region
New dental benchmarking metric: orthodontia (ortho) maximums
New vision benchmarking metric: percentiles for max reimbursement
As Mployer continues to grow, our visual presence needs to grow with it. For 2026, we redesigned our award badges to better reflect the credibility and trust behind the recognition they represent. The new designs use Platinum and Gold to add hierarchy and clearly differentiate rankings at a glance, making them easier to understand and more effective in real-world use. The result is a cleaner, more premium look that reinforces the value of the data and insights behind every badge.
The new badge design is part of a broader effort to create a more cohesive Mployer brand. As our platform, reports, and Insights+ offerings continue to evolve, it’s important that every touchpoint feels connected and intentional. These badges now align more closely with our overall visual system, reinforcing recognition and trust wherever Mployer appears.
While the look of the badges has evolved, the foundation behind them has not. The methodology, data quality, and standards used to determine each award remain exactly the same, and the definitions of “Great” and “Top” categories are unchanged. The redesign simply brings the visual expression of the award in line with the rigor and credibility that have always defined Mployer recognition.
A Quick Reminder: What Mployer Awards Measure
Every Mployer award is rooted in independent, data-driven benchmarking.
We evaluate an employer’s full benefits investment, not just medical coverage. That includes:
Medical plans
Ancillary benefits (dental, vision, life, disability, and more)
Leave and PTO
Retirement benefits
Each plan is benchmarked against a custom cohort of similar employers, matched by:
Industry
Company size
Geography (region and state)
From there, plans are force-ranked to determine where they truly sit in the market - no surveys, no opinions, no pay bias.
This allows us to answer a simple but powerful question:
How strong are your benefits compared to employers like you?
Introducing New Tiers: Gold and Platinum
With the badge update, we wanted the visual system to match how people already think about excellence.
That’s why we now use:
Gold to represent Market-Leading and Market-Competitive Benefits
Platinum to represent Top Benefits
Here’s what that means in practice.
Gold: Great Benefits (Market-Leading and Market-Competitive)
A Gold badge signifies that an employer’s benefits are materially above market.
These organizations:
Intentionally invest more than peers in benefits
Offer strong, well-rounded plans across multiple categories
Use benefits as a competitive advantage for hiring and retention
Platinum: Top Benefits
Platinum is reserved for the very top of the market.
Employers earning a Platinum badge:
Rank at the highest end of their peer group
Offer exceptionally rich, comprehensive benefits
Often exceed industry norms across medical, leave, and retirement
Treat benefits as a long-term investment in people
Why This Matters
Benefits are hard to explain, and even harder for employees and candidates to compare.
Our updated badges are designed to:
Instantly communicate where your benefits stand
Reinforce trust through independent validation
Make benefits easier to talk about internally and externally
Help employers show that they invest in their people
The redesign prioritizes clarity and legibility across all of these environments, ensuring the badge reads quickly and holds its credibility whether it’s seen on a website, in a LinkedIn post, or embedded in a presentation.
Hiring has never been cheap. But for many organizations today, it has quietly become far more expensive than traditional recruiting metrics suggest.
Most companies track time-to-fill and cost-per-hire. These metrics are familiar, easy to report, and widely benchmarked. What they don’t capture is the full organizational cost of an open or recently filled role — and how benefit perception, retention, and productivity are deeply tied to that number.
When recruiting effort, productivity loss, onboarding time, and early turnover risk are fully considered, the true cost of hiring for professional roles often reaches $80,000 to $90,000 per hire. For many HR and finance leaders, that figure is surprising. The reality is that most hiring models are incomplete by design.
Why Traditional Cost-Per-Hire Models Underestimate Hiring Costs
Cost-per-hire calculations typically focus on direct expenses. Recruiter fees, job advertising, background checks, and onboarding costs are straightforward to track and easy to justify in a budget review.
The problem is that these line items represent only a fraction of the total impact.
The largest drivers of hiring cost tend to be indirect and dispersed across the organization. Extended vacancies delay output. Teams redistribute work, creating burnout and inefficiency. Managers spend time filling gaps instead of driving strategic initiatives. New hires take months to reach full productivity. And roles filled under pressure carry a higher likelihood of early turnover.
When these factors are included, organizations frequently underestimate the true cost of hiring by 30 to 50 percent. The impact rarely appears as a single expense line. Instead, it shows up as slower execution, missed growth opportunities, and persistent retention challenges.
Time-to-Fill Is a Compounding Business Cost
Time-to-fill is often treated as a static recruiting metric — something to optimize, but not something that actively accumulates cost. In reality, every day a role remains open increases organizational drag.
Across industries, typical time-to-fill ranges look like this:
Administrative roles: 20–40 days
Professional and technical roles: 40–60 days
Senior leadership roles: 60–90+ days
During that time, work doesn’t disappear. Output is delayed or redistributed. Overtime increases. Manager attention shifts away from growth initiatives. Team velocity slows. These effects compound quietly, making vacancies far more expensive than they appear on paper.
Once a role is filled, the cost accumulation doesn’t stop. Onboarding and ramp-up often extend the total time-to-productivity window to 90 to 180 days. Until that point, teams continue to operate below capacity.
This is how a role with a $120,000 salary can translate into an $80,000 or greater organizational cost, even before factoring in turnover risk.
Early Turnover Magnifies Hiring Costs
Turnover inside the first 12 months is one of the most expensive and least visible hiring failures. The costs are rarely isolated or formally reported, yet the impact is significant.
When an employee leaves early, the organization absorbs:
The full recruiting cost again
Another vacancy period
A second ramp-up cycle
Lost institutional knowledge
Reduced team morale
Early turnover effectively doubles many of the hidden costs associated with hiring. It also creates skepticism around recruiting effectiveness, even when the underlying issue isn’t talent quality.
In many cases, the root cause isn’t compensation or role mismatch. It’s misaligned expectations and poor understanding of total rewards.
Benefits Play a Bigger Role in Retention Than Most Companies Realize
Benefits consistently rank as the second most important reason employees stay with or leave an employer, yet they are one of the most misunderstood components of total compensation.
Research shows that employees undervalue their benefits by nearly 50 percent. When employees don’t understand the value of what they receive, even strong benefit plans fail to influence retention, recruiting conversations, or offer acceptance decisions.
This disconnect has tangible consequences. Employees who underestimate their benefits are more likely to explore external opportunities. Candidates hesitate during offer negotiations. Hiring cycles lengthen. Time-to-fill increases.
None of this requires increasing benefit spend. It requires credible context.
Why Total Compensation Statements Rarely Change Behavior
Most organizations rely on total compensation statements to communicate benefits value. While well-intentioned, these statements often fail to change perception or behavior.
The reason is simple: information alone does not create credibility.
Employees are not asking how much their employer spends. They are asking whether their benefits are competitive compared to peers. Without external context, internal summaries and dollar totals feel abstract and unconvincing.
Effective benefits communication requires three elements:
Peer-aligned benchmarks
Independent validation
Clear, easy-to-understand scoring
Without these, even objectively competitive plans are perceived as average, or worse.
The Problem With Most Benefits Benchmarking
Many employers attempt to solve this gap with benchmarking. Unfortunately, most benchmarking tools introduce new problems.
Broker-aligned benchmarks reflect the book of business they support. Carrier-driven data emphasizes product placement. Self-reported surveys lack consistency and comparability. As a result, employers struggle to trust the results or use them confidently in internal conversations.
When benchmarking lacks independence, it fails to provide the credibility employees and leaders are seeking.
Independent Benefits Benchmarking: A Clearer Way Forward
Independent benefits benchmarking changes the conversation. Instead of focusing on plan design alone, it answers a more relevant question:
How does our benefits package actually compare to employers like us?
Mployer provides the only independent benefits benchmarking in the U.S., free from broker or carrier influence. Organizations use it to identify retention risk, improve benefit perception without increasing spend, support recruiting narratives, and assess eligibility for the Mployer Benefit Award.
The results are often eye-opening, particularly for companies that believe their benefits are “about average.” In many cases, the data reveals hidden strengths that simply weren’t being communicated effectively.
What This Means for HR, Total Rewards, and Finance Leaders
Rising hiring costs, extended time-to-fill, and persistent turnover are rarely isolated problems. They are symptoms of broader gaps in how organizations position, communicate, and validate their total rewards strategy.
Benefits are not just an expense line. They are a lever for retention, recruiting efficiency, and productivity — when employees understand their value and trust the comparison.
A short benchmarking conversation can help clarify where your benefits truly stand, how employees likely perceive them, and whether your organization qualifies for independent benchmarking and the Mployer Benefit Award.
The labor market remains highly competitive, particularly for skilled and high-performing roles. Despite some macroeconomic cooling, the structural shortage of qualified talent persists: nearly three-quarters of employers continue to report difficulty filling key positions. At the same time, employee expectations have evolved — flexibility, security, and well-being now weigh as heavily as base compensation in determining employer preference.
For most organizations, benefits represent one of the largest investments in the total rewards portfolio. Yet in practice, those investments are often under-leveraged in the recruiting process. Health coverage, retirement plans, paid time off, and wellness programs frequently appear as a brief bullet point in job descriptions or are mentioned only when an offer is extended. By that stage, the opportunity to differentiate has largely passed.
Mployer’s recent survey of more than 700 companies across 17 industries found that employers who clearly communicate the value of their benefits — and substantiate that value through credible data or recognition — are nine times more likely to be selected by candidates and to convert accepted offers. Transparency and validation drive both higher-quality applicant flow and stronger offer acceptance rates.
Transparency Converts Interest Into Action
In a competitive market, candidates are no longer applying indiscriminately. They evaluate prospective employers through publicly available information, reviews, and visible signals of value. When benefit information is vague, candidates interpret that as a risk. “Competitive benefits” have become shorthand for “average,” and uncertainty creates hesitation.
Conversely, when an organization provides a clear, quantified, and credible overview of its benefits, the dynamic changes immediately. Candidates are more willing to engage early, stay active through the interview process, and make faster, more confident decisions.
89% of candidates say they are more likely to apply when an employer provides clear benefit details.
90% say they are more likely to accept a role when benefits have been recognized or benchmarked externally.
Clarity reduces friction. It replaces speculation with understanding and shifts the employer-candidate relationship from negotiation to alignment.
The Missed Opportunity: The Awkward Offer Conversation
In many recruiting processes today, the discussion around benefits occurs only after a verbal or written offer is made. The exchange is familiar: the candidate receives the offer, reviews the salary, and then pauses at the benefits section — uncertain whether what’s being offered is “good” or “below market.”
Recruiters often find themselves attempting to explain why the plan is competitive, citing anecdotal points about employer contributions or coverage levels. But without comparative data, the explanation sounds defensive, not differentiating. The candidate may nod politely but remain unconvinced — or worse, use the ambiguity to negotiate or delay.
At that stage, the opportunity to use benefits as a selling point has already been lost. The employer is reacting rather than leading.
In contrast, organizations that proactively communicate the strength of their benefits — in quantitative and comparative terms — enter offer discussions from a position of confidence. The candidate already understands the total value being provided and perceives the offer as comprehensive, not partial.
This is the distinction between defending your benefits and leveraging them. One undermines momentum; the other accelerates decisions.
Making Benefits a Strategic Differentiator
Leading employers are now approaching benefits communication as a core component of their talent strategy — not an HR formality. Several best practices have emerged:
Integrate Benefits Early in the Candidate Journey Incorporate concise benefit summaries directly into job descriptions, career pages, and early-stage recruiting materials. Candidates should understand your total rewards value before they ever meet a recruiter.
Quantify Total Rewards Clearly Provide a simple, high-level estimate of annual benefit value. For example, “This role includes approximately $18,000 in annual benefit value beyond base salary.” Quantification allows candidates to make informed, apples-to-apples comparisons across competing offers.
Leverage Third-Party Validation External benchmarks and awards give candidates confidence that your benefits are not only competitive, but verified. Independent recognition communicates quality far more effectively than internal claims.
Equip Recruiters with Data Provide recruiters with accessible talking points and benchmark comparisons. When recruiters can articulate specifics — not generalities — they move from explaining to demonstrating.
These practices shorten time-to-hire, increase offer acceptance rates, and strengthen employer brand equity in measurable ways.
From Hidden Cost to Competitive Advantage
For many organizations, benefits are treated primarily as a cost center — a compliance requirement and a necessary expense. In reality, they are one of the most powerful levers available for talent attraction and retention.
When the value of those benefits is communicated with clarity, evidence, and confidence, the perception shifts. The benefits package becomes part of the employer’s market narrative — a tangible signal of how the company invests in its people.
In a tight labor market, that clarity doesn’t just help you attract candidates; it helps you close them.
How Mployer Enables Employers to Compete
Mployer helps organizations turn their benefits into a verified strategic advantage. We independently evaluate and rate employee benefit plans, comparing them across thousands of employers nationwide.
Participating organizations receive a clear assessment of how their benefits stack up against peers, along with recognition materials and benchmarking insights that can be shared directly with candidates. These assets — digital badges, comparison visuals, and concise summaries — give recruiting teams the ability to communicate benefit value credibly and consistently.
Employers across the country are already using Mployer’s data-driven validation to increase applicant volume, improve offer acceptance rates, and reinforce their reputation as employers of choice.
If you’d like to see how your benefits compare, we offer a free initial benchmark report to qualified employers. Join thousands of organizations already leveraging independent proof to strengthen their talent strategy — and move from explaining your benefits to winning with them.
In today’s hyper-competitive labor market, the fight for high-end talent has become a defining business challenge. Organizations invest significant resources into hiring and developing high- performing employees—only to lose them to competitors offering slightly higher pay or better benefits. The cost of voluntary turnover is not only financial; it disrupts operations, damages customer relationships, and erodes company culture.This white paper explores how offering market-competitive benefits—and communicating them effectively—dramatically reduces voluntary turnover. Backed by Mployer’s proprietary benchmarking and benefit rating data, we’ll show how employers that promote their benefits will experience on average 27% lower voluntary turnover each year and potentially up to 51% lower annual turnover compared to peers.
The Cost of Losing Great Talent
Every HR leader and CFO understands the financial cost of turnover—but few quantify its full scope. When an employee leaves voluntarily, costs include:
• Recruiting and onboarding new talent (often 30–50% of annual salary)
• Lost productivity during ramp-up and training
• Knowledge drain, as institutional know-how walks out the door
• Team disruption and morale impacts
• Customer relationship risks when account-facing employees depart
For specialized or customer-integrated roles, this loss compounds. A trained employee with both technical knowledge and deep integration into your teams and clients is a valuable asset—one not easily replaced. Studies show total turnover costs can exceed 1.5x–2x the employee’s annual salary for mid-level positions.
The Talent War: Competing Beyond Compensation
Across industries, the labor market remains tight. Wage competition has intensified, especially in sectors where every dollar per hour matters—manufacturing, wholesale trade, and financial services among them. Employees are increasingly willing to move for small pay increases, unless they clearly understand the total value of their benefits package.This is where benefit perception and communication become critical. When employees can see and understand the full value of what you provide—healthcare coverage, retirement matching, paid leave, mental health support—they’re less likely to be swayed by modest salary increases elsewhere. In short, benefits visibility equals retention power.
The Data: Better Benefits, Better Retention
Mployer Advisor’s analysis found that companies with highly rated benefits and effective benefits communication experience an average of 27% lower voluntary turnover than their peers. That’s a significant impact—one that directly translates into stronger productivity, reduced recruiting costs, and better workforce stability.How We Measured It: To understand how benefits quality and communication influence retention, Mployer Advisor conducted a cross-industry analysis using a blended methodology:
• Sample Group: Thousands of U.S. employers across key industries were evaluated, each with at least 50 full-time employees.
• Benefit Quality Scoring: Companies were benchmarked using Mployer’s proprietary benefit rating system, which integrates multiple data sources—including public ratings, plan benchmarking data, and employee feedback metrics.
• Communication Effectiveness: We measured not just the quality of benefits offered, but how clearly and frequently those benefits were communicated to employees through internal channels, digital materials, and recognition programs.
• Turnover Tracking: Over a 12-month period, we compared voluntary turnover rates among high-rated employers versus industry averages, focusing on trained, professional employees who had completed at least one year of tenure.The outcome was consistent and striking across every major sector: employers who both provide strong benefits and communicate them effectively retain significantly more of their trained workforce.
What this means in Practice - Let's put these numbers into context:
• Example 1: Mid-Sized Manufacturing Firm (200 Employees) Suppose a manufacturing company employs 200 workers with an annual average salary of $60,000 and a typical voluntary turnover rate of 20%. That’s 40 employees leaving each year. Replacing and retraining them at a conservative cost of 1.5× salary would total $3.6 million annually. With improved benefits communication and recognition, this firm could reduce its turnover by 44%—down to 22 separations a year—saving over $1.6 million annually in direct and indirect costs.
• Example 2: Growth-Stage Tech Company (50 Employees) A 50-person software firm might see a 25% voluntary turnover rate in a competitive labor market. Replacing those 12–13 employees could cost roughly $25,000 each in lost productivity and recruiting, totaling $300,000 per year. By improving benefits visibility and achieving results similar to the 27% national average reduction, the company could retain an additional 3–4 key employees annually—saving $75,000–$100,000 and preserving critical institutional knowledge.
The data and the dollars tell the same story: when employees both receive and recognize valuable benefits, they stay longer. Employers who treat benefits as a strategic investment—not just a line-item cost—achieve stronger retention, higher engagement, and measurable savings year over year.
Why Communication Matters as Much as the Benefits Themselves
Even the most generous benefits package fails to deliver ROI if employees don’t fully understand it. HR leaders often underestimate how little employees know about their coverage and perks. A recent survey found that:
• 46% of employees cannot accurately describe their health plan’s core benefits.
• Only 35% believe their employer communicates benefits “very effectively.”
• Yet 68% say that well-communicated benefits would increase their loyalty to the company.
Communicating benefits is no longer a once-a-year open enrollment exercise. It’s a year-round engagement effort that connects the dots between employee well-being and company investment.
Turning Benefits into a Competitive Advantage
This is where the Mployer Benefit Recognition Program makes the difference.
Through our Employer Benefit Award and recognition system, Mployer provides third-party validation that your benefits are not only competitive—but also worthy of public recognition.
Participating employers receive:
• An unbiased benefits rating benchmarked against industry peers
• A benefit summary report highlighting your strongest advantages
• Award badges and recognition toolkit providing third-party credibility for your website, social media, and recruitment materials
• Ready-to-use social media templates to promote your benefits on LinkedIn and beyond
• A visually striking award poster to display on-site, sparking employee conversations about the value of your benefits
By leveraging Mployer’s independent credibility, employers transform their benefits from a hidden cost center into a visible differentiator—enhancing recruitment, retention, and brand perception simultaneously.
Retention Starts with Recognition
In an era defined by labor shortages and rising turnover costs, the companies that win will be those that treat employee benefits not as an expense, but as a strategic investment.
The data tells the story: organizations that both offer competitive benefits and communicate them effectively enjoy up to half the turnover rates of their peers. Recognition, transparency, and consistent messaging are key to helping employees see the true value of what you provide.
Your workforce is your most valuable asset. Make sure they know how much they’re worth.
Learn more or see if your company qualifies for an Employer Benefit Award by visiting Mployer.
The modern labor market is defined by choice. In this competitive landscape, the time it takes to fill a critical position—your Time to Fill (TTF)—has become a painful metric. TTF measures the days between when a job is posted and when an offer is accepted, and every extra day costs your business. These are not just abstract numbers; they are tangible losses: decreased productivity from overburdened teams, halted projects, missed revenue targets, and increased recruiting fees (Source 1).
The solution to a high TTF doesn't lie solely in higher base salaries or aggressive sourcing. It lies in your benefits package.
Exceptional benefits are no longer a perk; they are the most efficient talent acquisition strategy to drastically reduce TTF. By treating your benefits package as a competitive differentiator, you can accelerate candidates through the hiring pipeline faster, saving thousands in the process.
The compounding financial cost of every day an essential role remains unfilled. Reducing TTF by just two weeks can save the organization thousands in lost revenue and overhead.
The Attraction Phase: Benefits as a Candidate Magnet
In the crowded digital space, a candidate's first interaction with your company is often filtering for what matters most to their life. This is where your benefits package first accelerates the process.
Filter Efficiency and Signal Quality
Candidates actively use benefit offerings as a primary search filter on major job boards. By offering superior benefits, your role gains instant visibility among highly qualified candidates who are explicitly looking for employer support.
Furthermore, a robust benefits package serves as a powerful signal quality indicator. It immediately tells a prospective hire that your company is stable, healthy, and genuinely employee-first. This signals a positive company culture, immediately making your job more attractive than competitors offering standard, minimal coverage.
High-Value Benefits That Reduce Hesitation
Focusing on benefits that address major life stressors can dramatically shorten a candidate’s initial hesitation and application decision. High-perceived-value benefits like generous Paternity and Maternity Leave policies, comprehensive Mental Health Coverage, and practical Flexible Work Arrangements (Hybrid/Remote) instantly elevate your offer. These concrete; life-changing benefits are far more persuasive than a generic promise of a "competitive salary."
The Conversion Phase: Benefits as a Negotiation Accelerator
Once you find a great candidate, the negotiation phase is where Time to Fill often stalls. Strong benefits act as rocket fuel, accelerating the offer acceptance and minimizing costly, time-consuming back-and-forth.
Reducing Offer Time
When an offer is extended, a truly compelling benefits package often results in candidates accepting the first offer. They don't feel the need for lengthy counter-offers focused solely on base salary because the total value is already overwhelming.
A clear, well-articulated benefits statement in the offer letter minimizes follow-up questions, builds trust, and speeds up the decision-making process. The certainty and value provided by the benefits act as an irresistible closing tool.
Framing the Total Compensation Advantage
To fully leverage this advantage, your HR team must be trained to frame the discussion around Total Compensation Value. Show candidates how elements like a 100% 401(k) match, fully-funded health insurance options, or student loan repayment programs can easily surpass a perceived $5,000 difference in base salary.
When candidates are weighing multiple offers, the company that provides the most security, flexibility, and value outside of the paycheck will significantly shorten the candidate's decision time, often securing the top talent before competitors can react.
The Long-Term Ripple Effect on TTF
The benefits ROI doesn't stop once the offer is signed. A strategic benefits package initiates a powerful, long-term ripple effect that fundamentally lowers your overall vacancy rate and future TTF.
Boosted Employee Referrals
Happy employees are your best and fastest source of talent. When staff are genuinely satisfied with their compensation and benefits (especially high-value items like Sabbatical programs or generous PTO), they become powerful advocates. This satisfaction increases the likelihood of employees referring high-quality candidates, who are typically onboarded faster because of the pre-vetted nature of the relationship. Referral hires are consistently the fastest and cheapest source of talent for any organization.
Lower Turnover Rate
Ultimately, a high TTF is often symptomatic of high employee turnover. Strong benefits increase employee retention, meaning you have fewer open jobs to fill in the first place. Since TTF is calculated using both the vacancy rate and the duration of those vacancies, better benefits effectively tackle both components simultaneously.
Quantifying the Benefits: TTF vs. Public Perception
The impact of your benefits is no longer limited to the candidates you interview; it's public. When candidates research a company, they immediately consult public review platforms like Glassdoor. These platforms link candidate sentiment directly to your hiring efficiency.
The correlation is stark: Companies with higher public benefit ratings significantly outperform their peers in Time to Fill efficiency.
Mployer’s recent analysis of 300 companies and over 2,000 open roles during a 120-day period revealed a critical connection between public sentiment and hiring speed. We compared organizations with exceptionally high Glassdoor benefit ratings (a key proxy for positive external perception) against those with mid-to-lower ratings. The result was a dramatic acceleration in the hiring funnel: for companies with top-tier benefit ratings, the average Time to Fill (TTF) was just 19 days, compared to 27 days for their counterparts—a significant 32% reduction in hiring time. While this trend was most pronounced among smaller organizations (like local businesses to mid-market firms), large global corporations (including Samsung, Morgan Stanley, and GE) demonstrated the same efficiency gain, affirming the universal impact of a strong benefit-based Employer Value Proposition.
Companies with an "Excellent" or "Above Average" benefit rating (4.0+ stars on Glassdoor, for example) consistently report a Time to Fill that is 15-20% shorter than industry peers with "Average" or "Poor" benefit ratings (Source 2). This efficiency is driven by the immediate credibility and trust built before the candidate even submits an application. A strong public rating reduces the need for the candidate to perform extensive due diligence, further accelerating the initial application phase.
Enhanced Employer Brand
A consistently excellent benefits package strengthens your overall Employer Value Proposition (EVP). This enhanced brand, which is now supported by public data, naturally improves all future recruiting efforts by attracting passive candidates who have been watching your company’s reputation grow.
Conclusion: The Investment That Pays for Itself
The takeaway is clear: investing in market-leading benefits doesn't cost money; it saves money by drastically reducing the tangible costs associated with lengthy vacancies, high recruiting fees, and low productivity.
Benefits act as an accelerant across all three critical phases of hiring: they Attract more candidates, convert them faster, and ensure their Retention, fueling a steady stream of future referral hires.
Action Item: Review your current benefits package through the lens of a prospective, top-tier candidate. Where can you add immediate, high-impact value? The race for talent is won by the company that makes the quickest, most compelling offer—and that starts with great benefits.
To gain a competitive edge and identify your specific TTF acceleration points, benchmark your offerings today. See how your benefits stack up against industry peers through a free, unbiased rating: Visit https://mployeradvisor.com/employer-rating
Sources
Industry benchmarks, based on average daily revenue loss and recruiting overhead.
Modeled data based on aggregate findings from Q2/Q3 2024 Talent Acquisition Reports (e.g., LinkedIn Talent Trends, Glassdoor Economic Research).
Navigating the New H1-B Reality: A Guide for HR Professionals
The H1-B visa program, designed to bring skilled foreign workers to the U.S. for "specialty occupations," is undergoing significant changes that demand your attention. The H1-B visa process is a multi-step, multi-cost journey. Before the recent changes, the primary costs were for filing fees, which typically ranged from $2,000 to $5,000, depending on the size of the employer and the specific application type [1]. The process begins with an employer submitting an electronic registration for a foreign worker during a specific period each March. If selected in the annual lottery, the employer then files the full H1-B petition with U.S. Citizenship and Immigration Services (USCIS). The annual cap is 85,000 visas, but demand consistently outstrips supply, with hundreds of thousands of applicants vying for a spot each year (USCIS, 2025). Historically, the program has seen a sharp increase in registrations, but a new beneficiary-centric lottery system implemented in recent years has helped curb duplicate applications, leading to a notable drop in eligible registrations for the most recent fiscal years.
The information technology (IT) industry is by far the biggest user of the H1-B visa, accounting for over 65% of visa holders (Image 2) [2]. This trend has been consistent, with major tech companies and IT consulting firms like Amazon, Tata Consultancy Services, Microsoft, Meta, and Google topping the list of H1-B sponsors. These companies primarily use the visa to fill roles for software engineers, data analysts, AI researchers, and other tech specialists. However, other industries like finance, healthcare, and higher education also rely heavily on the visa to fill specialized positions.
Key Legislative Changes and What They Mean for HR
The landscape of H1-B hiring has been dramatically reshaped by two major legislative actions. In a significant move, a new proclamation was issued on September 19, 2025, which, as of September 21, 2025, requires a one-time $100,000 payment for most new H1-B petitions filed on behalf of beneficiaries who are outside the United States [3]. This substantial fee, a dramatic increase from previous costs, is aimed at discouraging the hiring of lower-skilled, lower-paid foreign workers and instead, incentivizing companies to hire the "best and brightest." For HR, this signals a major shift from a volume-based lottery strategy to a more meritocratic, high-cost model. The proclamation is currently slated to last for 12 months, but it may be extended or subject to further clarification from government agencies [4].
For current H1-B visa holders, and those with petitions filed before September 21, 2025, this new fee does not apply [5]. Existing visa holders can continue to travel and re-enter the country as they normally would, and visa renewals are not subject to the new fee. However, some legal experts advise against unnecessary international travel for those whose petitions were filed after the effective date, due to the lack of clear guidance on how the new fee would be applied upon re-entry.
Separate, but related, proposed legislation is currently moving through the rulemaking process. The Department of Homeland Security (DHS) is proposing a rule to replace the current random H1-B lottery system with a weighted selection process that would favor higher-skilled and higher-paid applicants. This proposed rule was published in the Federal Register on September 24, 2025, opening a 30-day public comment period that ends on October 24, 2025 [6]. After the comment period, DHS will review the feedback and may issue a final rule. If finalized in time, this new system could be in effect for the next H1-B cap season beginning in March 2026.
The new $100,000 fee and proposed changes are not without opposition. Many legal experts and industry leaders argue that the proclamation exceeds the President's authority by instituting a fee that is not tied to administrative costs, as fees typically are. Legal challenges are almost certain, and courts could potentially strike down the fee [7]. Furthermore, there is public and political pressure to repeal the measure, as critics argue it will drive talent and jobs overseas, harm U.S. competitiveness, and effectively dismantle the H1-B program for all but the largest corporations. While it is unclear if these efforts will succeed, HR professionals should stay informed on the evolving legal landscape, as a successful legal challenge could reverse these recent changes.
Moving From Lottery to Elite Talent Strategy: Key Considerations
The H1-B program is no longer a volume game of chance but a calculated, high-stakes investment; a fundamental shift in the American talent strategy. For HR professionals, this means moving beyond reactive compliance and embracing a proactive, strategic role. You must become a key partner in workforce planning, advising leadership on how to balance global talent needs with the new financial realities. The path forward requires a focus on quality over quantity, meticulous legal vigilance, and a clear, well-communicated strategy for both current and future employees.
Here are some key considerations as you begin to prepare the way forward for your own workforce:
1. Strategic Workforce Planning. The new $100,000 fee for new H1-B petitions filed for beneficiaries abroad makes sponsoring international talent a high-stakes, high-cost decision. Begin reevaluating your talent pipeline, prioritizing critical roles that require highly specialized skills, and considering if the investment is justified for each position. You'll need to work closely with department heads to identify essential roles that cannot be filled by the domestic workforce.
2. Budgetary and Financial Adjustments. The new fee is a dramatic increase from prior costs, which were typically under $5,000. For companies that rely on a large number of H1-B hires, this could add millions of dollars to the annual budget. HR and finance departments need to collaborate to re-budget for future international hires and plan for the potential financial impact.
3. Shifting to a Meritocratic System. The proposed weighted lottery system will favor higher-skilled, higher-paid applicants. This change moves the H1-B program away from a random chance and toward a system that rewards higher salaries. HR should be prepared for this by ensuring compensation for sponsored roles is competitive and aligns with the highest wage tiers to increase the chances of selection.
4. Navigating Uncertainty and Legal Challenges. The new fee and proposed changes are facing significant legal challenges. The situation is fluid, and further guidance from government agencies is expected. HR professionals need to stay informed by consulting with immigration counsel and legal experts regularly. It is also critical to advise current H1-B employees on the potential risks of international travel, as the new rules are still being clarified and could impact their re-entry.
The challenge is significant, but for those who adapt, the H1-B program will remain a powerful tool for securing the elite, specialized talent that drives innovation and growth.
In-Text Citations
[1] NNU Immigration. (2025). H1B Visa Cost & Fees 2025. Retrieved from https://www.nnuimmigration.com/h1b-visa-cost/
[2] American Immigration Council. (2025). Trump's $100,000 Fee for H-1B Visas: What You Need to Know. Retrieved from https://www.americanimmigrationcouncil.org/blog/trump-100000-fee-h1b-visa/
[3] The White House. (2025). Fact Sheet: President Donald J. Trump Suspends the Entry of Certain Alien Nonimmigrant Workers. Retrieved from https://www.whitehouse.gov/presidential-actions/2025/09/restriction-on-entry-of-certain-nonimmigrant-workers/
[4] Holland & Knight. (2025). Summary of Presidential Proclamation: Restriction on Entry of Certain Nonimmigrant Workers. Retrieved from https://www.hklaw.com/en/insights/publications/2025/09/summary-of-presidential-proclamation-restriction-on-entry-of-certain [5] USCIS. (2025). H-1B FAQ. Retrieved from https://www.uscis.gov/newsroom/alerts/h-1b-faq
[6] Fragomen. (2025). United States: DHS Proposes Wage Level-Based Weighted System of H-1B Cap Allocation. Retrieved from https://www.fragomen.com/insights/united-states-dhs-proposes-wage-level-based-weighted-system-of-h-1b-cap-allocation.html
[7] The Guardian. (2025). Trump signs proclamation imposing annual $100,000 fee on H-1B visas. Retrieved from https://www.theguardian.com/us-news/2025/09/19/trump-h1b-visa-100000-fee
Prescription drug costs have surged dramatically in recent years, placing increasing strain on employer-sponsored health plans. Between 2000 and 2020, retail prescription drug spending in the U.S. nearly doubled (a 91% increase) and continues to climb—outpacing most other healthcare cost categories. The rise stems from two primary factors: expensive new specialty therapies (like weight-loss and biologic treatments) and the opaque role of Pharmacy Benefit Managers (PBMs) in setting prices. What makes matters worse is that Americans pay dramatically more than people in other high-income nations—U.S. drug prices average 2.78 times higher than in 33 comparable countries, and brand-name drugs can cost more than four times as much. This steep cost trajectory and global overpayment emphasize why understanding and managing PBMs has become essential for employers aiming to control healthcare spend and protect employees.
How PBMs Actually Work
When an employer designs its health plan, it either chooses a PBM directly or selects a carrier that already has a PBM embedded in its plan. From there, the PBM takes control of the prescription drug benefit. They build the formulary—the list of drugs that are covered—and negotiate with manufacturers to decide which drugs make the list. By narrowing coverage to certain products, PBMs gain leverage to demand better deals. They also restrict which pharmacies are in-network, again concentrating volume to maximize bargaining power.
This means PBMs effectively set the market, costs, and tiers employees experience: whether a drug falls into Tier 1 with a $10 copay or Tier 4 with a 25% coinsurance is dictated by the PBM’s design. On the back end, PBMs collect rebates from drug makers. A rebate is essentially a kickback payment from the manufacturer to the PBM, offered in exchange for favorable placement of a drug on the formulary or higher expected utilization. For example, if two similar drugs treat the same condition, the manufacturer willing to pay a higher rebate is more likely to have their drug chosen. Some portion of these rebates is passed back to the employer to lower plan costs, but a significant share is often kept by the PBM—one of the biggest transparency concerns in the system
How Drug Tiers and Payment Structures Work
Most employer health plans organize prescription coverage into tiers, which determine both access and cost-sharing for employees.
Tier 1 (Generics): Lowest-cost drugs, usually just a $10–$20 copay. They are widely accessible and often encouraged as first-line therapy.
Tier 2 (Preferred Brands): Brand-name drugs that PBMs have negotiated discounts on. Employees typically pay $30–$50 copays or around 20% coinsurance.
Tier 3 (Non-Preferred Brands): Higher-cost brand drugs not favored on the formulary. Employees may owe 40%+ coinsurance, leading to hundreds in out-of-pocket costs.
Tier 4 (Specialty Drugs): High-cost therapies for serious conditions like cancer or hemophilia. These usually require coinsurance (20–30%), which can mean thousands of dollars per month. Although they make up less than 2% of prescriptions, specialty drugs drive nearly half of total drug spending.
Copays vs. Coinsurance
A copay is a fixed, predictable dollar amount per prescription.
Coinsurance is a percentage of the total drug cost until the deductible or out-of-pocket maximum is reached. While it helps share costs, it creates unpredictability—especially for specialty drugs, where 25% coinsurance could mean $250 on a $1,000 medication or much more on therapies costing thousands each month.
For employers, understanding how tiers and cost-sharing are structured is critical, since they directly affect both plan expenses and employee affordability.
High-Cost Drugs and Their Outsized Impact
While high-cost drugs represent only a small fraction of total prescriptions, their impact on employer health plans is staggering. Specialty medications—such as those for cancer, hemophilia, and autoimmune disorders—account for less than 2% of prescriptions but drive close to 50% of all drug spending. Their costs have grown at double-digit rates year over year, fueled by new biologics, gene therapies, and infusion-based treatments that can run into hundreds of thousands of dollars annually. According to Sun Life’s High-Cost Claims Report, in many catastrophic claim categories like hemophilia or leukemia, prescription drugs make up more than 90% of the total cost of care. For employers, this means a single claimant on a specialty drug can dramatically shift overall plan spend, making pharmacy benefits one of the most volatile and financially significant areas to manage.
How Carriers Handle High-Cost Drugs
Carriers cover most FDA-approved specialty drugs but tightly manage access and cost. They use formularies to decide which drugs are included (and on what tier), require prior authorization or step therapy before approving treatment, and often restrict dispensing to their own specialty pharmacy networks. Coverage is generally limited to drugs deemed medically necessary, while experimental or non-formulary drugs are excluded unless appealed. For employees, this can mean higher coinsurance, delays in approval, and fewer choices on where prescriptions can be filled.
Who Controls the PBM Market—and Who’s Challenging It
Today, most carriers are tied to the “Big Three” PBMs, which together control more than 75% of the market:
Aetna/CVS → CVS Caremark
Cigna → Express Scripts
UnitedHealthcare → OptumRx
Anthem/Blue Cross (varies by region) → Caremark or Express Scripts
This consolidation means that for many employers, pharmacy benefits are automatically bundled with one of these large PBMs, leaving little room for visibility or flexibility.
The remaining 25% is made up of disruptors offering more transparent models. Players like SmithRx (pass-through pricing with detailed reporting), MedOne (independent PBM with customizable formularies and full rebate pass-through), and Mark Cuban’s Cost PlusDrugs (a direct-to-consumer model selling drugs at cost plus a small margin) are challenging the status quo. For employers, knowing which PBM their carrier relies on—and whether a carve-out to one of these disruptors is possible—can be a critical step in controlling pharmacy costs.
Legislation and Reform Efforts
In recent years, lawmakers have increasingly targeted the opaque practices of PBMs, introducing multiple federal bills like the Pharmacy Benefit Manager Transparency Act (S. 127, 2023) and the PBM Transparency Act of 2025 (S. 526). These aim to ban spread pricing, require full rebate pass-through, and mandate detailed reporting—but none have passed into law yet. Similarly, a 2025 House bill dubbed the PBM Reform Act proposes greater transparency around Medicare Part D contracts and delinking PBM compensation from drug prices, but it remains pending in committee.
At the state level, all 50 states have enacted some degree of PBM regulation. Few states have gone further: for example, Iowa is considering a law imposing minimum pharmacy dispensing fees, and Arkansas passed legislation curbing PBMs’ ownership of pharmacies—though that law has been temporarily blocked by a federal judge
In short: there's plenty of activity at both federal and state levels—but no sweeping reforms have become law yet, leaving employers to manage PBM challenges proactively on their own.
Be Educated: Key Questions to Ask Your Broker
Who is our PBM, and is it bundled with our carrier?
Do we receive 100% of rebates, or are they retained?
Can we carve out our PBM given our size and funding model?
Which high-cost drugs are driving our spend?
Do we get claim-level reporting from our PBM? (often not)
What specialty drug management strategies are in place?
How does our plan compare to industry peers?
Closing Thoughts
Prescription drug costs are no longer a side issue—they’re a central driver of employer healthcare spend. The combination of high-cost specialty therapies and the opaque role PBMs play in setting formularies, controlling access, and managing rebates makes this one of the most complex and consequential areas of benefit management. For employers, the path forward starts with awareness: knowing which PBM you’re tied to, how rebates flow, which drugs are shaping your spend, and what levers you have to push for transparency or carve out alternatives.
While legislation at the federal and state levels may eventually bring more clarity and accountability to the PBM market, employers cannot afford to wait. By asking sharper questions, exploring disruptive PBM models, and partnering with brokers who understand this space, employers can take meaningful steps today to control costs and support employees more effectively.
Bottom line: Prescription drug costs are only going up. Employers that engage now—by digging into the details and holding PBMs and carriers accountable—will be best positioned to protect both their budgets and their people.
.svg)
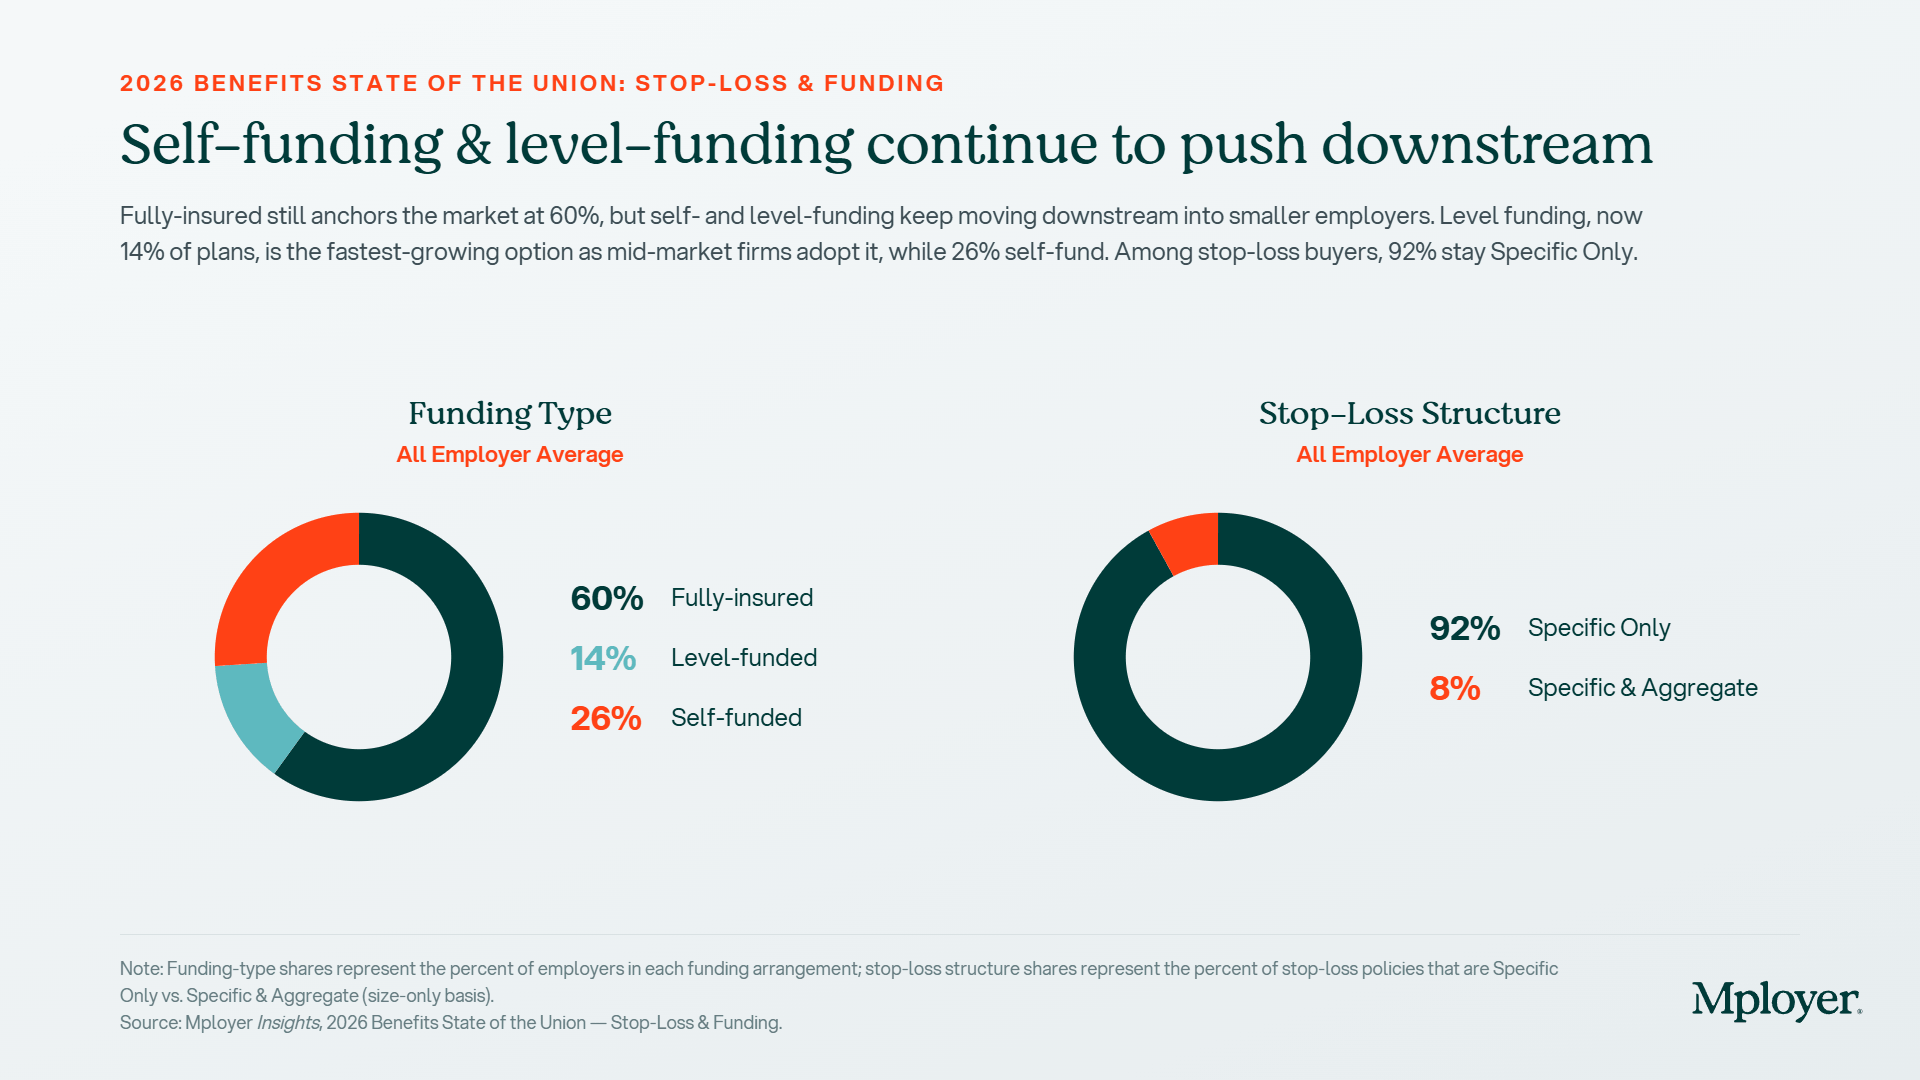
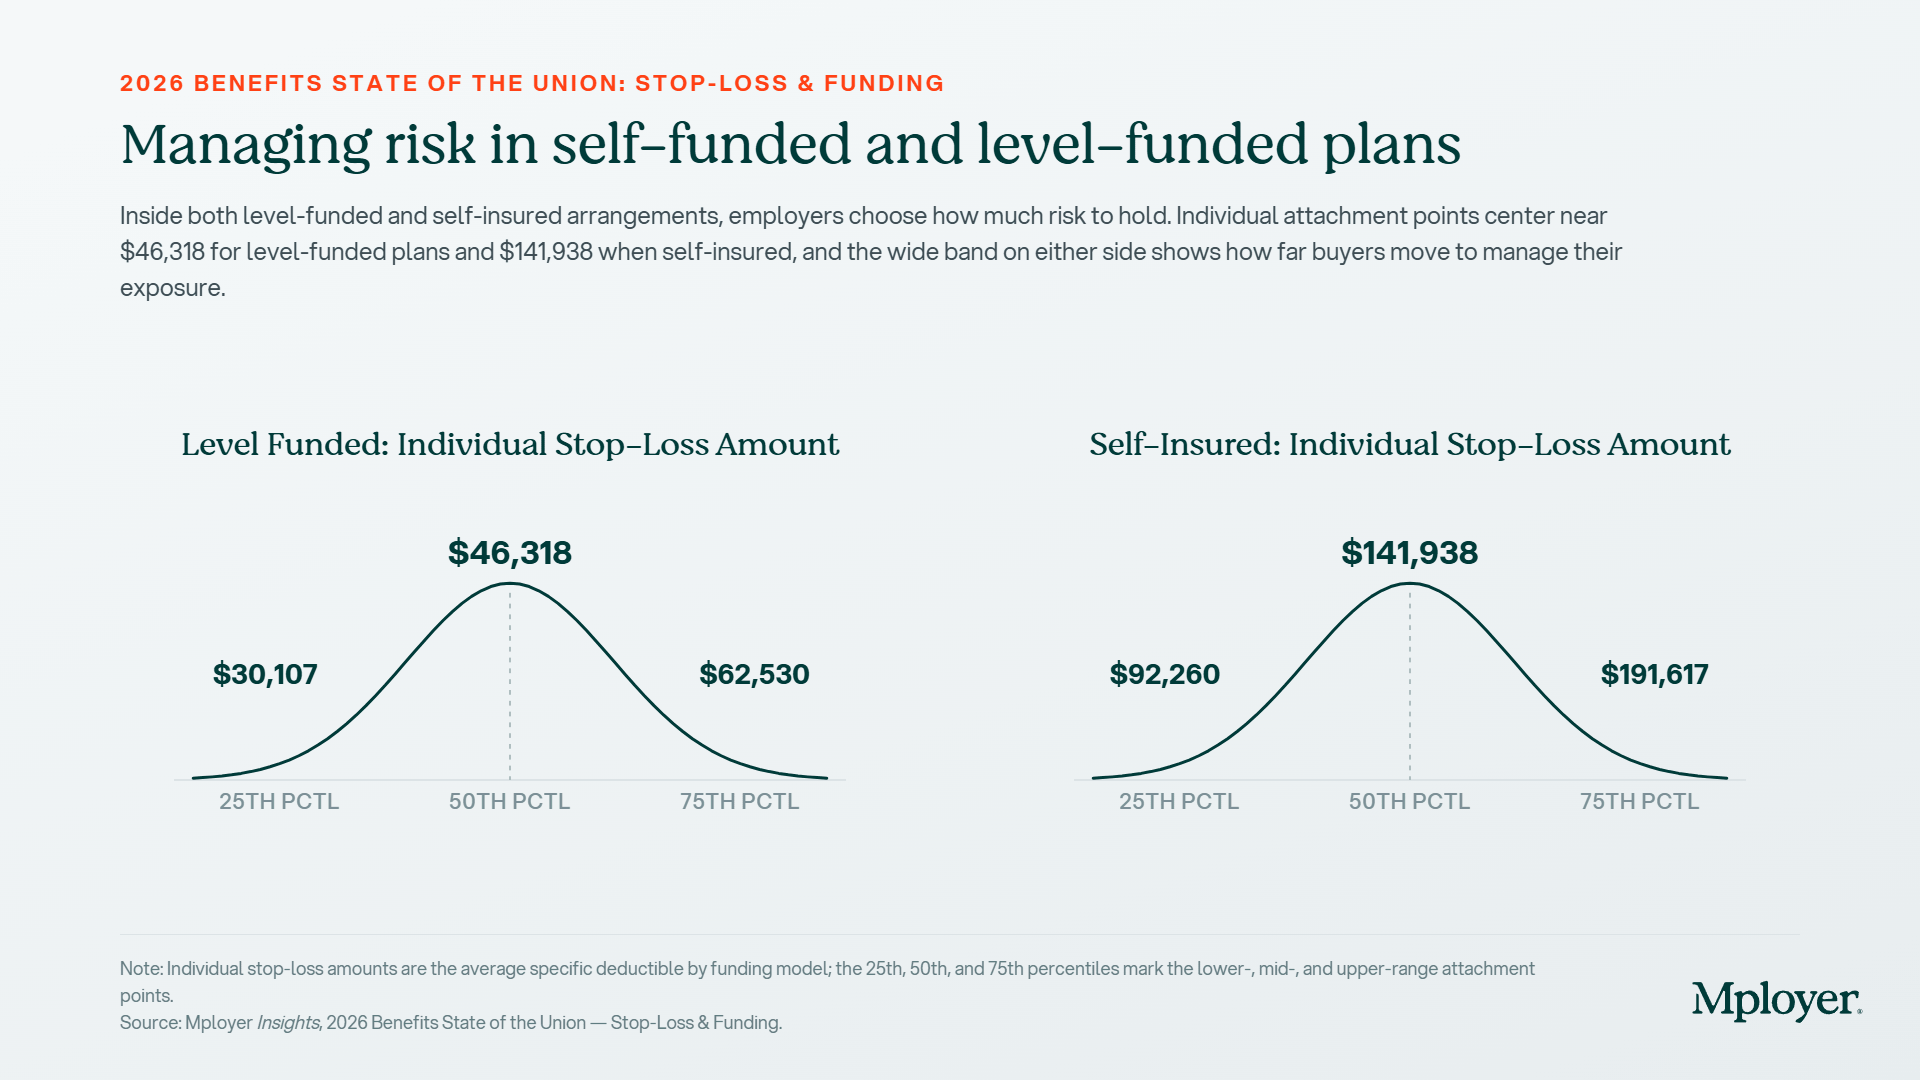
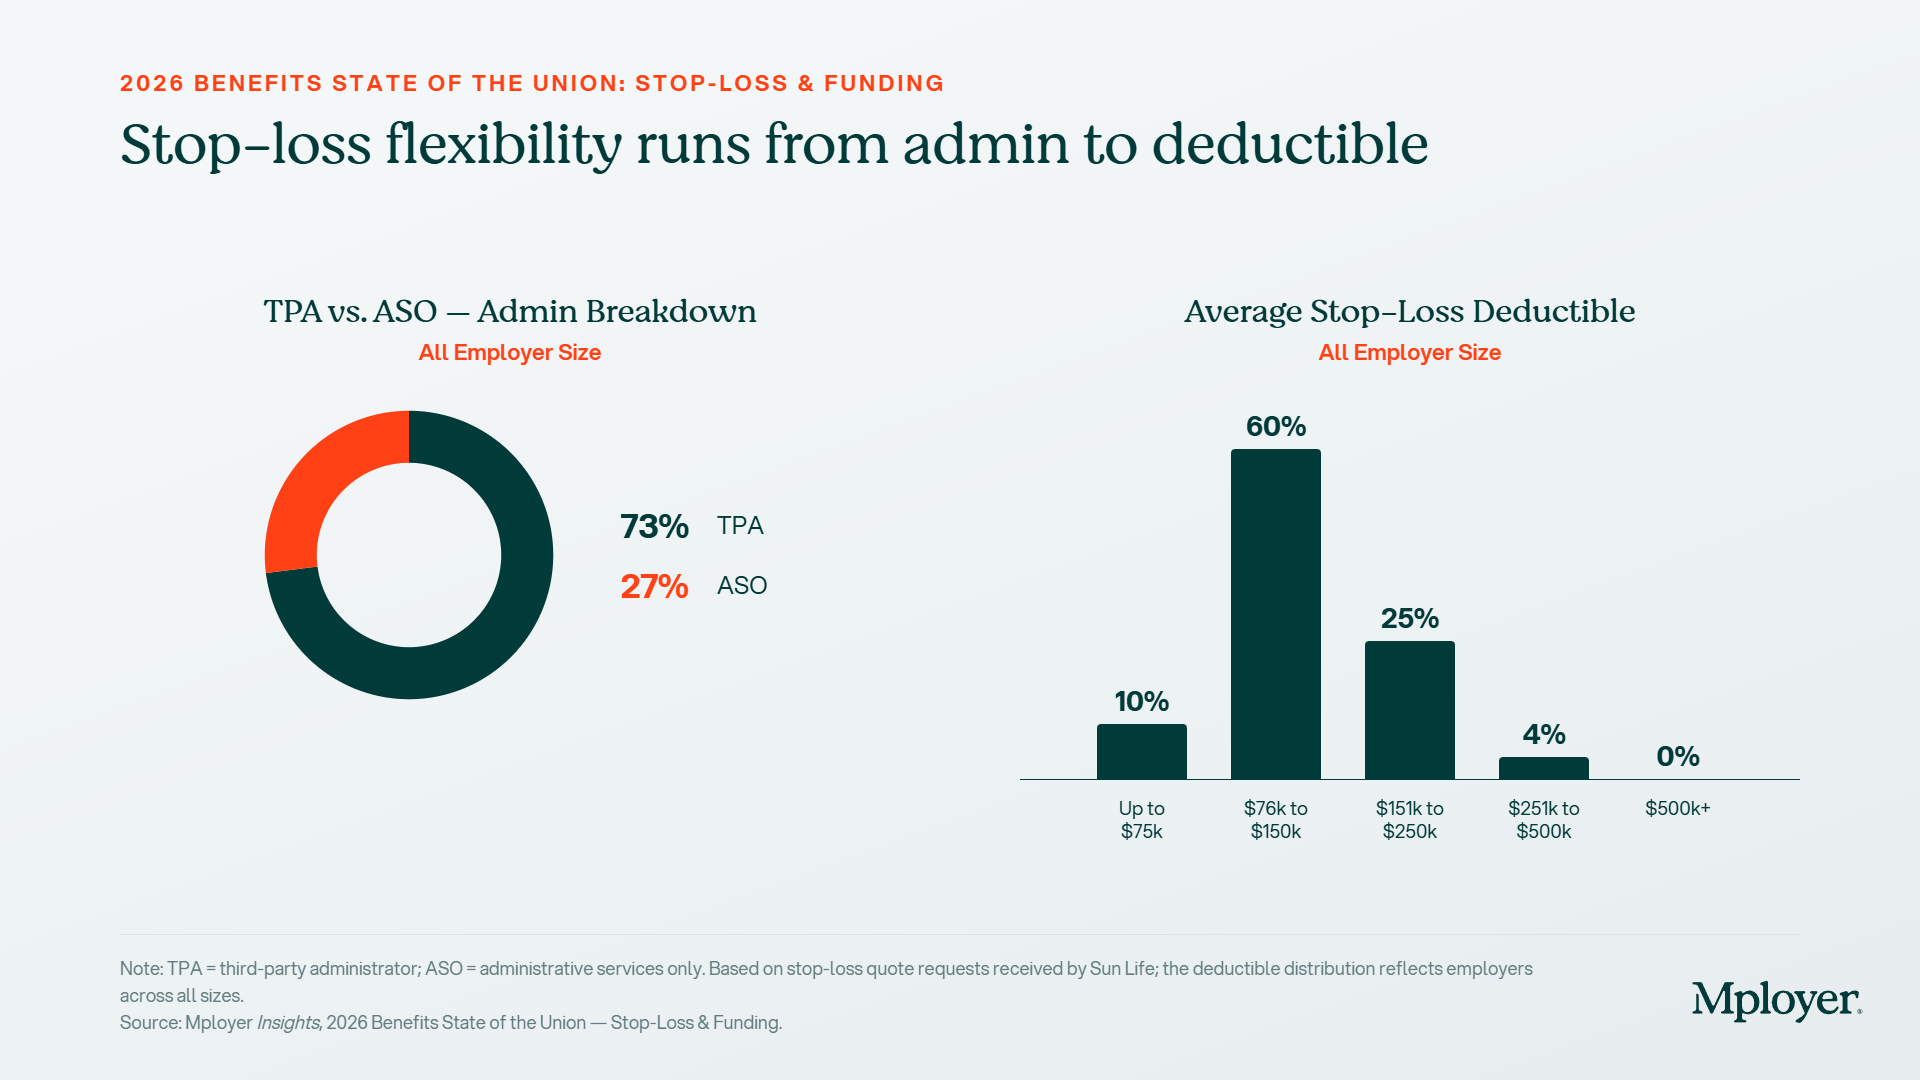
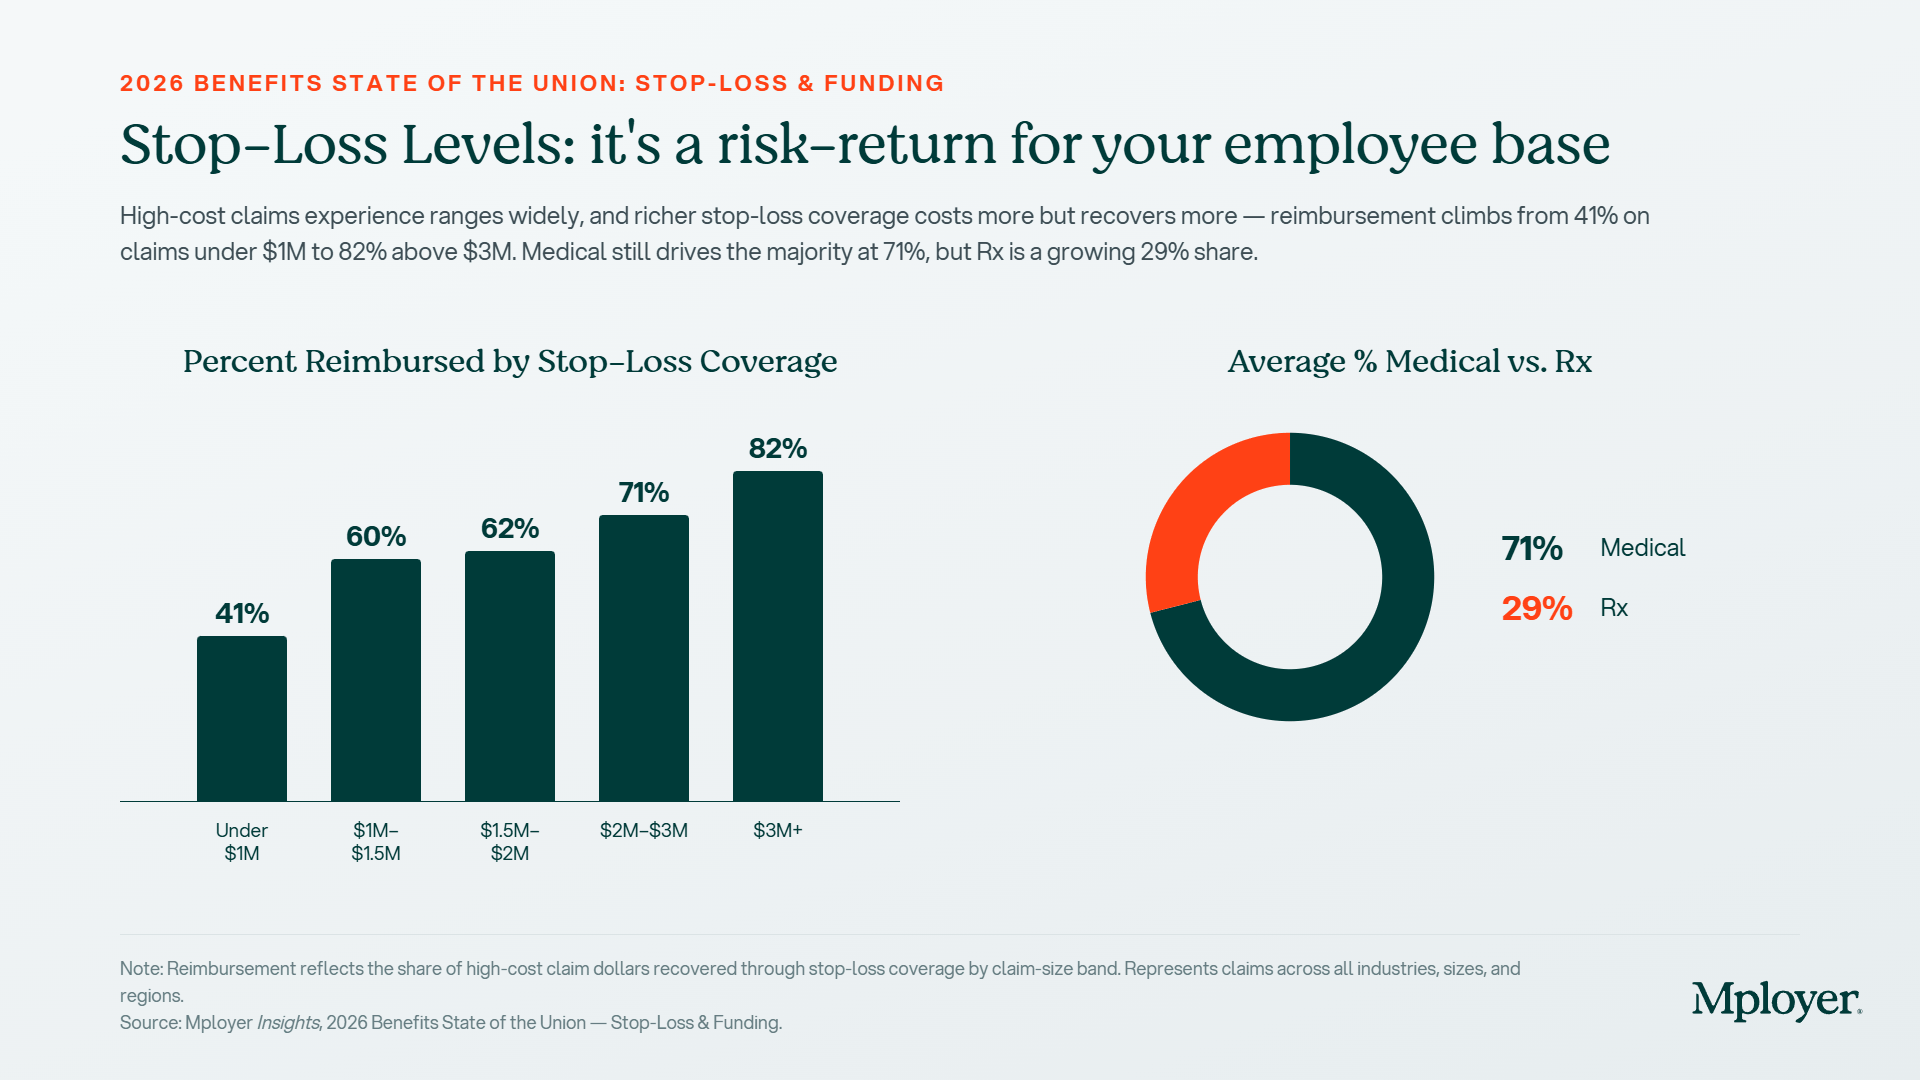
.jpg)
.jpg)
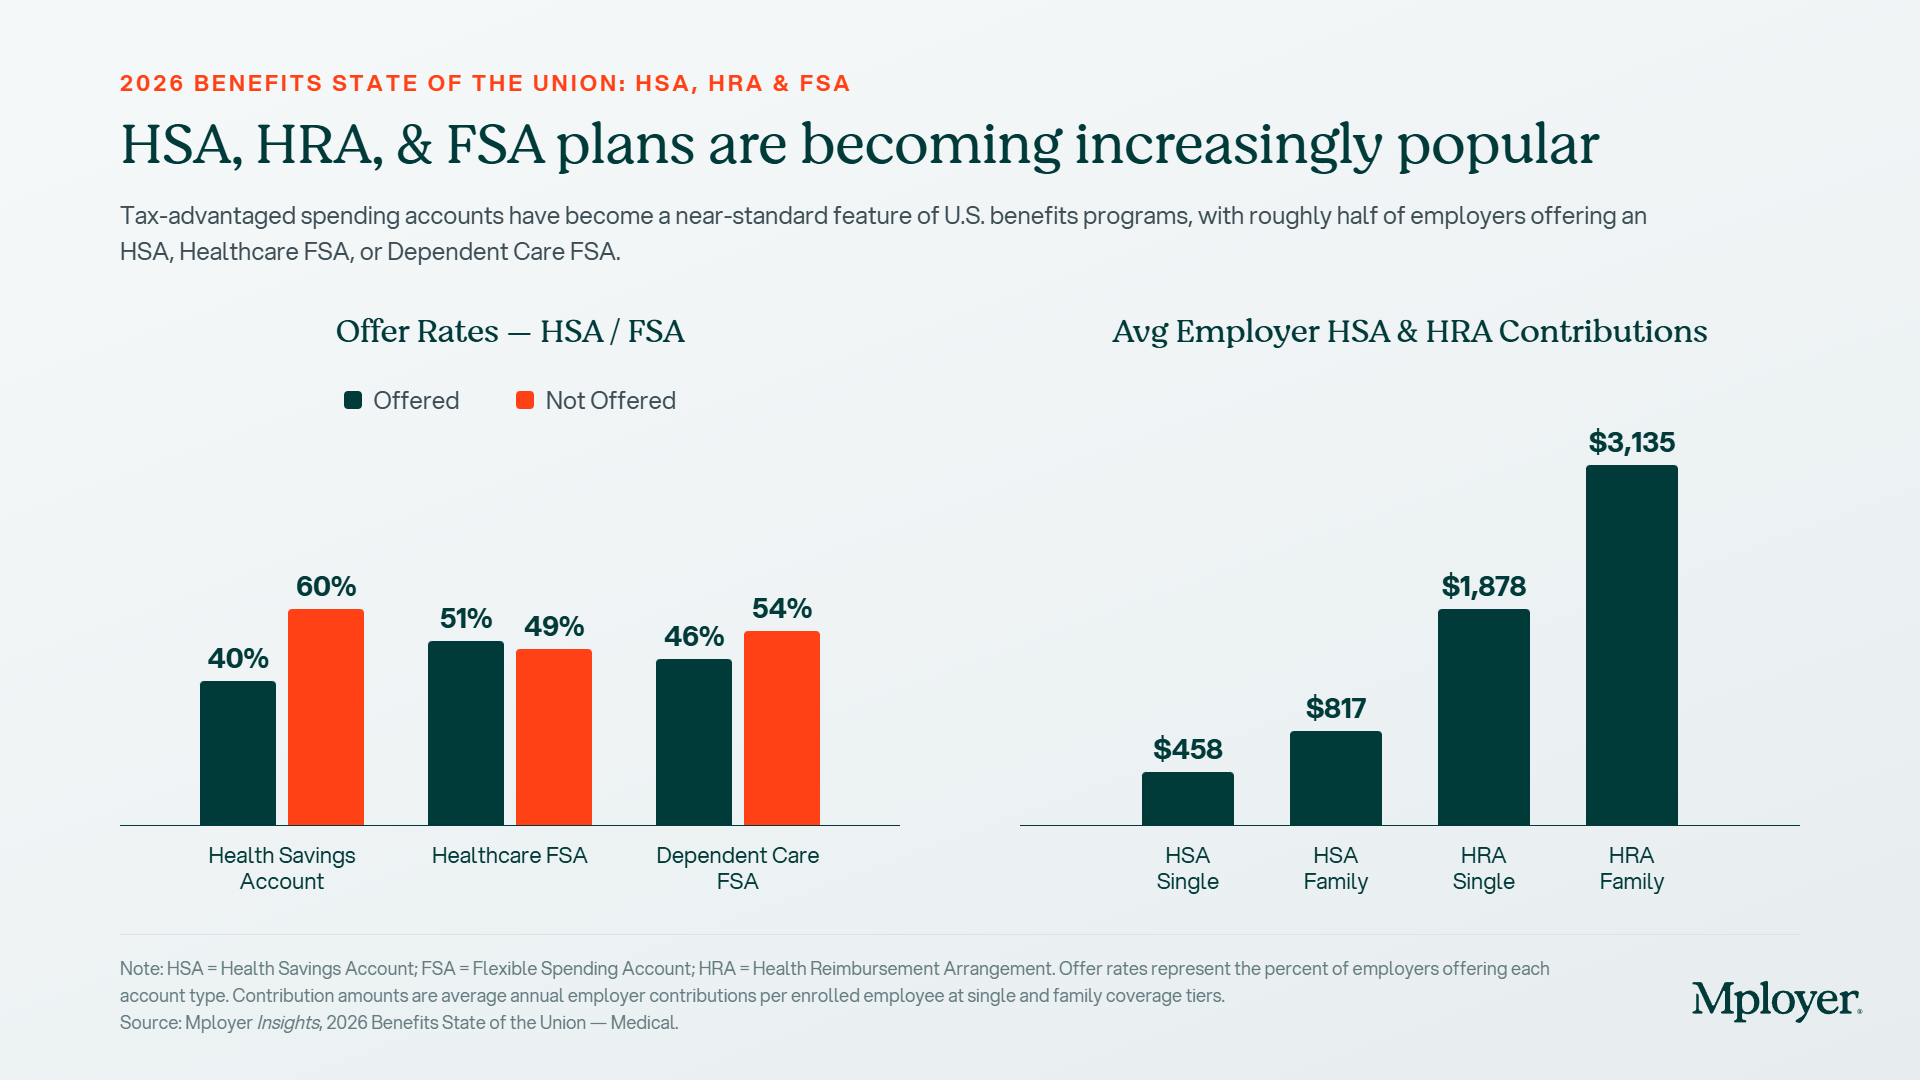
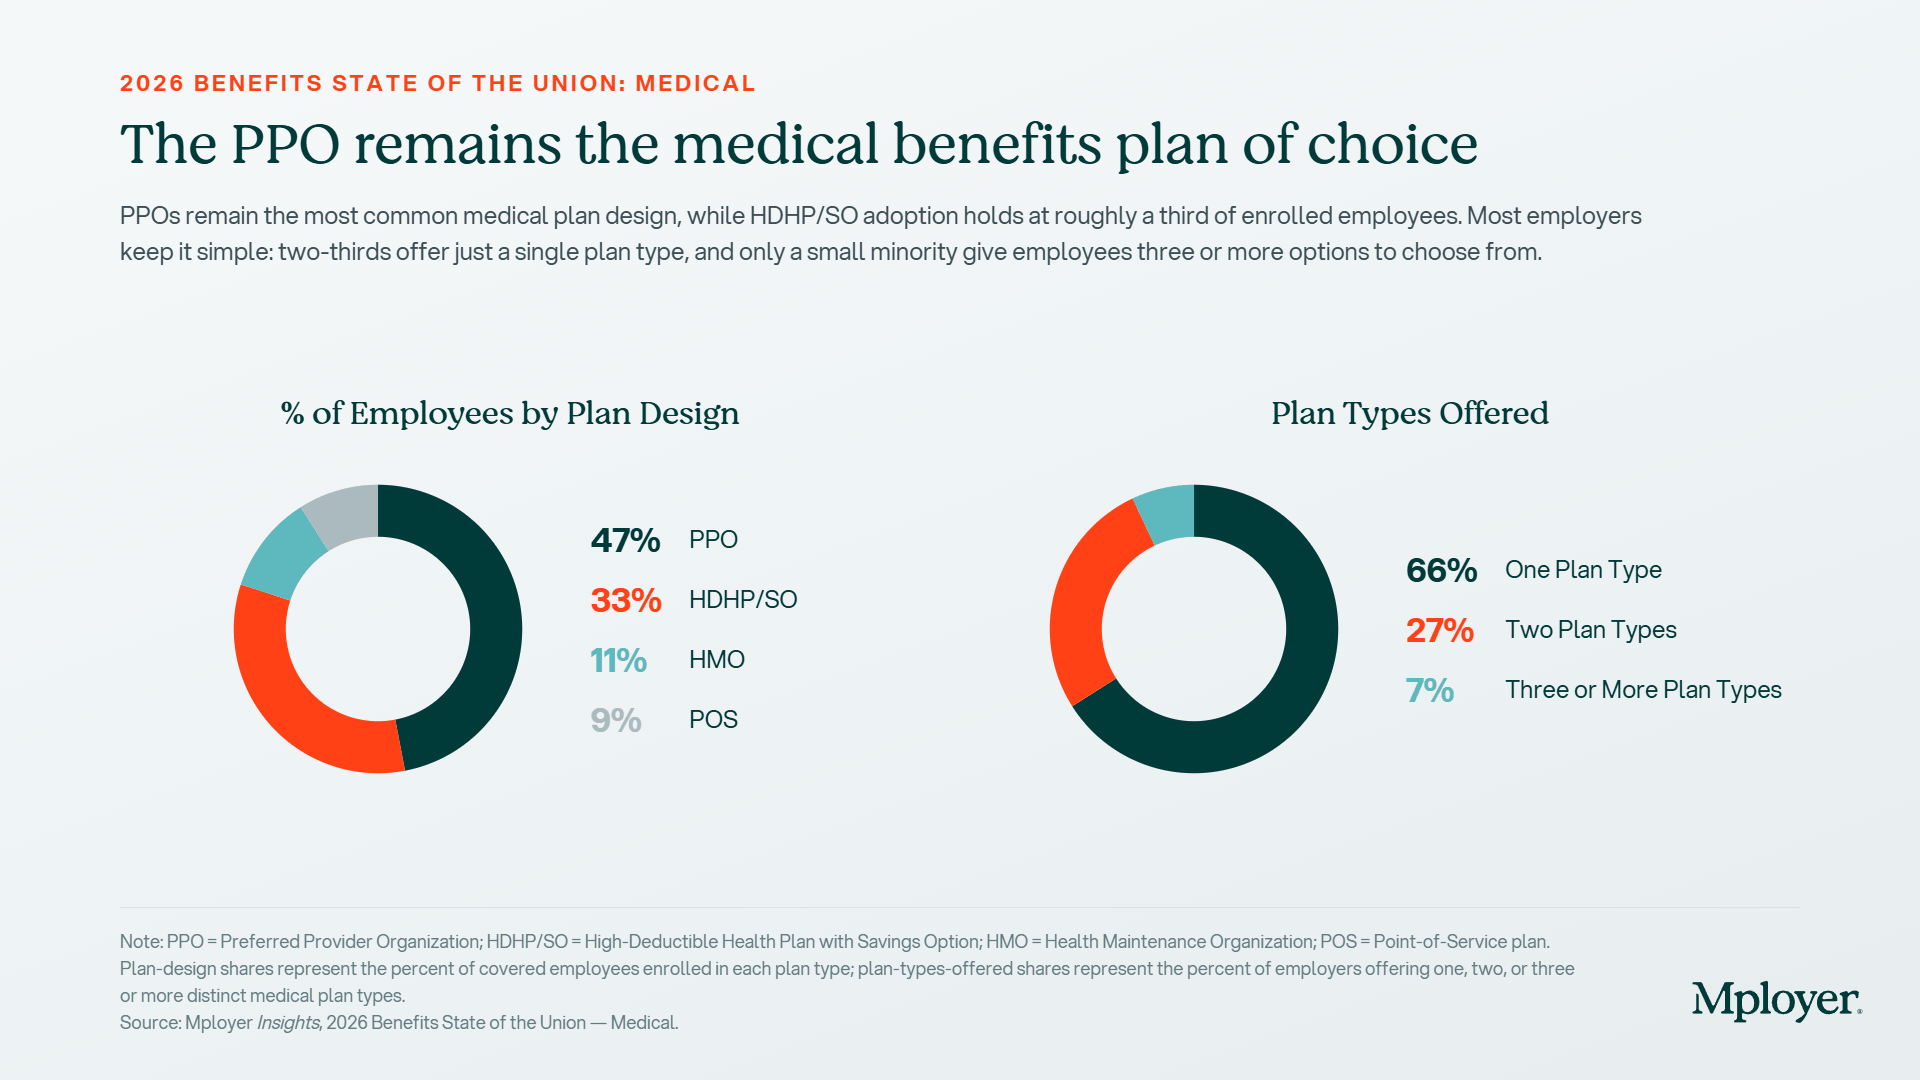
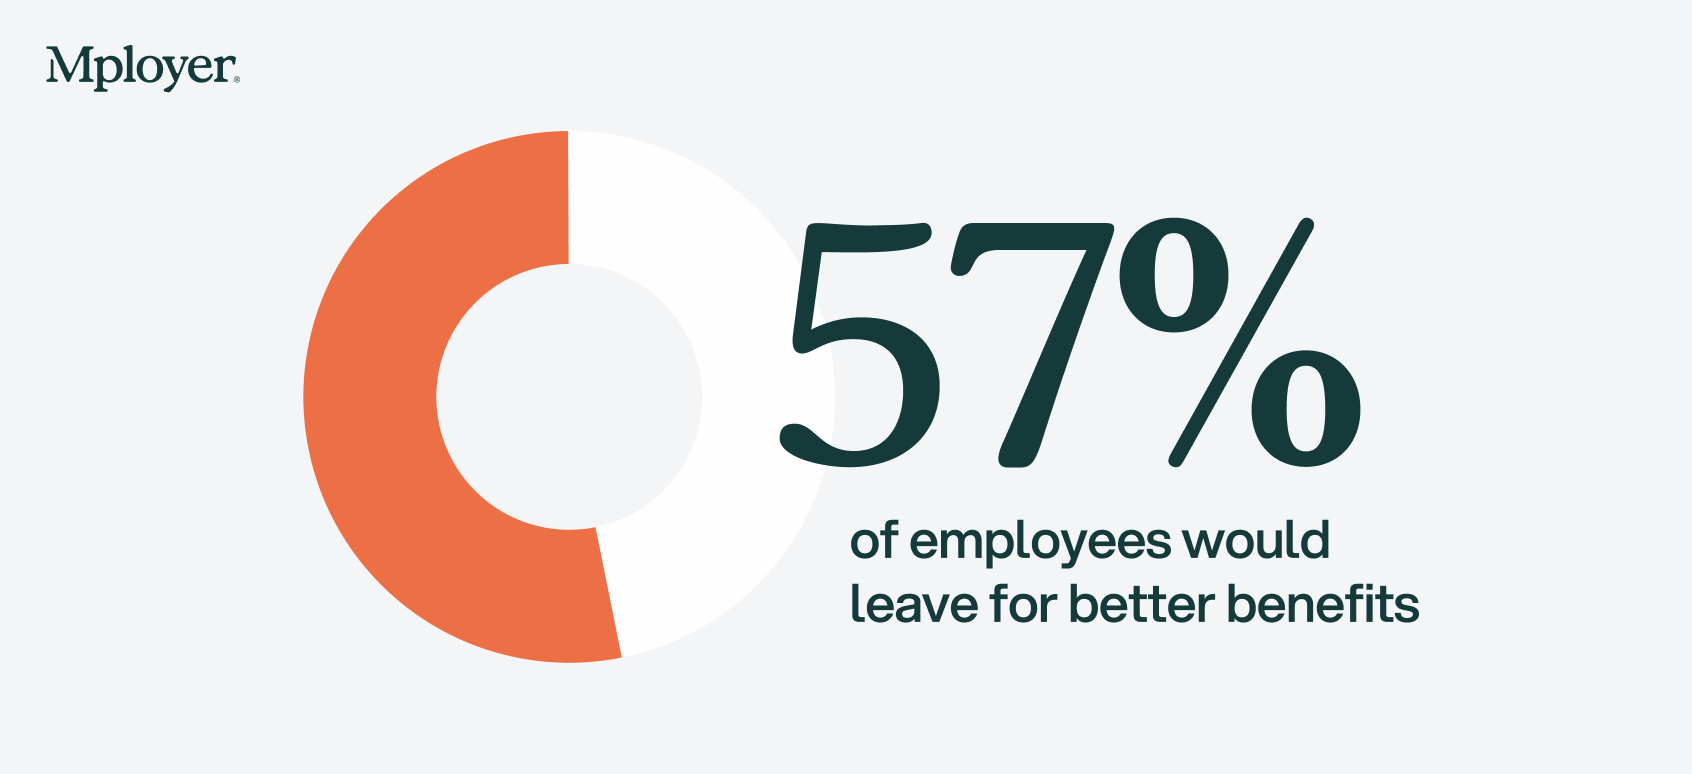

.jpg)

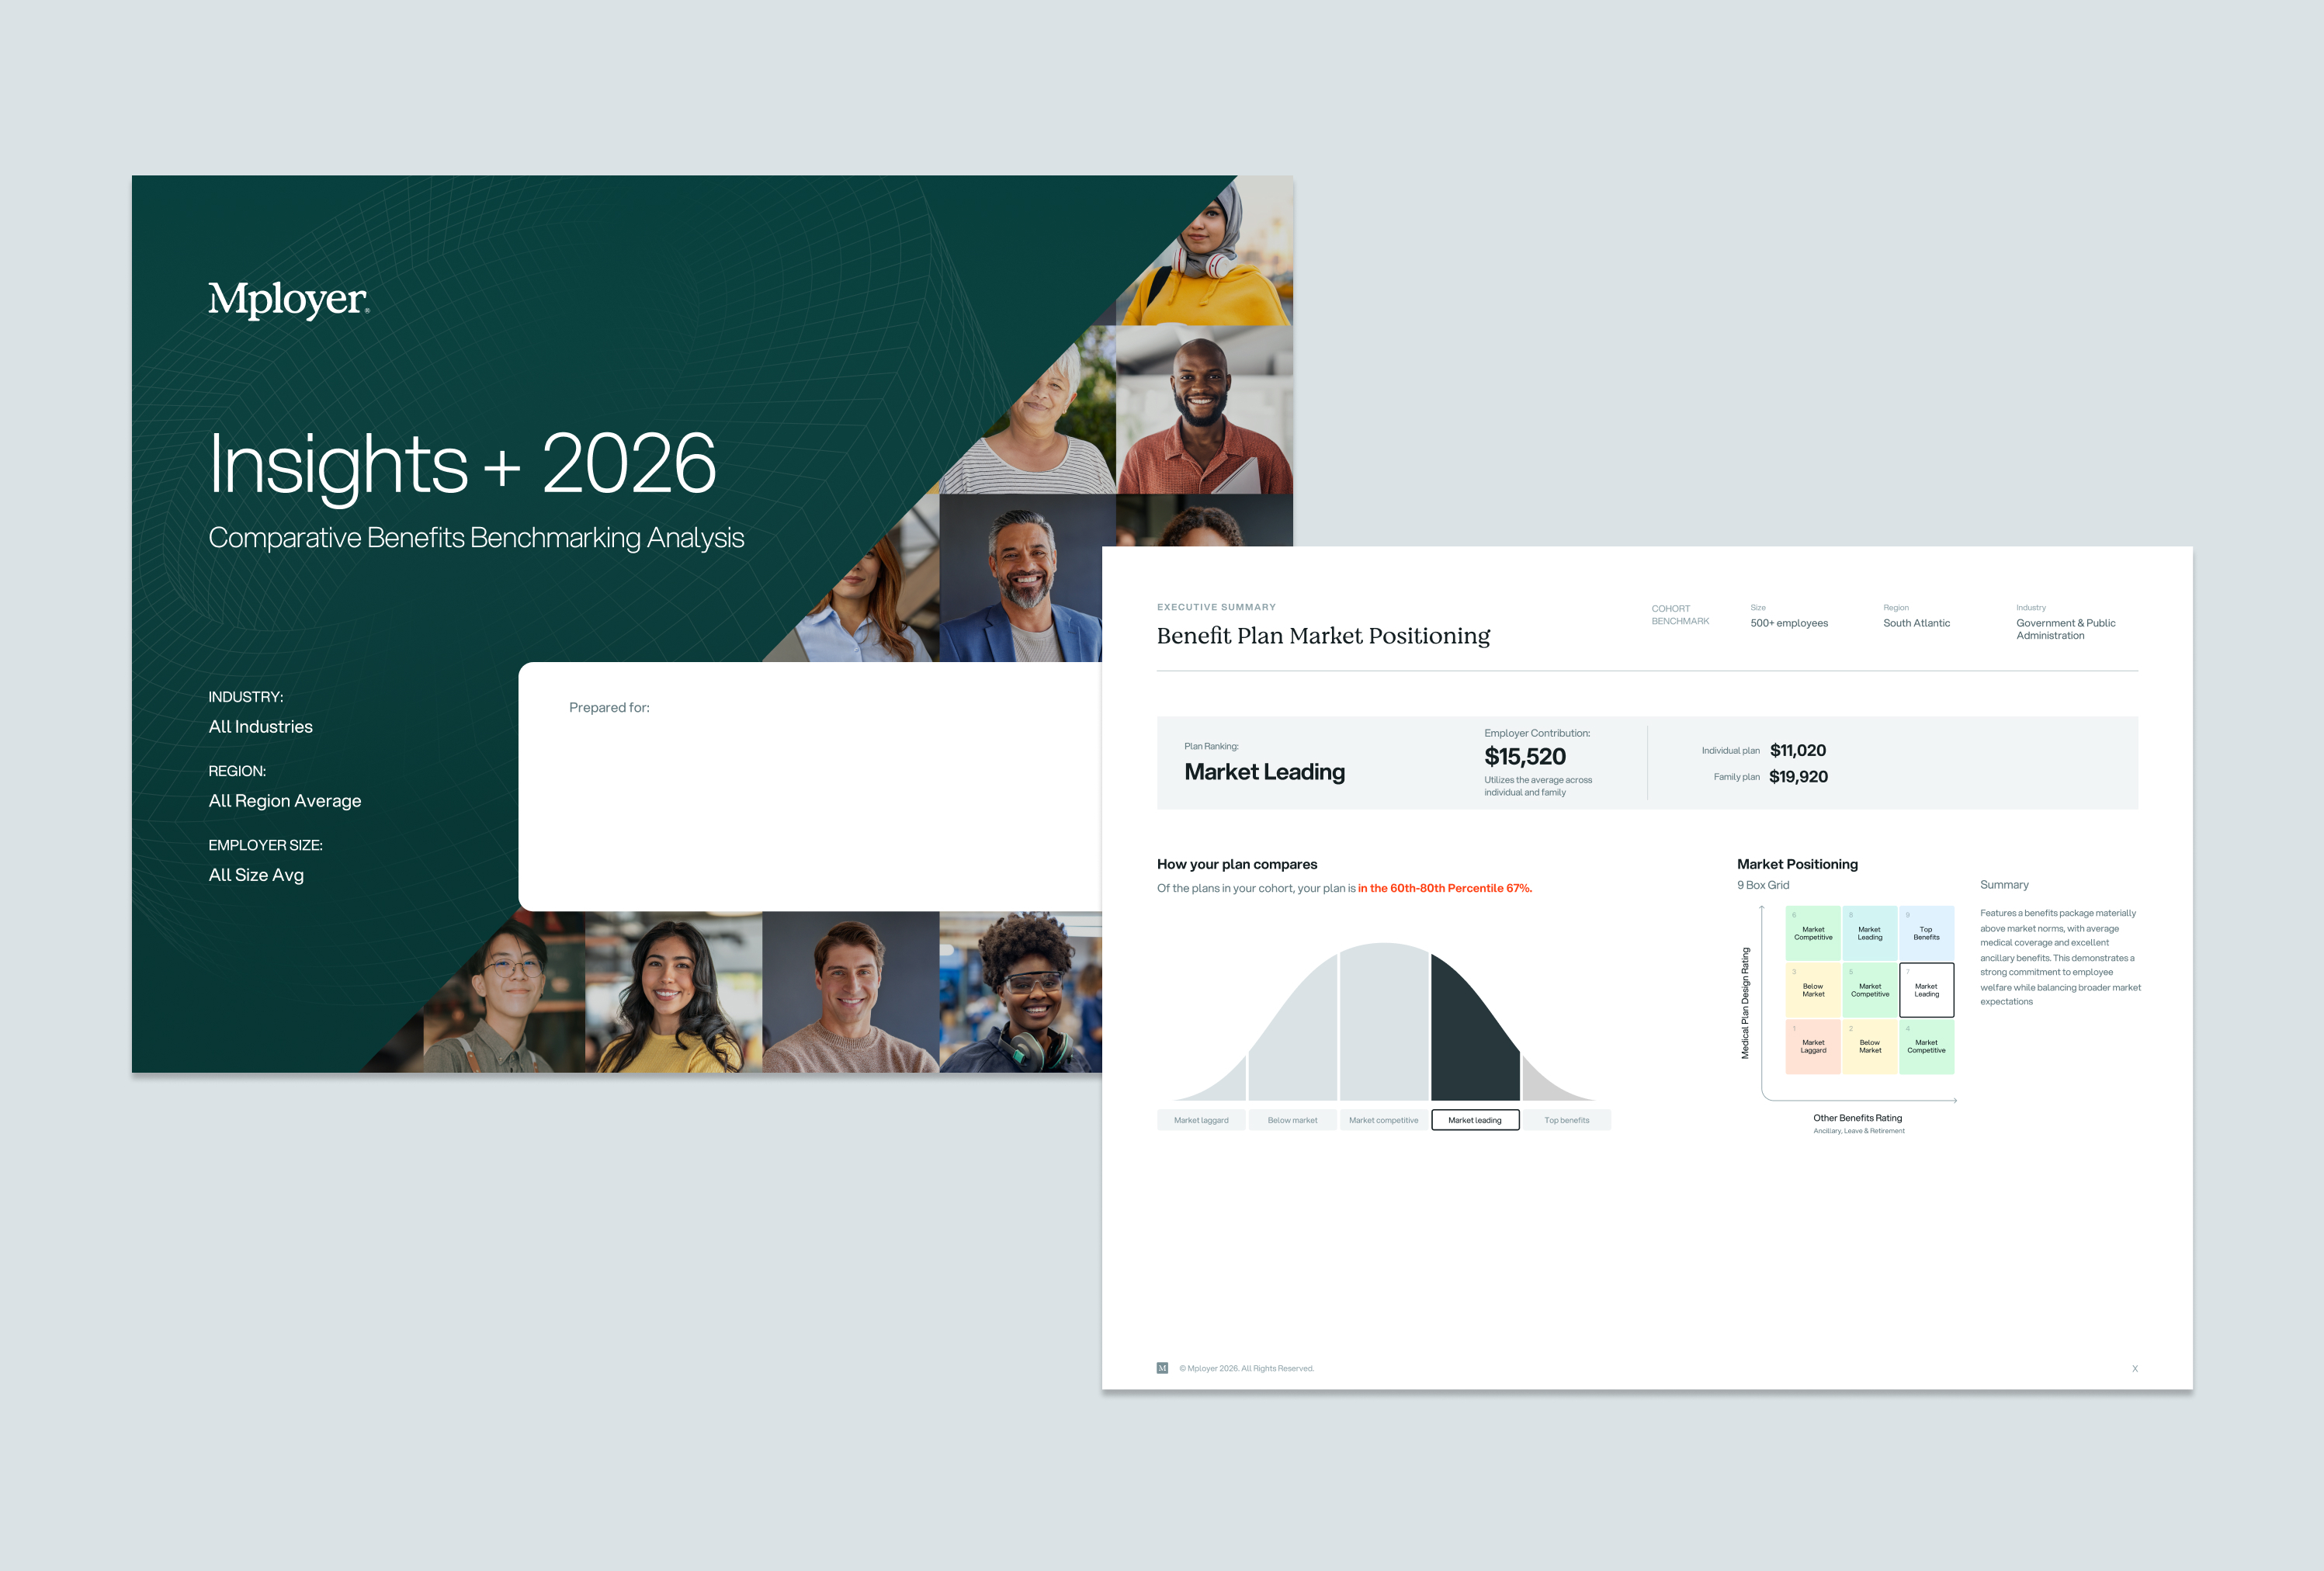

.jpg)


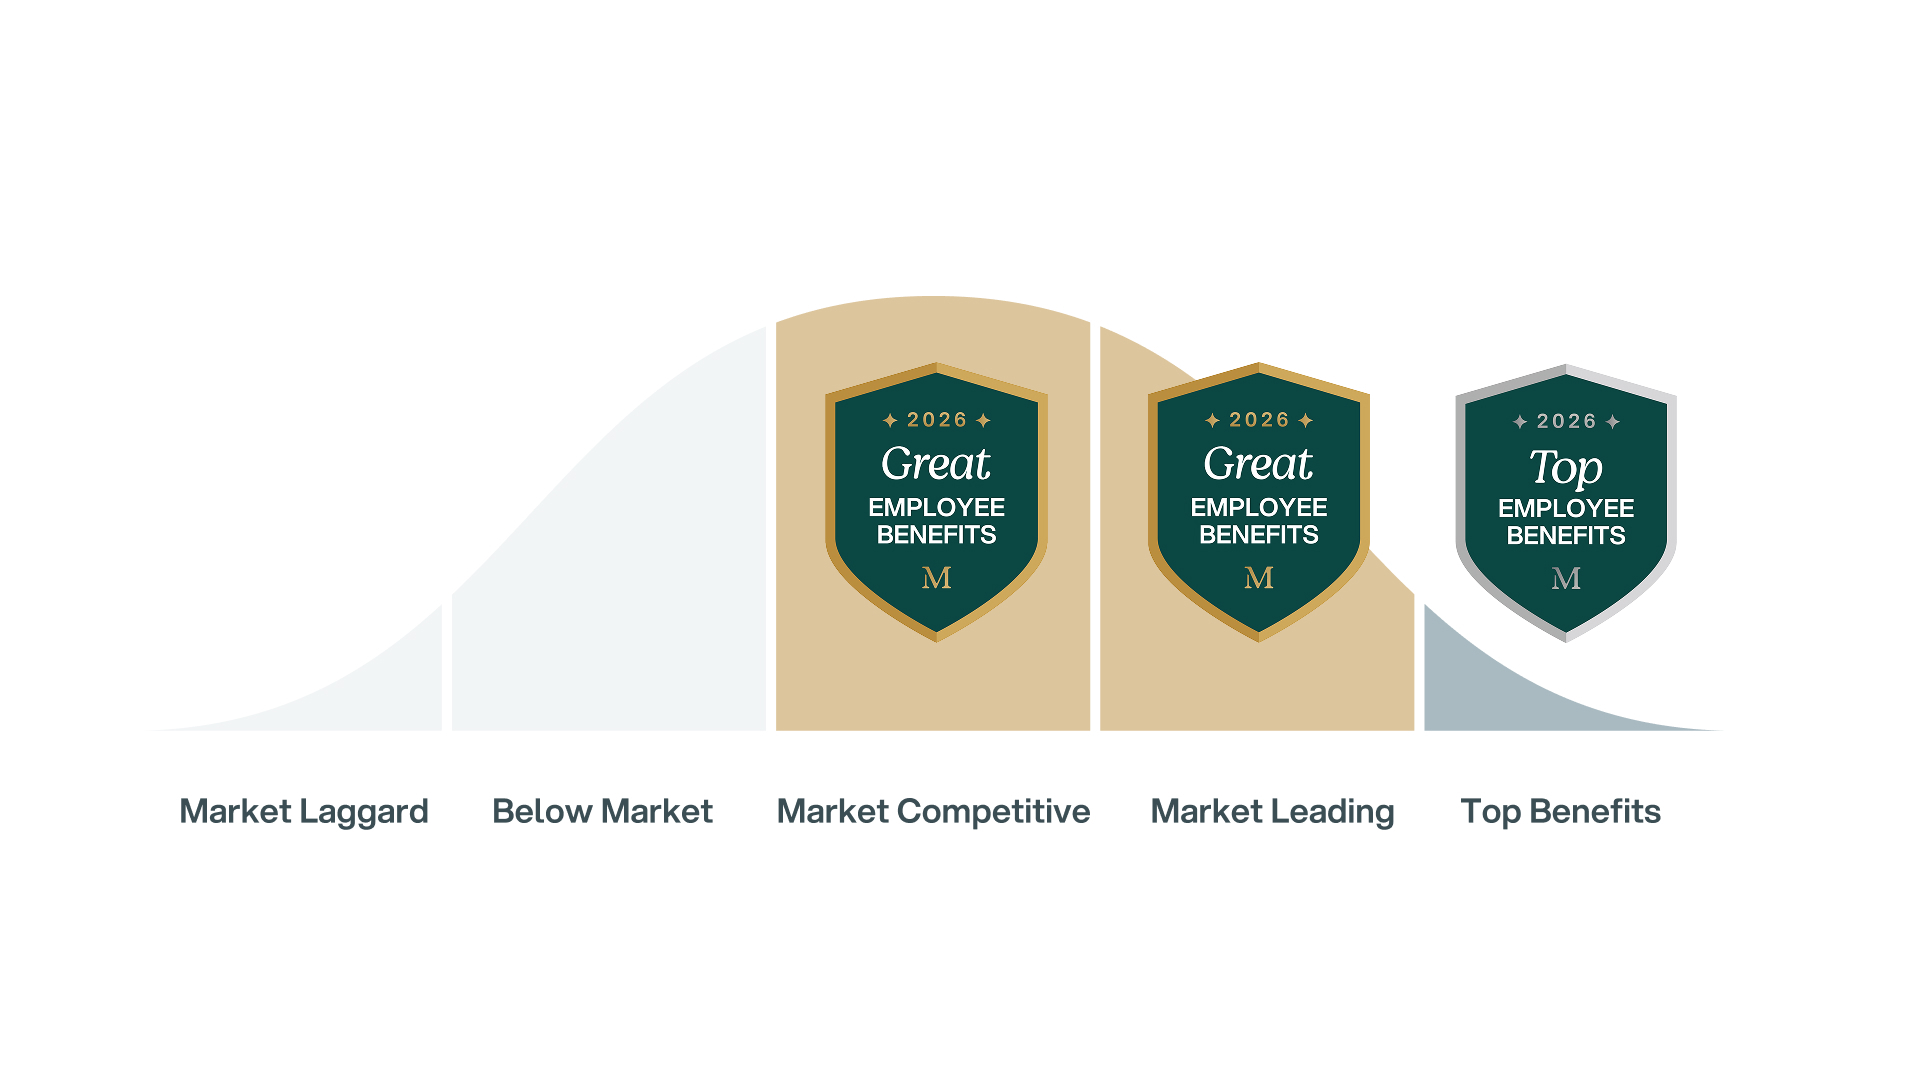
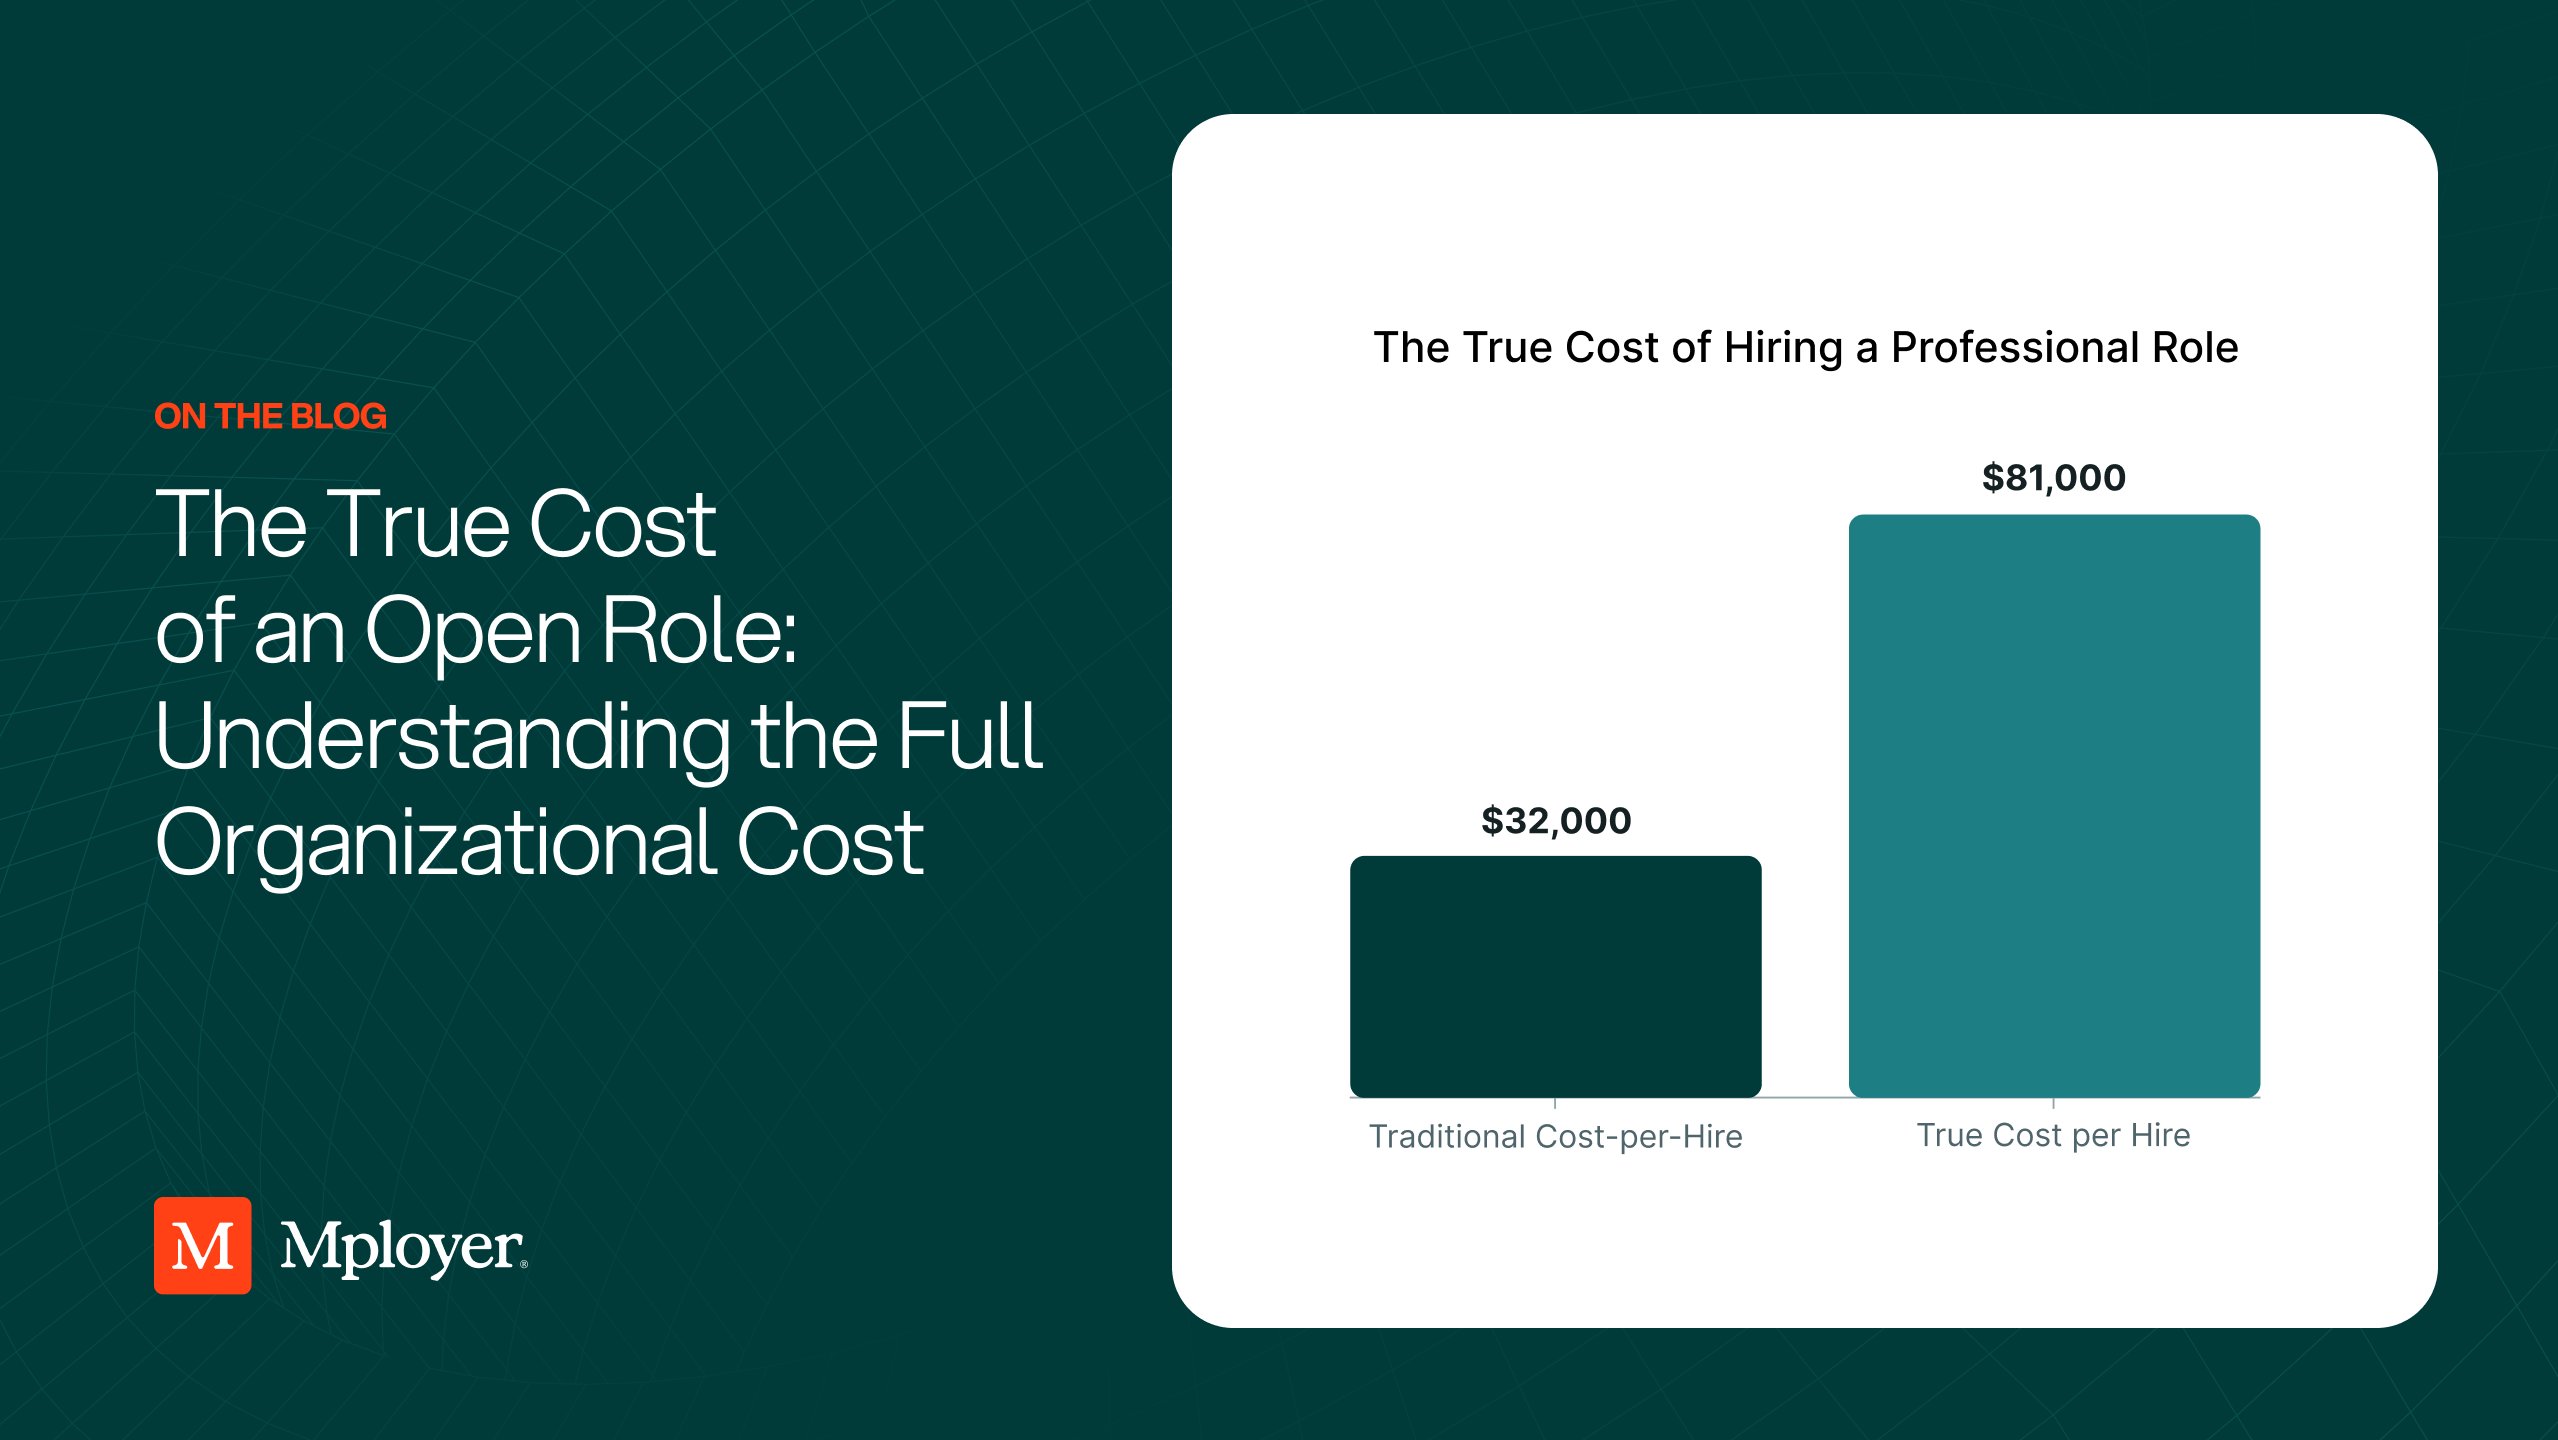
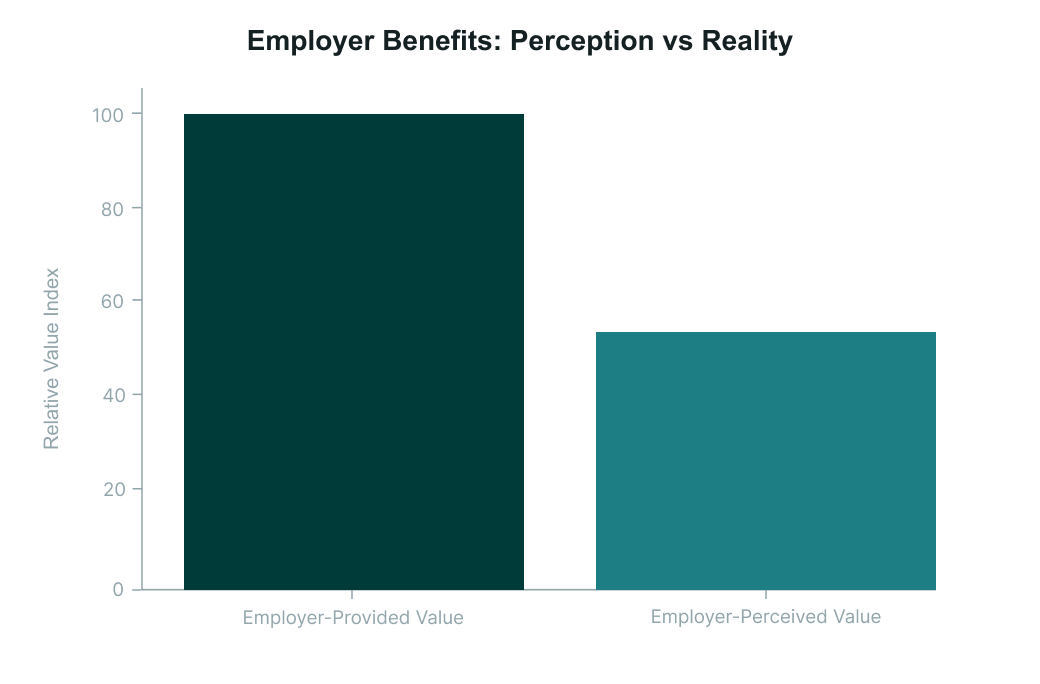
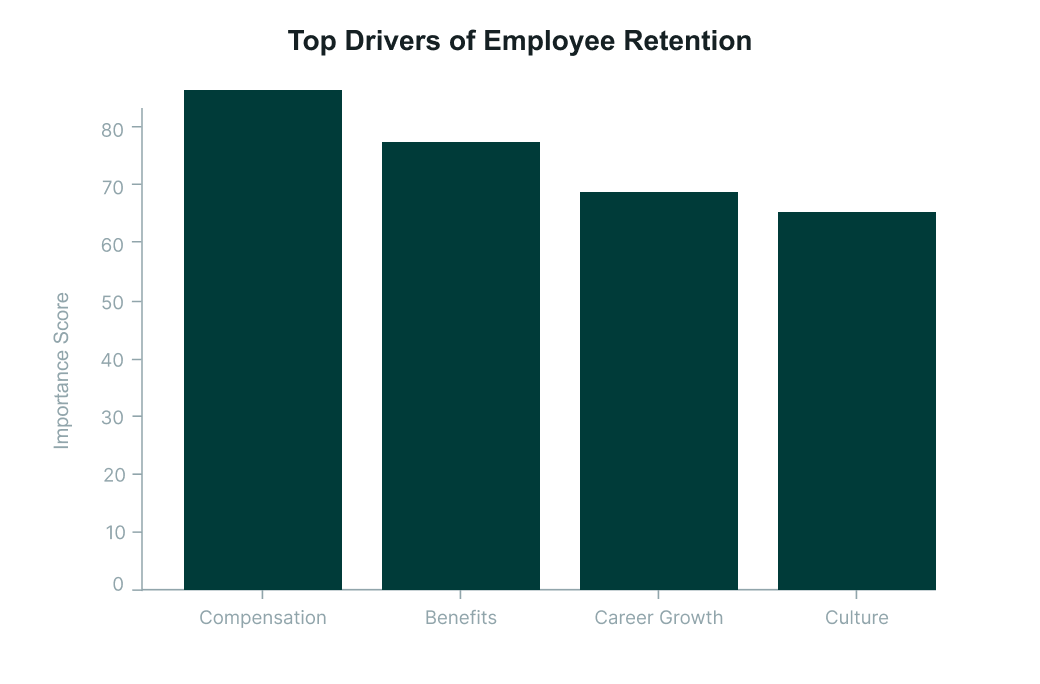
.png)
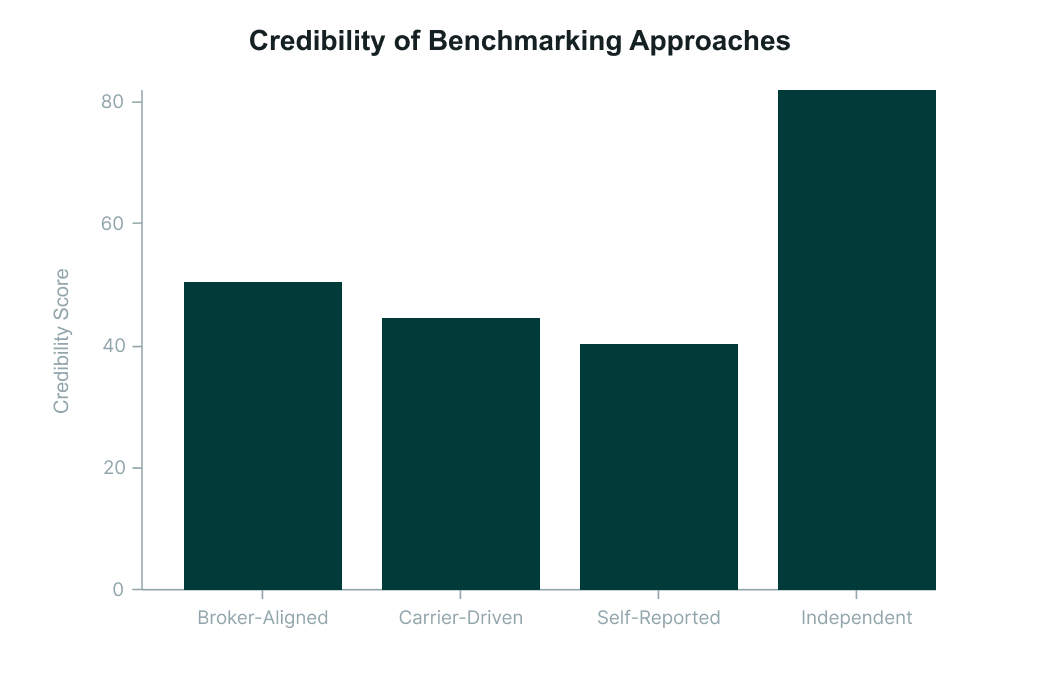

.png)


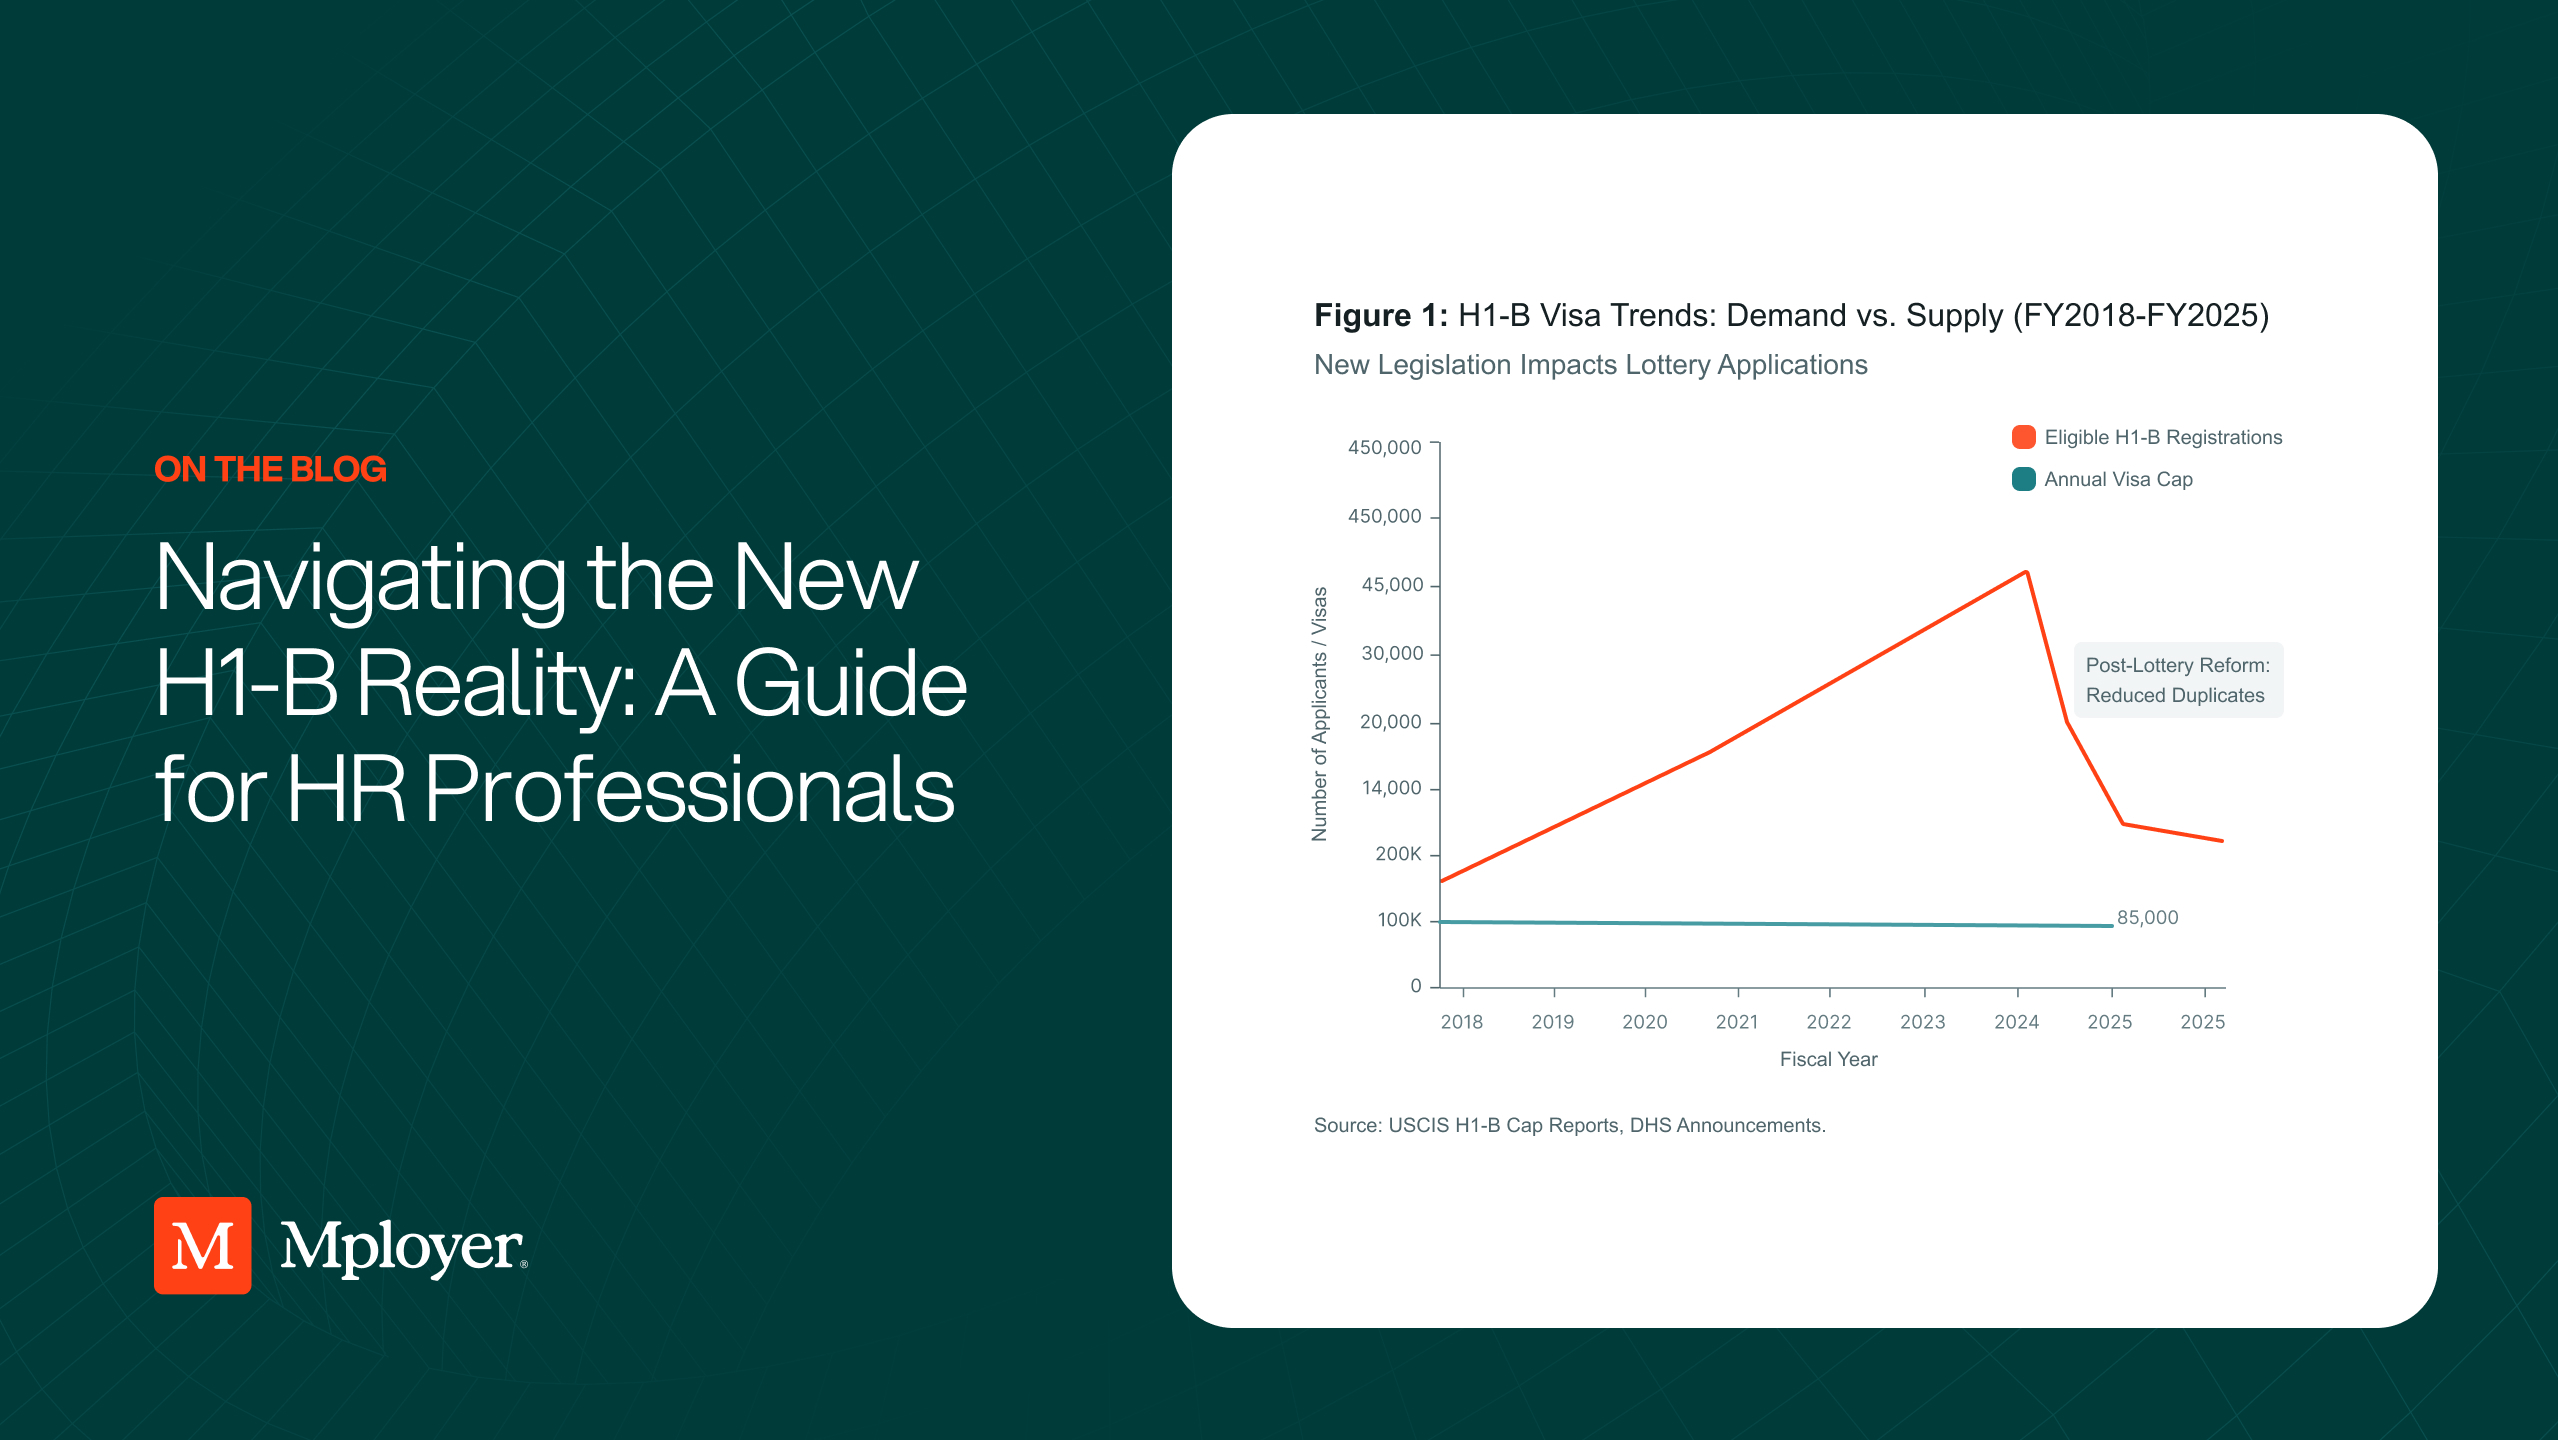


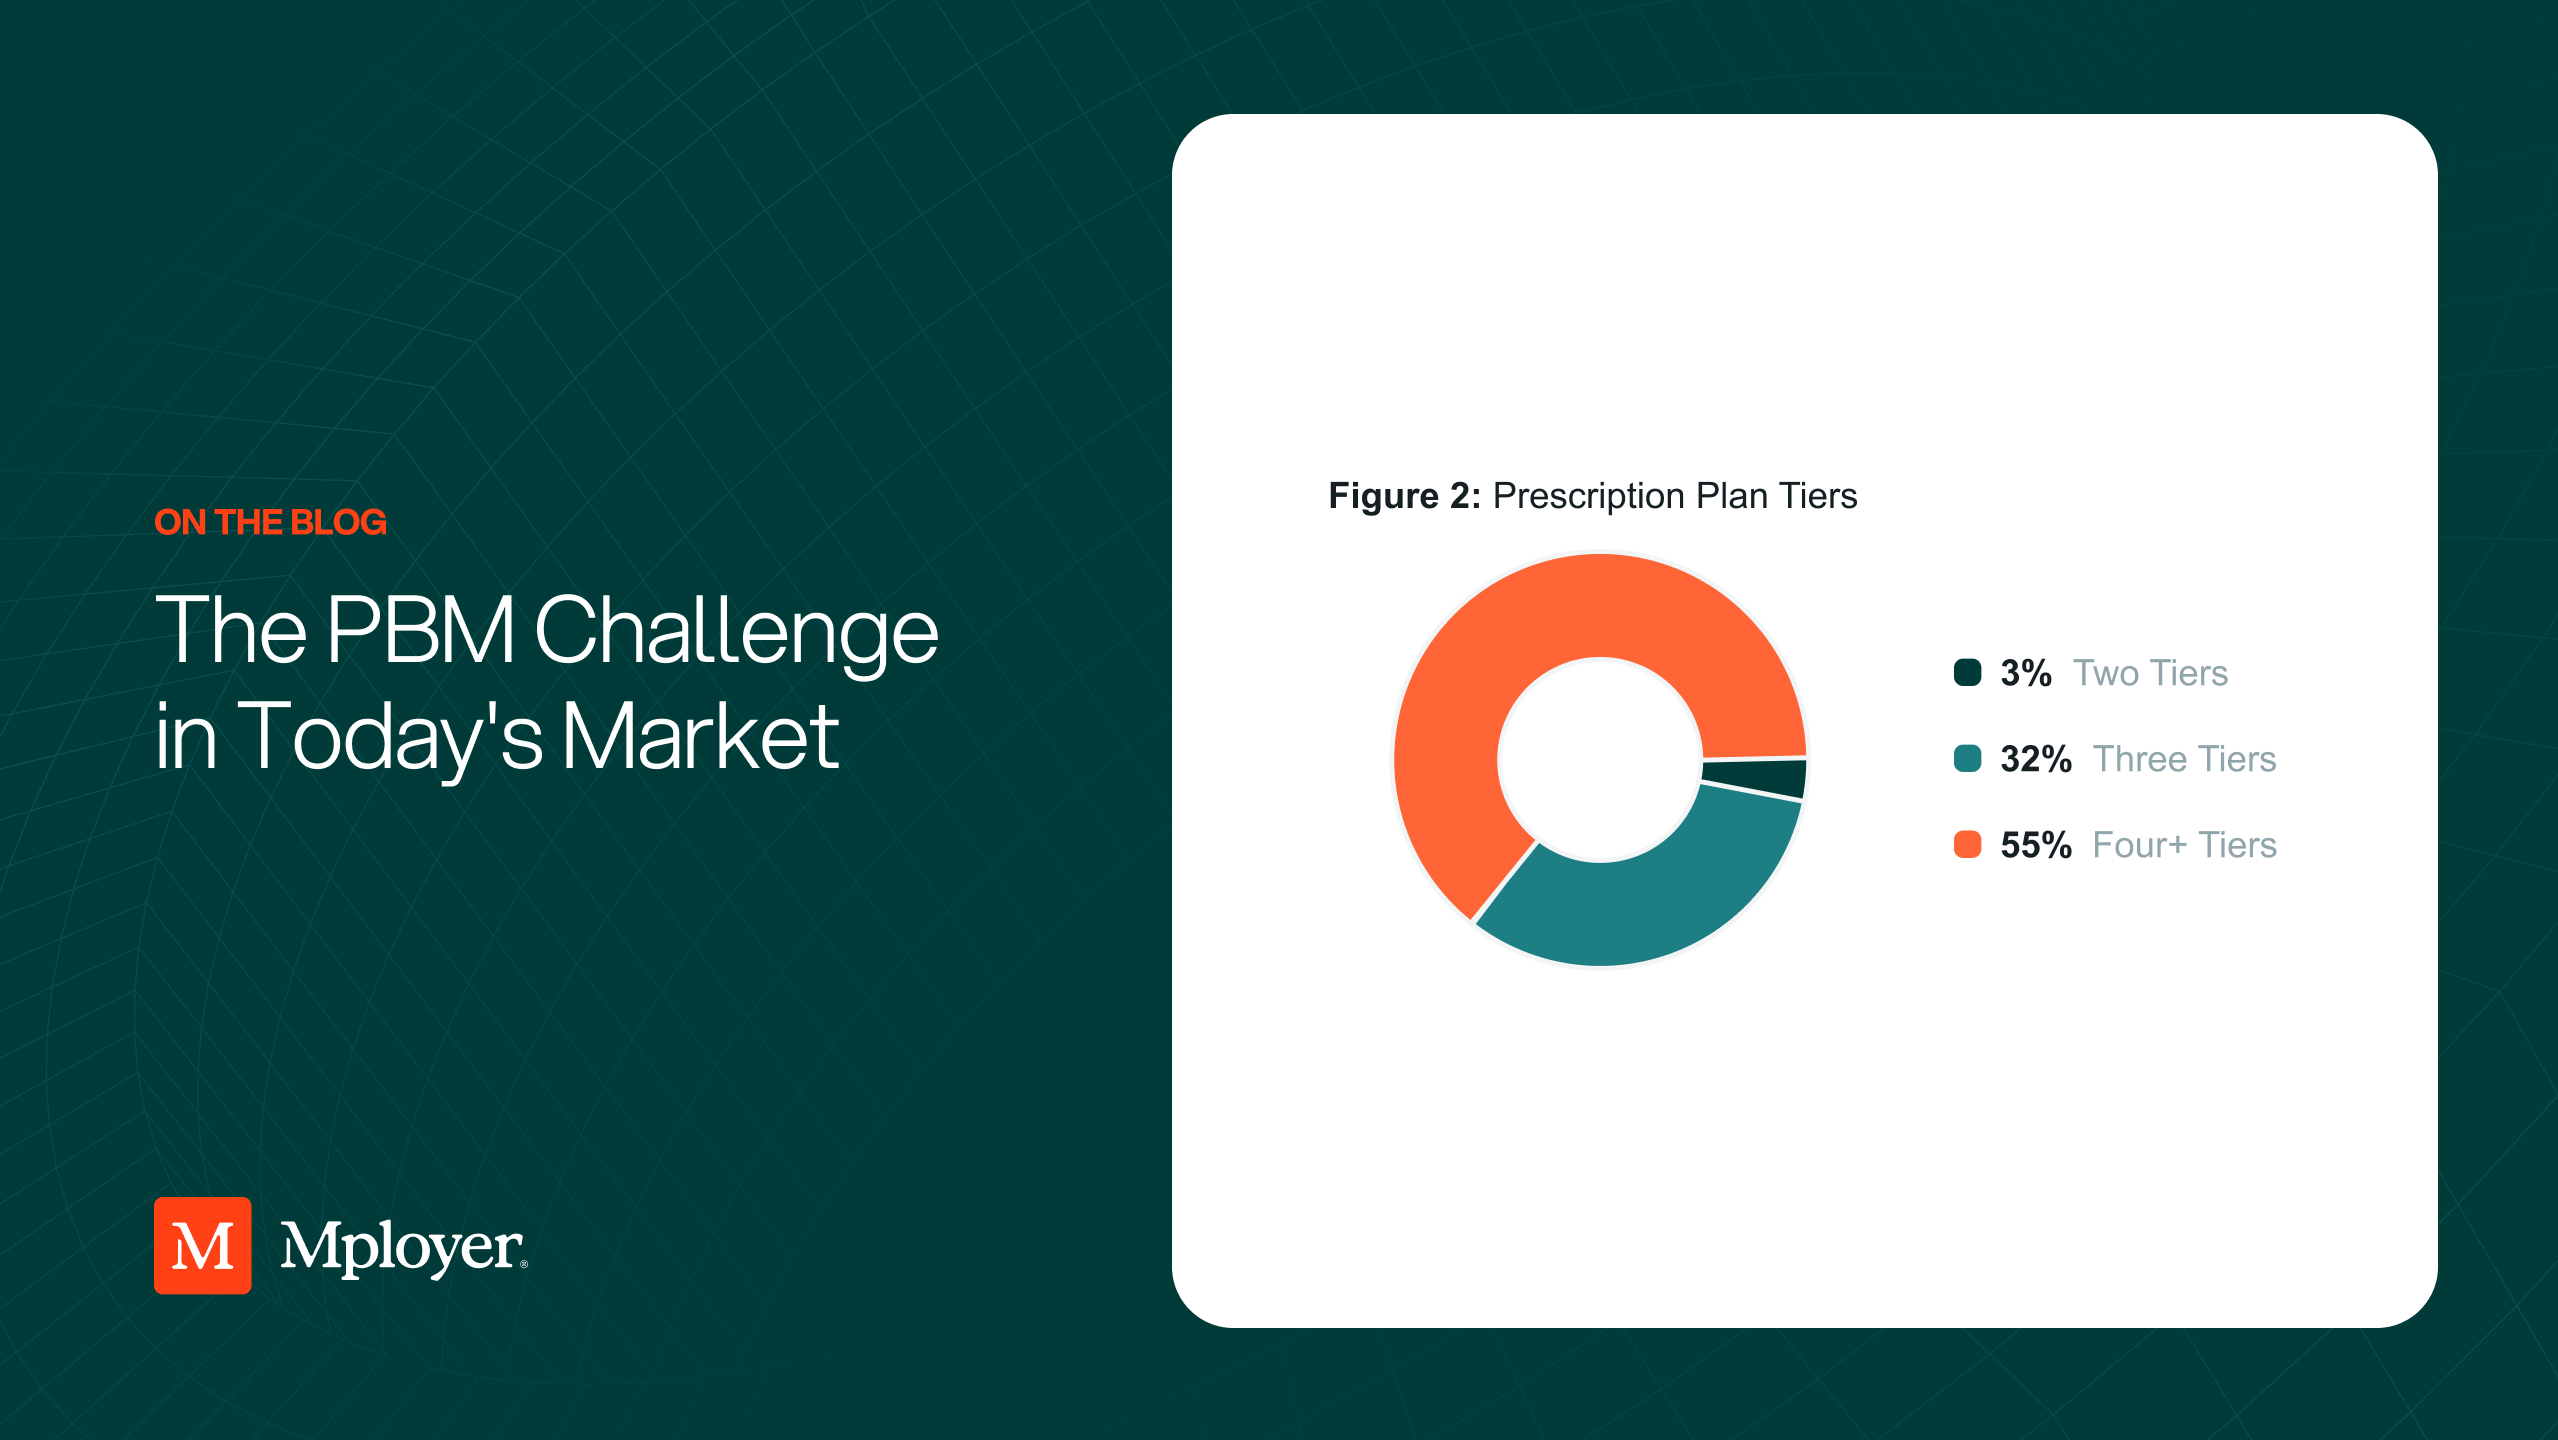
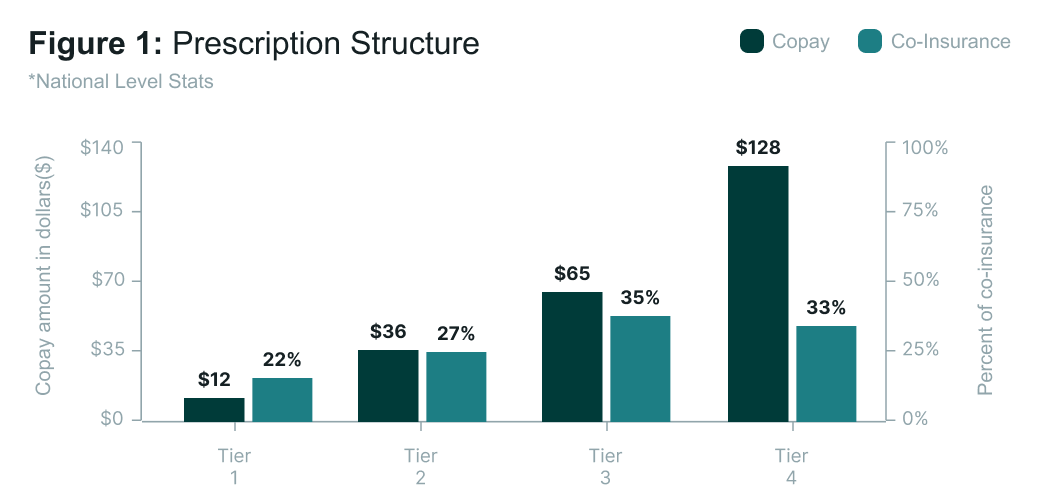
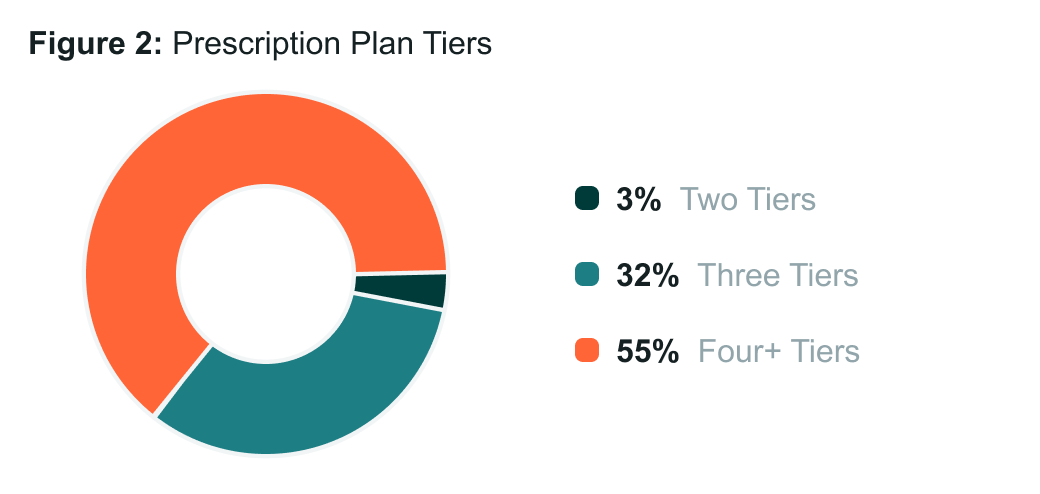
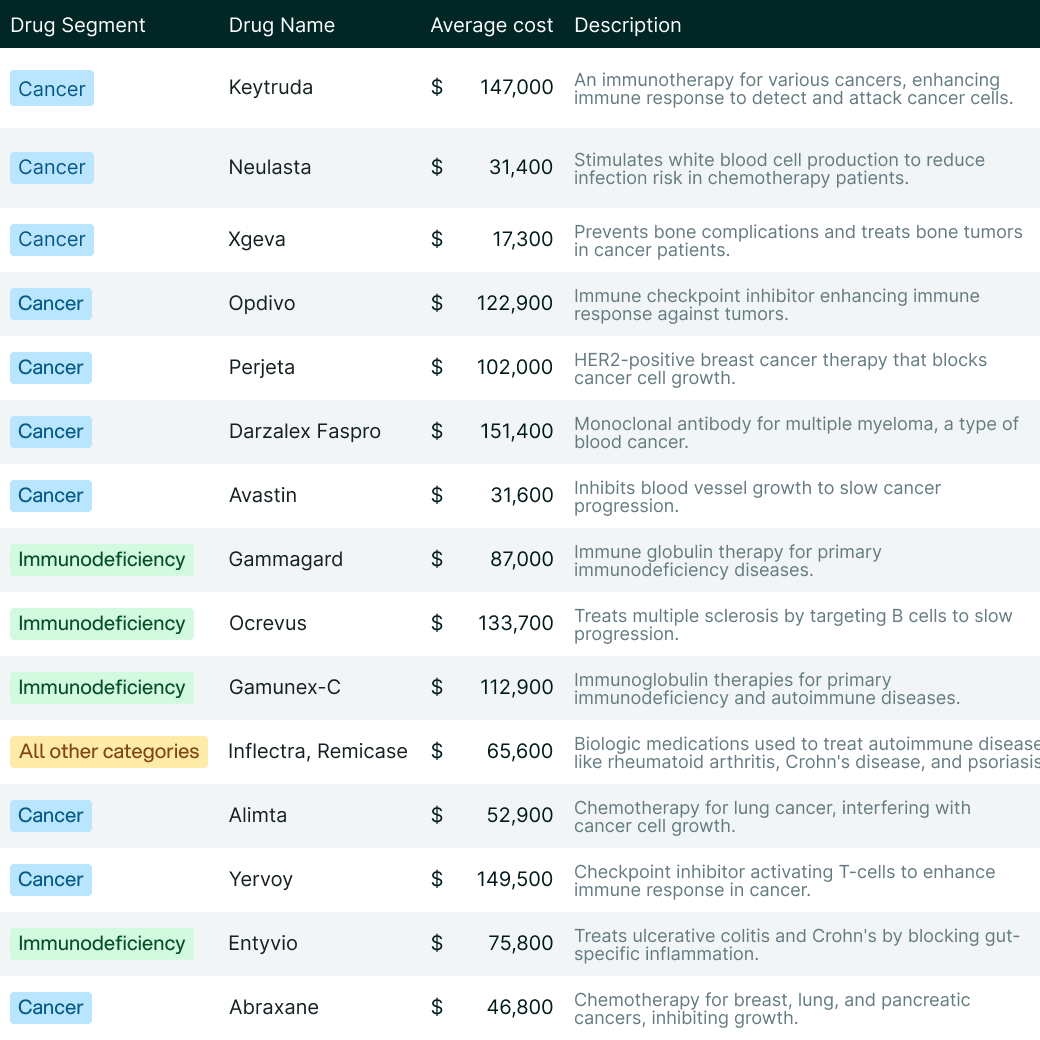


.svg)
.svg)
.svg)
.svg)