

.svg)
Artificial intelligences of one sort or another have been quietly increasing their workloads behind the scenes in a variety of industries for years, but 2023 will likely go down in history as the year that AI finally made the jump from a cutting edge technology to a revolutionary one.
While there still seems to be a long way to go before a generalized artificial intelligence that’s capable of seamlessly mirroring human functionality is developed, AI with more specialized uses coupled with processing powers/speeds far beyond human capabilities have already hit the market and are in the process of restructuring operations at companies all over the world.
The insurance brokerage business is no exception, of course, with AI well-positioned to reshape the industry through the automation of many time-consuming tasks, for one, with significant improvements in efficiency already being reaped by the companies that have been early adopters in the AI space.
While much of concern around AI often involves lost jobs and the devaluation of human labor, which are certainly valid fears and can potentially pose significant risks to current business, social, and governmental frameworks (if those systems do not evolve alongside the development of AI in a complementary way), there are of course advantages to be gained for the workers who utilize these emerging technologies beyond the benefits to company bottom lines. For example, insurance brokers who have incorporated AI into their data entry and processing routines have been able to spend more time focusing on establishing and improving relationships with clients.
When considering AI and its potential impacts on the workplace, it’s also important to recognize what AI can not do well, which includes strategic thinking and negotiation skills -especially the kinds based on years of real world experience - and the ability to establish relationships that are based on trust and mutual benefit.
What AI does do well is provide insurance brokers with data-analysis-based insights, roadmaps for streamlined workflows, and automation for the most mundane necessities of the job, giving brokers more time to do the things that they do best and the things that make them successful in their roles.
Some specific ways that insurance brokers have been putting artificial intelligence to work to the benefit of their business are via improved customer service platforms and through increased risk management proficiency, which can both lead to a significant competitive advantage, especially over less technologically-forward competitors.
In terms of customer service, one of the chief advantages AI is able to provide insurance brokerage offices is the ability to respond faster and more accurately than ever before, which leads to increased customer satisfaction, retention rates, and organic business development. Even more, AI has the power to analyze customer patterns, interactions, and behavior to help brokers know what is most important to them and to better identify customer preferences and needs.
On the risk management front, data analysis again gives AI a significant edge when it comes to better assessing and responding to risks. Through processing huge amounts of information and incorporating that data into risk modeling, AI is able to work in a predictive capacity, helping brokers and their clients to identify and minimize threats before they materialize in many cases, including enhanced fraud detection.
Despite the clear advantages that AI can provide insurance brokerage businesses, there are still a substantial number of insurance brokers that aren’t currently utilizing this technology on the job. That said, the number of insurance brokers taking advantage of the opportunities AI provides has grown rapidly in just the last few years, with more than 50% of brokerages expanding plans to use AI over the course of the past few years.
According to a recent survey from PriceWaterhouseCoopers, 86% of respondents consider AI to be ‘mainstream’ technology at this point, which is great in terms of customer comfort and familiarity interacting with this kind of technology especially for customer service support, but it also means the window to obtain a competitive advantage through general AI is shrinking, so there’s no better time than now to start implementing AI into your business processes if you want to gain an edge. Waiting until later just means you'll likely be behind and trying to catch up at that point.
You can read more about AI in the insurance brokerage space here.

Parental and Maternity Leave: What Employers Need to Know
If there is one area of employee benefits where employer decisions signal values as loudly as economics, it is parental leave. How an organization treats employees who are growing a family, both during the leave itself and in how it structures the financial support, tells candidates and employees a great deal about whether the organization means what it says about supporting its people.
This is Part 2 of our leave benefits series. Part 1 covered the foundations: vacation, paid holidays, sick leave, consolidated vs. non-consolidated plans, workplace flexibility, and the federal and state legal framework. This post goes deeper on maternity and parental leave specifically: what the terms mean, how the programs are structured, what federal and state law requires vs. what employers choose to provide, and how the data from 50,000+ employer plans describes the current state of the market.
The data in this post is at the national all-employer average. The variation beneath that headline, by industry, employer size, and region, is significant. A technology employer in a major metro area competing for mid-career talent faces a very different parental leave benchmark than a regional manufacturer or a healthcare employer in a mid-size market. Both contexts are worth knowing. The national benchmarks in this post show where the floor and the ceiling are. Knowing where your specific cohort sits requires a custom comparison.
Key Terms Every Benefits Decision Maker Should Know
What the Law Requires: Federal and State Baseline
Federal FMLA
Federal FMLA, covered in depth in Part 1, provides the baseline: up to 12 weeks of unpaid, job-protected leave for the birth, adoption, or foster placement of a child. This applies to employers with 50 or more employees. The critical word, again, is unpaid. FMLA does not require the employer to pay anything during parental leave. It only requires that the job be protected and that group health insurance continue during the leave period on the same terms as if the employee had not taken leave.
FMLA also applies to both parents, which is a point often overlooked. The non-birth parent, whether an adoptive parent, a same-sex partner, or a non-birth parent of any kind, is entitled to the same 12 weeks of unpaid job protection under federal FMLA as the birth parent, assuming all eligibility requirements are met.
State Paid Family Leave Programs
The paid leave piece, when it exists at state level, comes from state paid family and medical leave programs. These are state-administered insurance programs that pay a wage replacement benefit, typically 60 to 90 percent of the employee’s wage up to a weekly cap, to employees on qualifying parental or family leave. The most established programs are in California, New Jersey, New York, Washington, Massachusetts, Connecticut, Oregon, Colorado, Rhode Island, and the District of Columbia, with additional states phasing in programs in the coming years.
These programs are funded through payroll contributions, typically deducted from employee wages, sometimes matched by employers. The benefit is paid by the state program, not directly by the employer, though the employer is responsible for administering eligibility, managing payroll deductions, and coordinating the state benefit with any employer-provided leave. Employers in states with paid leave programs should understand how the state benefit interacts with their own leave policy, including whether employees are required or permitted to use accrued PTO concurrently with state paid leave.
Pregnancy Discrimination and PUMP Act
Two additional federal laws shape the employer’s obligations around pregnancy and parental leave. The Pregnancy Discrimination Act prohibits employers with 15 or more employees from discriminating against employees on the basis of pregnancy, childbirth, or related conditions. The PUMP for Nursing Mothers Act, enacted in 2022, requires employers to provide reasonable break time and a private space for nursing employees to express breast milk for up to one year after the child’s birth. These are separate from FMLA and apply to a broader range of employers.
Maternity Leave: What the National Data Shows

68% of employers nationally offer dedicated maternity leave beyond statutory short-term disability. 32% do not, meaning those employees rely entirely on STD for any paid income during leave, typically six to eight weeks at whatever percentage the disability plan covers. Among the 68% who do offer dedicated maternity leave, eight weeks of additional paid leave is the most common duration at 31%, with twelve weeks close behind at 26%. Together those two categories account for more than half of all programs. 16% of employers offer thirteen or more weeks of additional paid leave, placing them at the generous end of the market nationally.
Reading this data correctly requires understanding what these weeks represent. The duration bars in the chart show the additional paid leave added on top of disability coverage, not the total leave period. An employee at an employer offering eight weeks of additional leave on top of a six-week STD benefit has fourteen weeks of paid leave total before any unpaid FMLA job protection kicks in. That total is what candidates and employees are actually comparing when they evaluate a parental leave program.
Disability Payment Rates and Top-Off: The Variables That Define Generosity
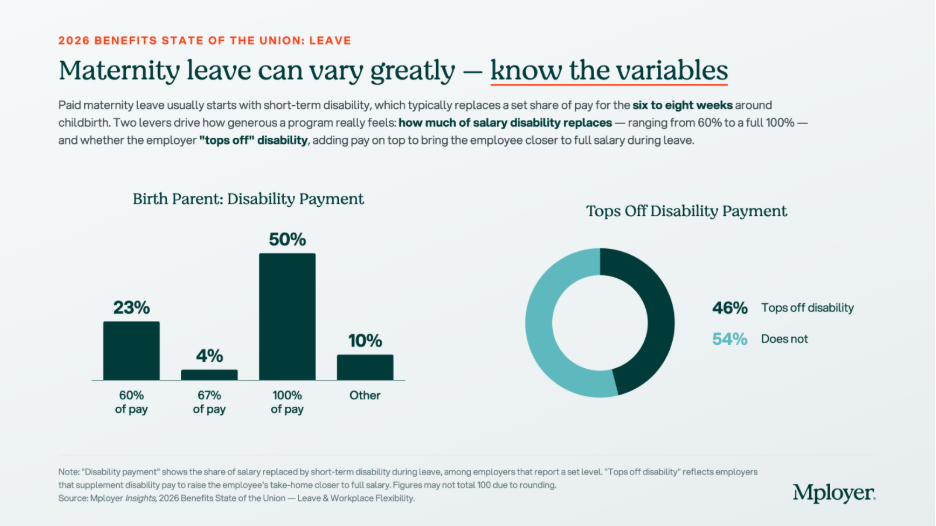
The chart above tells the real story of how financially supportive maternity leave programs are. On the disability payment rate, the market has split sharply: 50% of employers with a defined disability payment rate pay 100% of salary during the disability period, while 23% pay the traditional 60% of salary. The gap between these two is meaningful. An employee earning $80,000 per year on a six-week disability period at 60% of pay receives approximately $5,538. At 100% of pay, she receives $9,231. That $3,693 difference is real money for a new parent.
The top-off picture is similarly divided. 46% of employers supplement the disability benefit to bring the employee closer to full salary. 54% do not. An employer who pays STD at 60% of salary and does not top off is providing the minimum financial support that a standard disability plan delivers. An employer who pays 100% of salary or who tops off a 60% plan to full pay is making a meaningfully different statement about how much they value employees during one of the most important transitions of their lives
The combination of these two variables, disability payment rate and top-off, is what candidates from competitive talent markets are increasingly asking about directly. It is not enough to say your company offers paid maternity leave. The question they are asking is: how much will I actually receive, and for how long?
Non-Birth Parent Leave: A Growing Expectation, Not Yet a Standard

41% of employers nationally offer dedicated non-birth parent leave, meaning leave specifically provided for partners, fathers, adoptive parents, and same-sex parents who are not the birth parent. 59% do not. Among those who do offer non-birth parent bonding leave, twelve weeks is the most common duration at 32%, with six weeks next at 23%. The 30% in the Other category reflects the wide variation in how these programs are structured, including tiered policies, programs that vary by tenure, and policies that provide different durations based on the type of parental event.
The gap between maternity and non-birth parent leave offer rates, 68% vs. 41%, reflects the historical pattern of parental leave being designed primarily around biological motherhood and disability recovery. That framing is shifting. Candidates across generations, and particularly millennial and Gen Z candidates who are entering or approaching family formation years, are increasingly evaluating parental leave as a package: not just what the birth parent receives, but whether the partner can also be present. An employer offering generous maternity leave but no paternity or bonding leave is offering a program that structurally assumes only one parent takes significant time away, which does not match how many families today want to organize the early months of a child’s life.
Non-birth parent leave also has a practical retention implication. Employees who take bonding leave and feel supported by their employer during it are more likely to return to work and remain engaged. The data on parental leave and retention consistently shows that leave policies affect long-term retention rates, not just initial job acceptance.
Fertility and Adoption Benefits: Rare but Rising

28% of employers nationally offer IVF coverage as part of their medical or family-building plan. 11% offer adoption assistance. Both numbers reflect concentrated adoption among larger employers and in specific geographies and industries, particularly technology, financial services, and professional services employers in major metropolitan markets. Coverage terms, lifetime maximums, and eligibility criteria vary widely among the minority of employers who offer these benefits, making direct comparisons difficult without plan-level detail.
IVF treatment costs can reach $15,000 to $30,000 or more per cycle, with most patients requiring multiple cycles. For employees who need IVF to build a family, employer coverage is not a luxury benefit. It is a financial necessity that directly affects whether they can afford to pursue treatment at all. For employers, IVF coverage is a high-signal benefit: it communicates investment in the full arc of an employee’s family life, not just the period after a child arrives. Among employers competing for talent in industries where IVF coverage has become a common offering, its absence is noticed.
Adoption assistance typically covers qualified adoption expenses such as legal fees, agency fees, home study costs, and travel, up to an annual maximum that varies by employer. The IRS allows employers to provide up to $17,280 in adoption assistance per child tax-free in 2026. Adoption leave policies, separate from adoption assistance, are covered under FMLA for qualifying placements and under many state paid leave programs as well.
Parental Leave as a Talent and Retention Strategy
Parental leave is one of the most emotionally charged benefit decisions a candidate makes. It is also one of the most concrete. Unlike dental coverage or life insurance multiples, parental leave generates direct, personal financial calculations: how much will I receive, for how long, and what will that mean for my family’s finances and my ability to be present during a period that does not repeat?
Employers who have invested in a strong parental leave program and are not talking about it are leaving one of their best recruiting assets on the table. A program that offers twelve or more weeks of additional paid leave, a top-off to full salary, and bonding leave for non-birth parents is well above the national market on all three dimensions. That is a specific, documentable competitive advantage in candidate conversations, offer letters, and employer brand communications. It does not require marketing language. It requires knowing what your program provides and being willing to state it clearly.
Employers who are uncertain about where their program stands face a different challenge. If you are not sure whether your maternity leave duration, your disability payment rate, your top-off policy, and your non-birth parent bonding leave compare favorably to the employers recruiting against you, you cannot use those elements as differentiators, and you cannot address them strategically at renewal. The national benchmarks in this post give you the market context. The custom cohort analysis Mployer builds from employers matching your industry, region, and size gives you the specific comparison that matters for your talent market.
Parental leave policy is not static. The market has moved meaningfully in the past five years and continues to move. Employers who last reviewed their parental leave program three or more years ago are likely benchmarking against a standard that has already shifted. Knowing where you stand today is the starting point for deciding whether to maintain, improve, or actively use your program as a recruiting asset.
See how your parental leave and full benefits package compare to your custom cohort at MployerAdvisor.com.
Sources
Mployer Insights, 2026 Benefits State of the Union: Leave & Workplace Flexibility. Source: Mployer Insights analysis of 50,000+ employer benefit plans. All Nation Average.
Family and Medical Leave Act of 1993 (FMLA), 29 U.S.C. Section 2601 et seq. Applies to employers with 50+ employees.
Pregnancy Discrimination Act, 42 U.S.C. Section 2000e(k). Applies to employers with 15 or more employees.
PUMP for Nursing Mothers Act (2022), amending the Fair Labor Standards Act. Applies to most employers.
State paid family leave programs: California (SDI/PFL), New Jersey (TDI/FLI), New York (NY DBL/PFL), Washington (WA PFML), Massachusetts (MAPFML), Oregon (OPFML), Colorado (FAMLI), Rhode Island (TCI), Connecticut (CTPFML), District of Columbia (DC PFML).
IRS adoption assistance exclusion 2026: $17,280 per child, per IRS Notice 2025-61.
Leave Is the Benefit Employees Feel Every Week
Mployer rates employer benefit plans across four pillars: Medical, Ancillary, Leave, and Retirement. Of the four, leave carries the lowest direct cash cost to the employer outside of the opportunity cost of time away from work. And yet leave is consistently among the highest-valued benefits employees cite, particularly among workers entering the workforce in the past two decades. For younger employees who grew up with greater flexibility as an expectation rather than a perk, PTO policies, remote work options, and holiday calendars are not peripheral considerations. They are factors that influence job acceptance decisions, day-to-day job satisfaction, and the calculus of whether to stay or leave.
This is Part 1 of a two-part series on leave benefits. This post covers the foundational elements: vacation, paid holidays, sick leave, consolidated vs. non-consolidated leave structures, workplace flexibility, and the legal framework that governs when leave is required vs. when it is discretionary. Part 2 will go deep on maternity and parental leave, including benefit duration, disability payment interaction, top-off provisions, and how this rapidly evolving category varies by industry and employer size.
The Legal Framework: What Is Required and What Is a Choice
Before reviewing the benchmarks, it is important to understand the distinction between leave that employers are legally required to provide and leave that is entirely discretionary. Many employers conflate these, either overclaiming legal mandates that do not apply to them or unknowingly underdelivering on ones that do.
FMLA: The Federal Floor
The Family and Medical Leave Act of 1993 (FMLA) is the primary federal law governing employee leave. It requires covered employers to provide eligible employees with up to 12 weeks of unpaid, job-protected leave per year for qualifying reasons, including the birth or adoption of a child, a serious health condition of the employee or a close family member, or qualifying military exigencies. A critical word in that sentence is unpaid. FMLA guarantees job protection and continuation of health insurance during leave. It does not require the employer to pay the employee during that time.
FMLA applies to employers with 50 or more employees within 75 miles. Eligible employees must have worked for the employer for at least 12 months and logged at least 1,250 hours in the prior year. Employers below 50 employees are not covered by federal FMLA, which is a meaningful distinction for the substantial share of small employers in the national workforce.
State Leave Laws: A Patchwork Expanding Rapidly
State leave laws have multiplied significantly over the past decade and frequently go beyond FMLA in scope, coverage thresholds, or paid leave requirements. Several categories are worth understanding:
The practical implication for any multi-state employer: your leave compliance obligation is not a single federal standard. It is the most protective standard that applies in each jurisdiction where you have employees. Staying current requires active monitoring as state laws continue to evolve.
Paid Holidays: No Federal Requirement for Private Employers
Here is a fact that surprises many employees and even some HR professionals: private sector employers in the United States have no federal legal obligation to provide any paid holidays. The list of federal holidays, which includes New Year’s Day, Independence Day, Thanksgiving, Christmas, and others, applies to federal government employees. Private employers are entirely free to choose which holidays to observe, how many to provide, and whether they are paid.
In practice, the market has established strong norms around holiday calendars. Employers who observe fewer than the common major federal holidays face a competitive disadvantage in recruiting. But the specific holidays offered, the total number, and whether floating holidays or personal days supplement the calendar are all employer-determined choices with real variation in the market.
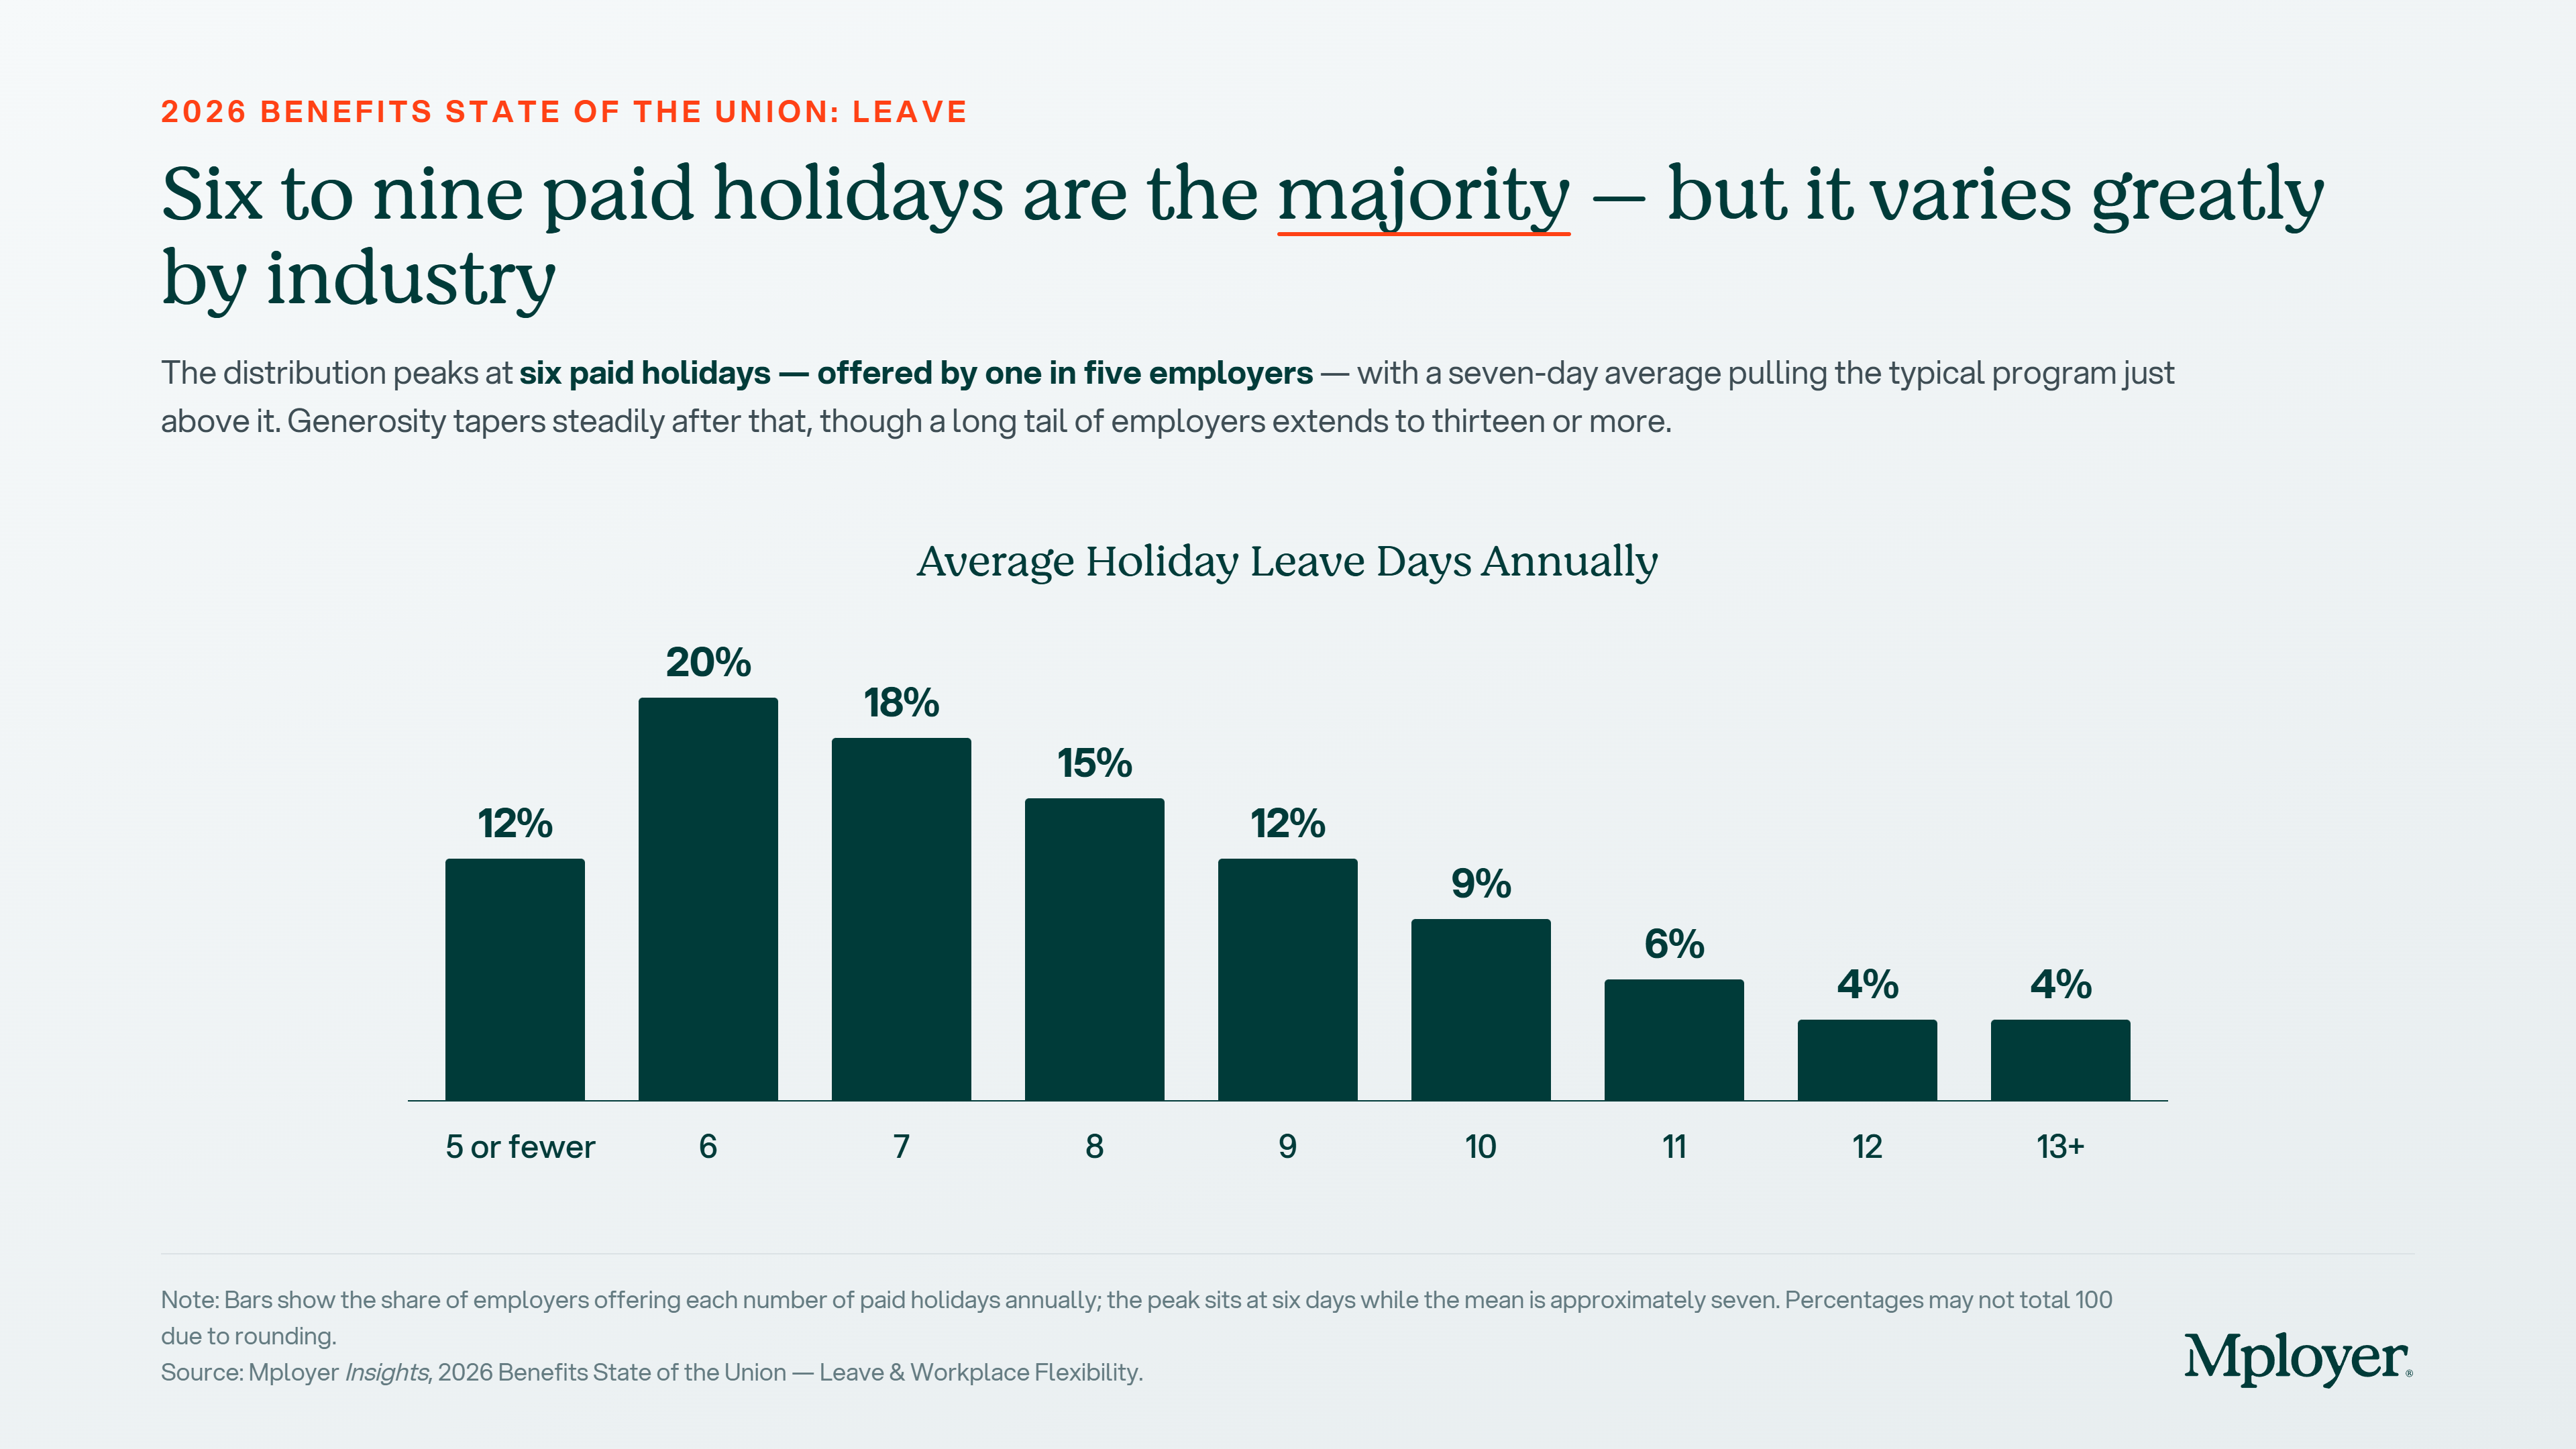
Six paid holidays is the single most common offering nationally, provided by one in five employers. But the distribution spans from five or fewer to thirteen or more, and the seven-day average is pulled upward by generous employers at the top of the range. The practical range of six to nine days covers 65% of employers. An employer offering five or fewer paid holidays is below market in a way that is visible to candidates who are comparing offers. An employer offering ten or more is offering a genuinely above-market benefit that is worth communicating explicitly in recruiting.
It is also worth noting the difference between public and private sector norms. Federal and state government employers typically observe all federal and state holidays, often reaching 11 or more paid days annually. Private employers who compete for talent against government roles, especially in certain regions or professional categories, face a visible gap if their holiday calendar is at the lower end of the private sector range.
Key Terms Every Benefits Decision Maker Should Know
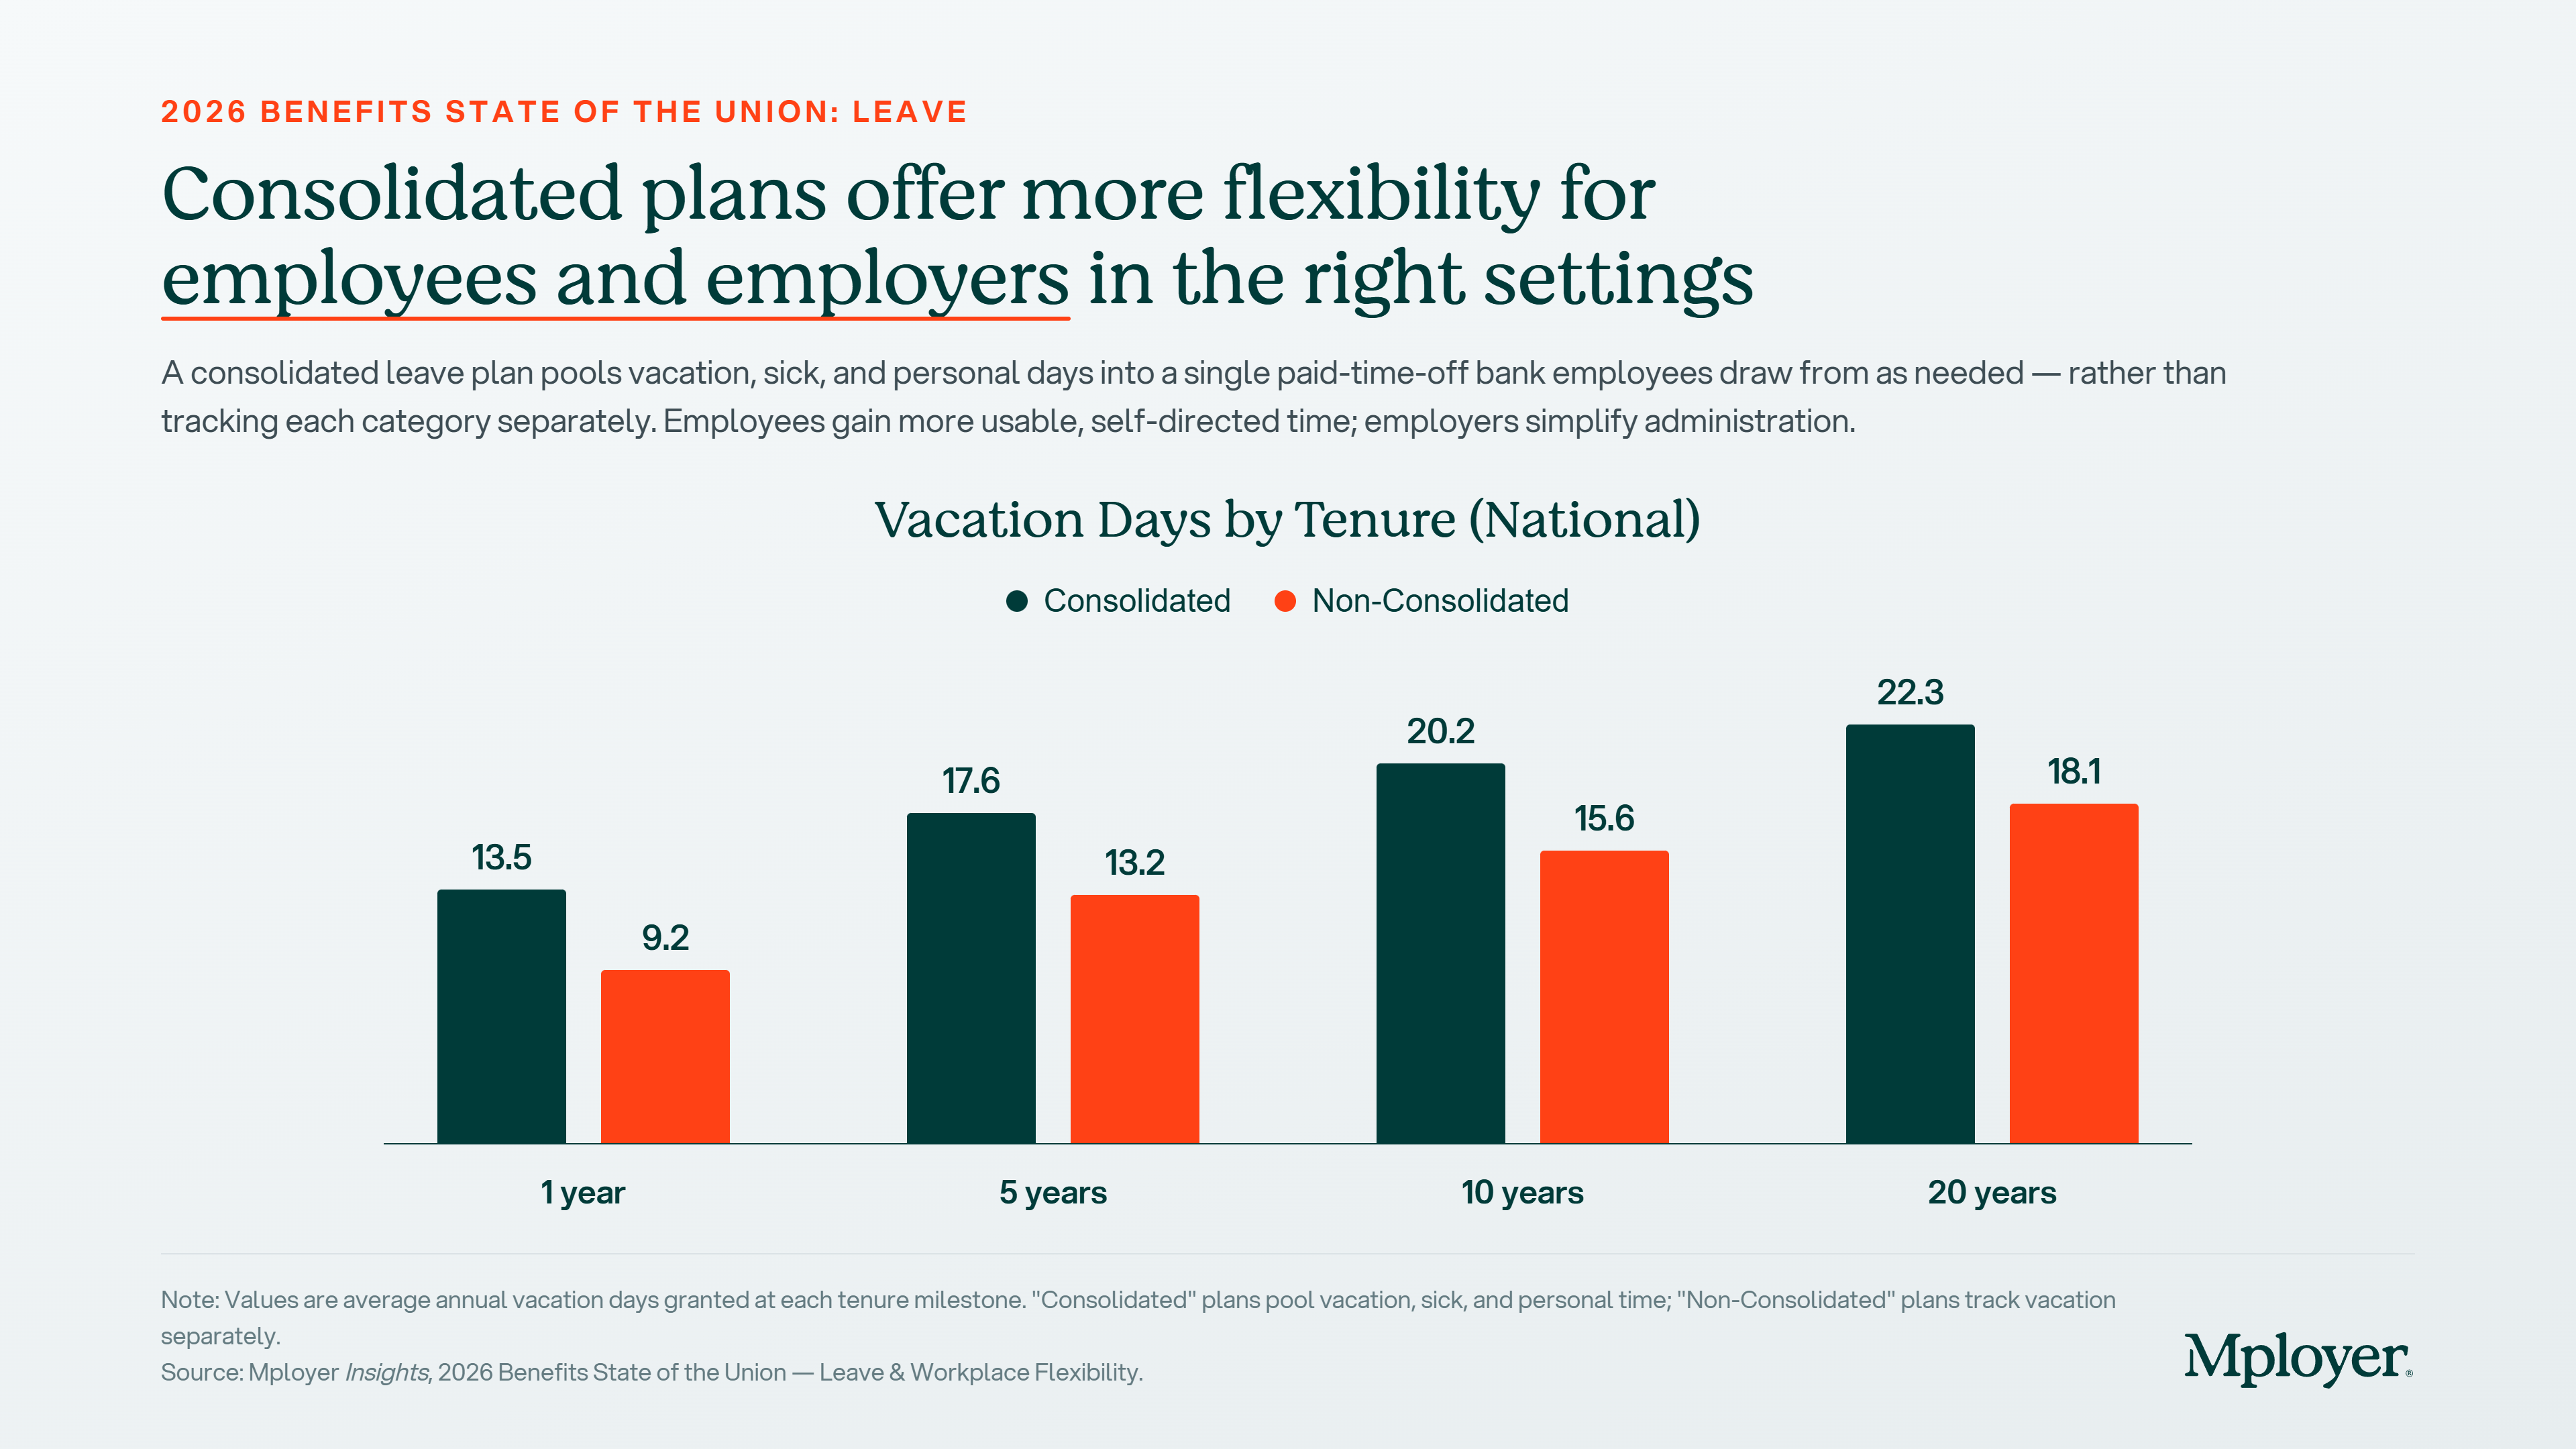
The chart above shows a consistent pattern across all tenure milestones: employees at employers with consolidated leave plans receive meaningfully more vacation days than those on non-consolidated plans. At one year of tenure, the gap is 4.3 days (13.5 consolidated vs. 9.2 non-consolidated). At 20 years, the gap is 4.2 days (22.3 vs. 18.1). This reflects the structural reality that consolidated plans typically set a total PTO balance that includes what would otherwise be split across vacation, sick, and personal categories. The total bank is larger because it is serving multiple purposes.
The tenure progression also matters for employers thinking about leave as a retention tool. An employee at year 5 in a consolidated plan has 17.6 days. Their counterpart at a non-consolidated employer has 13.2. That 4.4-day difference compounds over a career and becomes a meaningful factor in whether a tenured employee considers leaving. Employers who have not benchmarked their vacation accrual schedule by tenure against peers in their industry and size band may not realize how their program compares at the years of service where retention pressure is highest.
Workplace Flexibility: The Post-Pandemic Recalibration
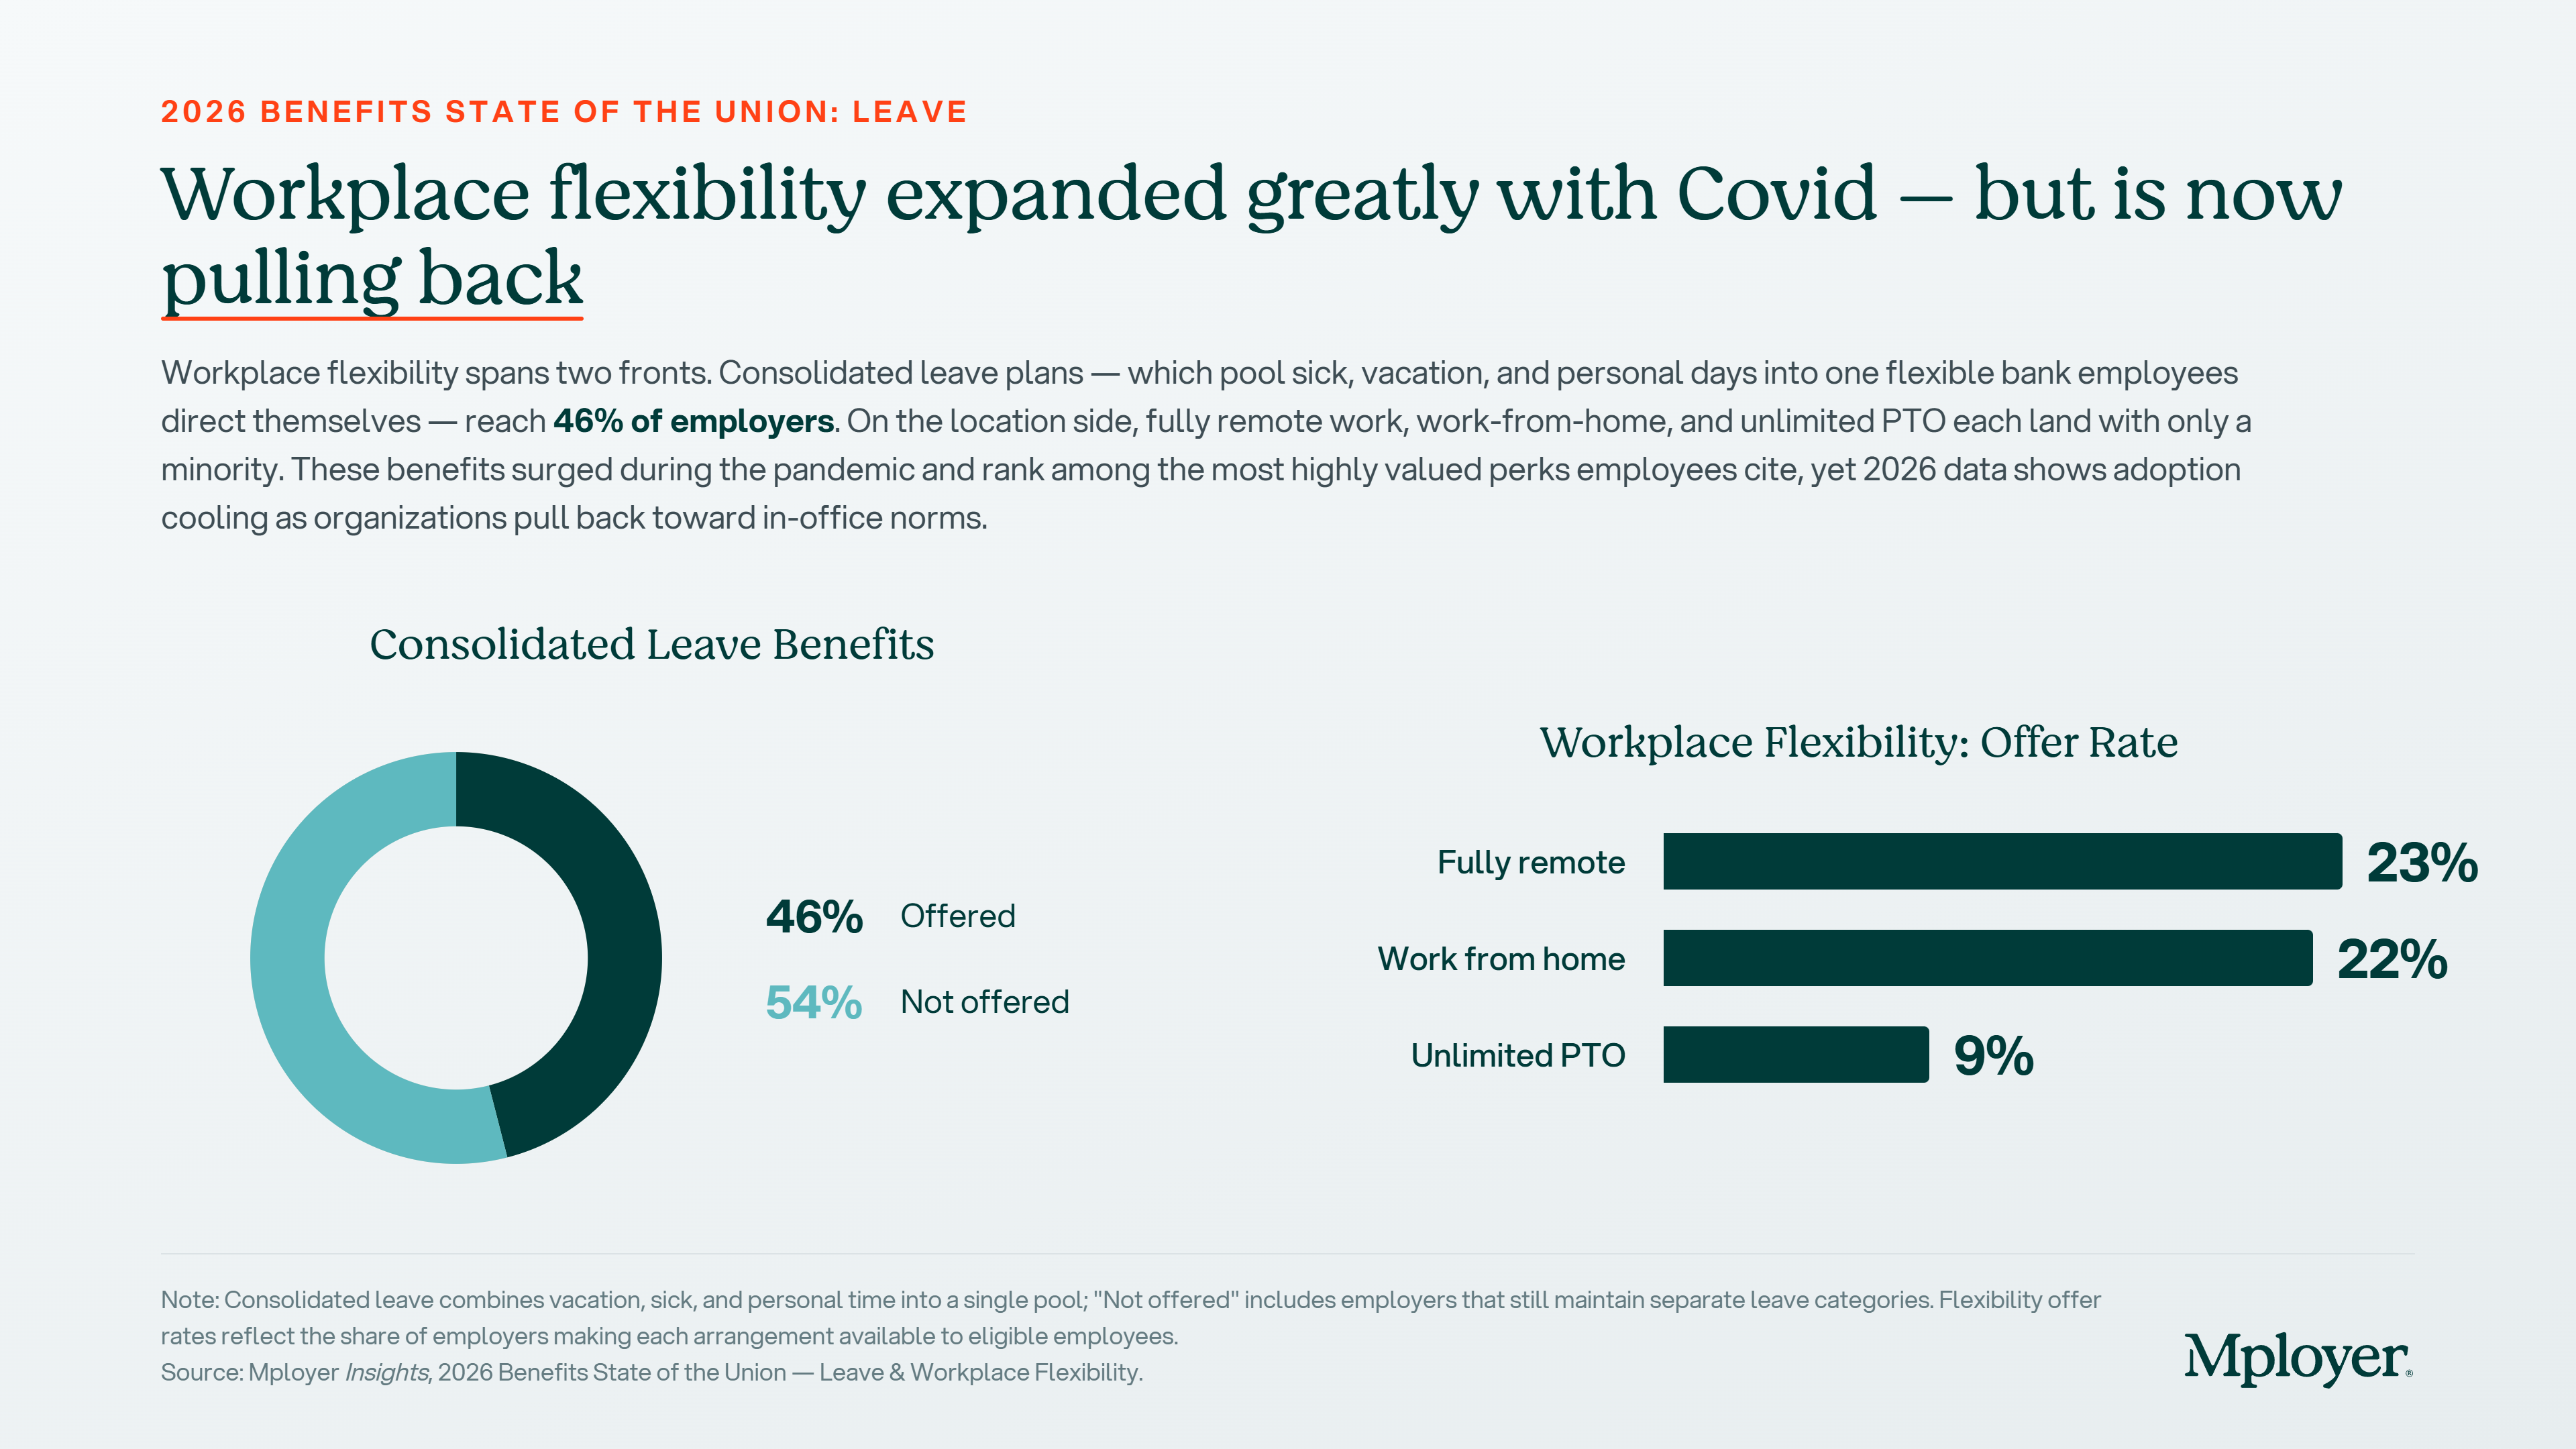
Workplace flexibility surged during the pandemic and became one of the most cited employee preferences in every post-2020 benefits survey. The 2026 data shows the market pulling back from its pandemic peak. Fully remote arrangements are now offered by 23% of employers, work-from-home options by 22%, and unlimited PTO by just 9%. These numbers are lower than what many employees experienced at the height of 2020 to 2022, and that gap between expectation and current market reality is one the most active sources of employee dissatisfaction in leave-related discussions.
For employers, the flexibility picture requires honest self-assessment. If your organization has pulled back from flexibility arrangements that were extended during the pandemic, the competitive context has shifted: the employers who maintained those arrangements are now differentiating on a dimension that is highly visible to candidates. If your business model genuinely requires in-person work, the relevant benchmark is not the fully remote employer but the other employers in your industry and region competing for the same workforce. That is exactly the kind of cohort comparison a custom benchmarking analysis provides.
Sick Leave and Carryover: The Details That Matter
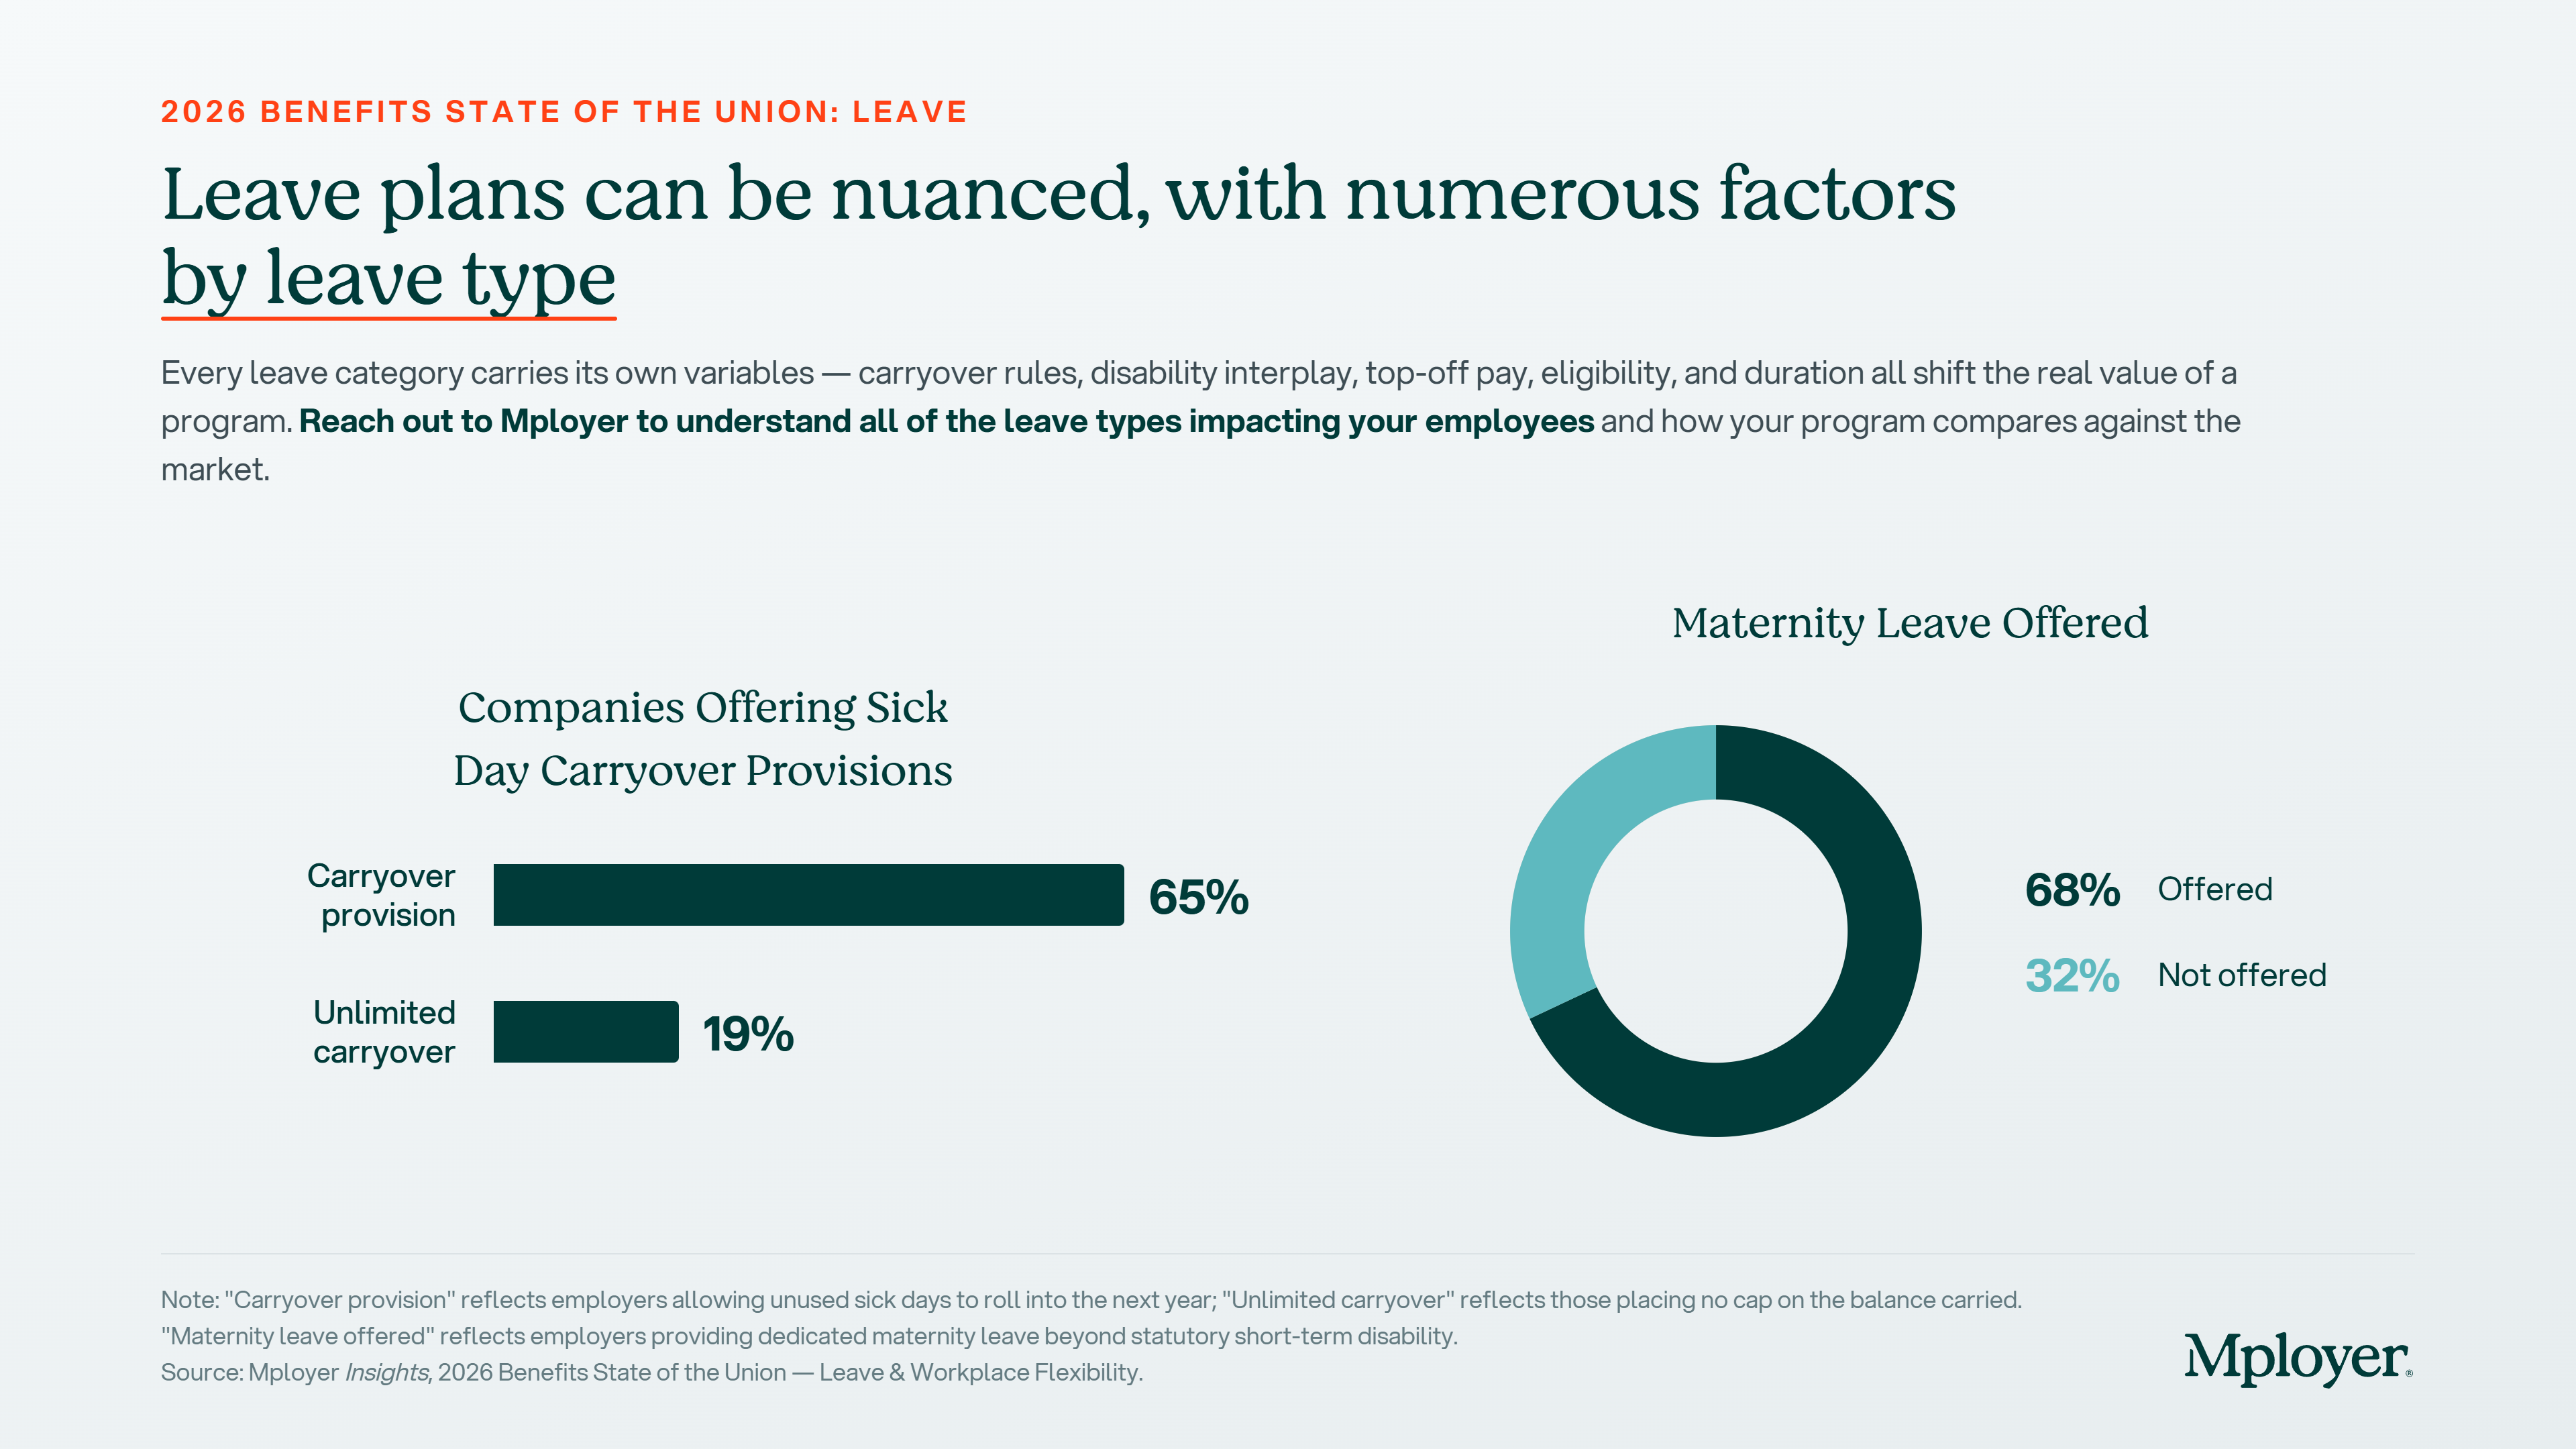
Sick leave policy is one of the most administratively variable elements of a leave program. 65% of employers offer a carryover provision that allows unused sick days to roll into the following year. 19% allow unlimited carryover, placing no cap on the sick day balance an employee can accumulate over time. Use-it-or-lose-it sick policies, while simpler to administer, can create employee hardship in years with significant illness and may conflict with state-level sick leave mandates in jurisdictions that explicitly require carryover.
The interaction between sick leave and short-term disability coverage is also worth understanding. For many employers, sick leave effectively serves as the waiting period, or elimination period, before short-term disability benefits begin. An employee with 10 accrued sick days who experiences a two-week illness may use those sick days before STD coverage activates. Employees without sufficient sick leave balances, or in plans where sick leave and STD do not coordinate, face an income gap. How these two programs interact is a design decision that affects real employee financial security and is worth reviewing explicitly.
A Note on Maternity and Parental Leave
Nationally, 68% of employers offer dedicated maternity leave beyond what statutory short-term disability provides. 32% do not. That statistic is at the national level and covers all employer sizes and industries. The variation beneath that headline number is significant: duration of paid leave, how disability income is structured, whether employers top off the disability benefit to approach full salary replacement, bonding leave for non-birth parents, and adoption leave policies all vary widely. These dimensions are among the most actively discussed benefits in today’s candidate conversations and are closely tracked by employees considering family formation.
Part 2 of this series will go deep on maternity and parental leave. We will cover average paid leave duration by industry, how short-term disability interacts with maternity leave, what topping off disability means and how common it is, paternity and non-birth-parent bonding leave benchmarks, and adoption leave trends. If your organization is actively recruiting in competitive talent markets or is thinking through a parental leave update ahead of open enrollment, that post is worth reading closely.
Leave as a Competitive Differentiator: How to Use It, How to Talk About It
Leave benefits are one of the most emotionally resonant elements of an employee’s relationship with their employer. They represent how an organization actually treats its people when life happens: when someone is sick, when a child is born, when a family member needs care, or when an employee simply needs time to recharge. Employees who feel their leave program is generous are more likely to stay. Employees who feel it is stingy are more likely to leave, and more likely to say so in exit interviews and public reviews.
The challenge for most employers is that they do not know how their leave program actually compares. They know their own policy, but they do not know whether their vacation accrual schedule, their holiday count, their sick leave carryover rules, and their flexibility arrangements are above market, at market, or below market against the specific employers competing for the same candidates. Without that context, it is impossible to talk credibly about leave as a differentiator or to address an employee’s complaint about time off with anything more than a defensive response.
The next time an employee raises a concern about paid time off, or a candidate asks how your leave program compares, you should be able to answer with data. Not a general impression that your program is competitive, but a specific, benchmarked answer: our employees at five years of tenure receive 17.6 days of paid time off, which is above the national average for employers in our industry and size band. That answer requires knowing where you stand, and knowing where you stand requires a benchmark built from employers who actually look like you, not a national average that flattens the variation that matters.
Strong leave programs are also an underused marketing asset. Employers who score at Market Leading or above in the Mployer Leave pillar have a specific, documented, independently verified statement to make in offer letters, careers pages, and job postings: our leave program has been rated above market against employers in our industry, region, and size. That is a recruiting signal most employers are not making, because most employers have never taken the step of finding out whether they could make it.
See how your leave program compares to your custom cohort at MployerAdvisor.com. Part 2 on maternity and parental leave is coming soon.
Sources
Mployer Insights, 2026 Benefits State of the Union: Leave & Workplace Flexibility. Source: Mployer Insights analysis of 50,000+ employer benefit plans.
Family and Medical Leave Act of 1993 (FMLA), 29 U.S.C. Section 2601 et seq. Applies to employers with 50+ employees within 75 miles.
U.S. Department of Labor: Federal holidays apply to federal government employees; private employers have no federal obligation to provide paid holidays.
State paid family and medical leave programs: California (CFRA/SDI), New York (NY PFL), New Jersey (NJFLA), Washington (WA PFML), Massachusetts (MAPFML), Oregon (OPFML), Colorado (FAMLI), Connecticut (CTFMLA), and others.
.png)
Mployer materially expands the AI and agentic capabilities across its product suite and expands access to its MCP Server and Claude Connectors, making Mployer's proprietary 2 billion data points across benefits and insurance accessible inside partners' own LLMs.
Nashville, TN, July 16, 2026 /PRNewswire-PRWeb/ --
Mployer, the industry's leading employee benefits and insurance intelligence platform, today announced its Expanded AI Release powered by Anthropic. This release is a major expansion of the AI and agentic abilities already built across its products, and it includes the broad release of its MCP (Model Context Protocol) Server and Claude Connectors. This Expanded AI release allows our partners to access Mployer's 2 billion proprietary benefit and insurance data points both inside Mployer and inside their own LLM.
This functionality is coupled with an expert benefit AI-agent trained on these 2 billion data points to provide superior strategic advice and support for our partners at every step in their workflow, across every Mployer solution - from market analytics to benchmarking, claims and compliance. It is similar to having a highly educated insurance expert with 30+ years of experience sitting side by side with every individual partner at every step.
In addition, in line with the company's goal of better enabling all industry participants, Mployer is releasing a limited, free version of every product. There will be a national training on July 28 and August 5 that is for everyone in the industry. To sign up for limited free access and the national training on July 28th, or request access to the Mployer MCP, please see further details below.
"This release raises the bar for what AI can do for our industry," said Brian Freeman, CEO of Mployer. "Applying this next level of AI
across our platform and the broker and carrier workflows gives insurance industry leaders powerful, proprietary market data to support their strategies and decisions. We are entering an awesome era for our industry, where the brokers and carriers using the best analytics will deliver differentiated outcomes for their employer partners. That will continue to drive collective, positive industry impact. We're excited for our partners and for Mployer to play a material role in this next era."
Infusing AI into every step of the workflow:
Mployer's benefits and insurance AI Agent has been highly trained on Mployer's 2 billion unique benefits and insurance data points, and sits alongside leading producers across each step of their workflow, including:
"Imagine being a producer today and starting your morning with updates from your expert benefits AI assistant: 'Your client's renewal is trending 14% above their cohort benchmark, attached are draft strategies for your review,' or 'An HR director from one of our partners is now the CHRO at a new company, attached is a draft congratulatory email,' or 'A new proposed Texas law impacts three of our groups, attached is a communication for your review.' That is the reality of what this release and the next era bring," said Anthony Waters, Chief Growth Officer of Mployer. "It is a great time to be a part of this industry."
To receive limited, free access to every product, you need to attend one of the trainings:
Each product training is 20 minutes. You can join only the specific solutions you would like to learn more about.
To request access to Mployer's MCP Server and Claude Connectors, please reach out to [email protected].
About Mployer
Mployer is the industry's leading employee benefits and insurance intelligence platform, built for brokers, carriers, GAs, PEOs, and the employers they serve. Powered by more than 2 billion unique benefit data points and Anthropic, Mployer's suite of Catalyst, Insights, Vista, Pulse, and Atlas works for industry leaders benchmarking plans, analyzing claims, recommending growth strategies, and interpreting complex policies and legislation, in one platform. With its MCP Server and Claude Connectors, Mployer's data and AI are accessible across its products and directly within Claude. Learn more at MployerAdvisor.com.
Media Contact: Anthony Waters Chief Growth Officer, Mployer [email protected]
Media Contact
Anthony Waters, Mployer, 1 774 2879741, [email protected], https://MployerAdvisor.com

.svg)


.svg)
.svg)
.svg)