Employee Benefits
2026 Benefits State of the Union: High-Cost Drugs and What They Mean for Your Health Plan
According to Mployer Insights’ 2026 analysis of 50,000+ employer health plans, prescription drugs account for over 25% of total benefit expenses, with Tier 4 specialty drugs driving the majority of high-cost claims. While Tier 4 copays average $123 with coinsurance requirements in 31% of plans, individual oncology therapies like Darzalex Faspro ($170,800/yr) and Keytruda ($158,200/yr) frequently exceed average individual stop-loss deductibles ($141,938). To mitigate exposure, self-funded employers are increasingly turning to independent, transparent PBM models and biosimilar substitution—which yields up to a 73% net cost reduction per patient.
August 9, 2026

The Likely Fastest-Growing Line in Your Benefits Budget

Modern medicine has produced remarkable advances. Cancer therapies that were not available five years ago are now extending and saving lives. Treatments for autoimmune diseases, multiple sclerosis, and rare genetic conditions are giving employees and their families real options where few existed before. As an employer, providing access to these treatments through your benefit plan is one of the most meaningful things your organization does for the people who work there.

It also comes with a financial reality that every benefits decision maker needs to understand clearly. Over 25% of total employer health benefit expenses are now driven by prescription drugs, and within that figure, a small number of specialty drugs account for an outsized share of the cost. A single covered employee on an oncology therapy can generate $100,000 to $170,000 or more in annual drug spend. A handful of members on these treatments can represent a larger budget impact than the entire pharmacy spend of the rest of your workforce combined. The goal is not to restrict access to these medications. The goal is to understand how the system works, how costs flow, and how to structure your plan so that both your employees and your organization are best positioned for the long term.

This piece covers how the pharmacy benefit system works, how your plan’s tier structure determines who pays what, how stop-loss insurance interacts with high-cost drug claims, and what employers can do to manage this exposure thoughtfully.
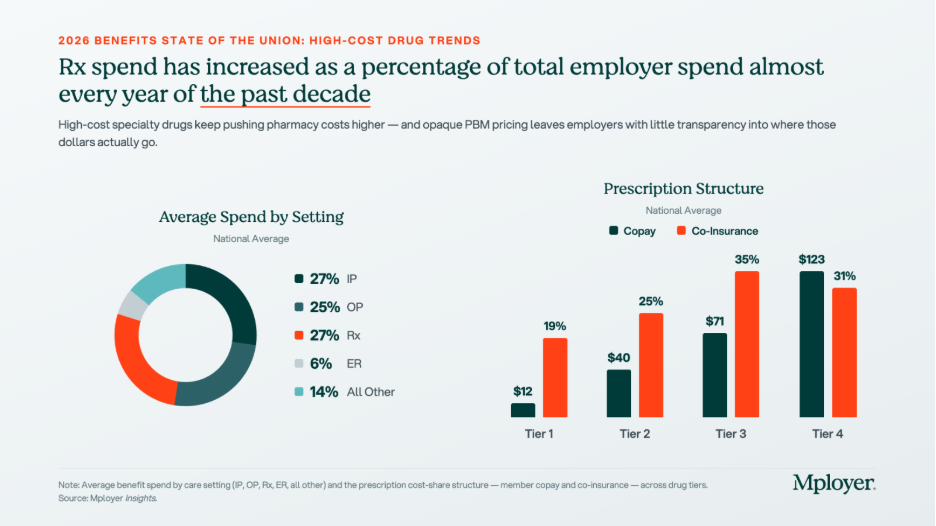
The tier structure in the chart above reflects how plans already account for the cost complexity of specialty drugs. Tier 4, which is where specialty biologics and injectables are typically placed, carries significantly higher cost-sharing than the other tiers: an average employee copay of $123 and coinsurance requirements in 31% of plans. But Tier 4 behaves very differently from the other tiers. On Tier 1, 2, and 3 drugs, cost-sharing is relatively predictable and manageable. On Tier 4, the combination of high drug cost and percentage-based coinsurance can generate out-of-pocket exposure that approaches or exceeds a patient’s annual out-of-pocket maximum in a single month of therapy. How Tier 4 is structured, what controls are in place, and how the plan manages cost is one of the most consequential design decisions an employer makes.

Understanding Your Benefit Plan’s Pharmacy Options

How Pharmacy Benefit Managers Work

Most employer health plans do not manage pharmacy benefits directly. That function is delegated to a Pharmacy Benefit Manager, or PBM, which acts as the intermediary between the health plan, the pharmacy, and the drug manufacturer. The PBM builds and maintains the formulary, negotiates drug prices and rebates with manufacturers, contracts with pharmacy networks, and processes pharmacy claims. The three dominant PBMs, Express Scripts (owned by Cigna), CVS Caremark (owned by CVS Health / Aetna), and OptumRx (owned by UnitedHealth Group), together manage the pharmacy benefits of approximately 80% of covered lives in the United States. Each is affiliated with a major carrier, meaning that employers who use an ASO medical arrangement often default to the carrier’s affiliated PBM without realizing it. Independent PBMs such as Capital Rx, Navitus, and MedOne Pharmacy Benefit Solutions operate on transparent, pass-through pricing models that return all rebates to the plan rather than retaining them as PBM revenue. PBMs are compensated through administrative fees, spread pricing (charging the plan more than the pharmacy receives and keeping the difference), manufacturer rebates in exchange for formulary placement, and specialty pharmacy margin. For any employer managing meaningful specialty drug spend, understanding which of these revenue sources applies to your contract is essential.

How Drug Tiers and Cost-Sharing Work

Every pharmacy benefit plan organizes covered drugs into tiers, with cost-sharing that increases as you move from Tier 1 generics (avg. $12 copay) through Tier 2 preferred brands ($40), Tier 3 non-preferred brands ($71), and into Tier 4 specialty drugs ($123 copay, with coinsurance in 31% of plans). The tier placement of a drug affects both what the employee pays and, indirectly, what the plan pays, since tier placement drives utilization patterns. Plan sponsors have real levers here: step therapy (requiring a patient to try a lower-cost drug first), prior authorization, specialty pharmacy channel mandates, and formulary exclusions all affect Tier 4 cost without eliminating clinical access. These controls require balancing cost management with the reality that for many specialty drugs, no lower-cost alternative achieves the same clinical outcome.

How Stop-Loss Insurance Interacts with High-Cost Drug Claims

For self-funded employers, specialty drug claims are now among the most common triggers for individual stop-loss reimbursement. A single employee on a cancer therapy or rare disease treatment can generate pharmacy claims that exceed the plan’s specific stop-loss deductible, which averages $141,938 nationally for self-insured plans, within a single plan year. The mechanics: the employer pays all claims up to the deductible threshold, and the stop-loss carrier reimburses costs above it. Several dynamics are specific to high-cost drugs. At renewal, stop-loss carriers may laser a known high-cost member by raising their individual deductible or excluding them from coverage. Some carriers now specifically carve out GLP-1 medications or other high-utilization drug categories from stop-loss reimbursement, so employers adding new drug coverage should verify what their contract covers. Specialty drugs can also be administered under either the pharmacy benefit or the medical benefit depending on whether they are self-administered or clinic-administered, and some stop-loss contracts apply different terms to each channel. Employers should model their actual specialty drug cost distribution against their stop-loss deductible at every renewal to understand where the plan’s real exposure sits.

The Costliest Specialty Drugs: What They Treat and What They Cost

The chart below shows the highest-cost specialty and biologic drugs by average cost per patient, ranked from most to least expensive. Cancer therapies dominate the top of the list, but treatments for autoimmune conditions, MS, and inflammatory disease also appear, reflecting how broadly specialty drug spending is distributed across a workforce.
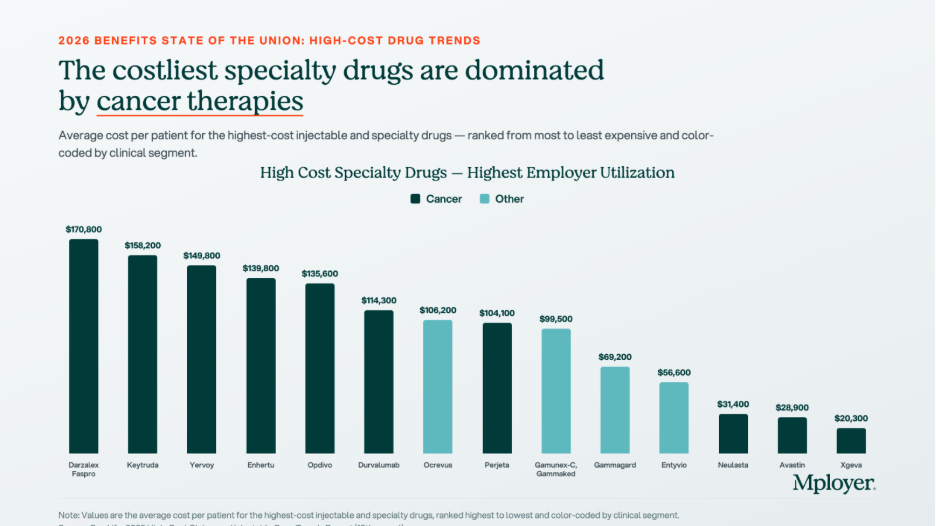
  • Darzalex Faspro (daratumumab/hyaluronidase) | $170,800 avg. annual cost per patient. Janssen (J&J). Multiple myeloma, a blood cancer. The highest-cost drug on the list by average patient cost. The subcutaneous formulation allows home administration, increasing the likelihood it flows through the pharmacy benefit rather than the medical benefit.
  • Keytruda (pembrolizumab) | $158,200 avg. annual cost per patient. Merck. FDA-approved across more than 40 cancer indications including lung, melanoma, head and neck, and bladder cancers. One of the most prescribed oncology drugs globally and one of the most common high-cost pharmacy claims in large employer plans.
  • Yervoy (ipilimumab) | $149,800 avg. annual cost per patient. Bristol-Myers Squibb. Melanoma and in combination with Opdivo for lung and other cancers. Combination Yervoy plus Opdivo therapy is among the highest per-patient drug cost regimens in common use.
  • Enhertu (trastuzumab deruxtecan) | $139,800 avg. annual cost per patient. AstraZeneca / Daiichi Sankyo. HER2-positive and HER2-low breast and gastric cancers. A significant recent clinical advance for patients with cancers that previously had limited options after first-line treatment.
  • Opdivo (nivolumab) | $135,600 avg. annual cost per patient. Bristol-Myers Squibb. Melanoma, lung, kidney, bladder, and other cancers. Frequently used in combination with Yervoy, compounding cost significantly when both are prescribed together.
  • Ocrevus (ocrelizumab) | $106,200 avg. annual cost per patient. Genentech. Relapsing and primary progressive multiple sclerosis. MS therapies are a persistent specialty drug cost driver because patients remain on therapy for years, making each diagnosed member a multi-year plan cost.
  • Entyvio (vedolizumab) | $56,600 avg. annual cost per patient. Takeda. Moderate-to-severe Crohn’s disease and ulcerative colitis. Inflammatory bowel disease therapies are among the most common specialty drug claims in employer plans because the conditions are prevalent in working-age adults.

Biosimilars: The Cost Opportunity Most Employers Are Not Fully Using

A biosimilar is a biologic drug that is highly similar to an already-approved reference biologic, with no clinically meaningful differences in safety, purity, or potency. Biosimilars are not generic drugs in the traditional sense, because biologic drugs are complex proteins manufactured from living cells and cannot be chemically replicated exactly. But they go through an FDA approval pathway that confirms their clinical equivalence to the reference product, and they cost significantly less. The biosimilar market has expanded rapidly as major biologic patents have expired. Humira, the world’s best-selling drug for much of the past decade, now has multiple biosimilar competitors in the U.S. Stelara has followed. The oncology biosimilar pipeline is maturing, with more approvals expected in the next two to three years.
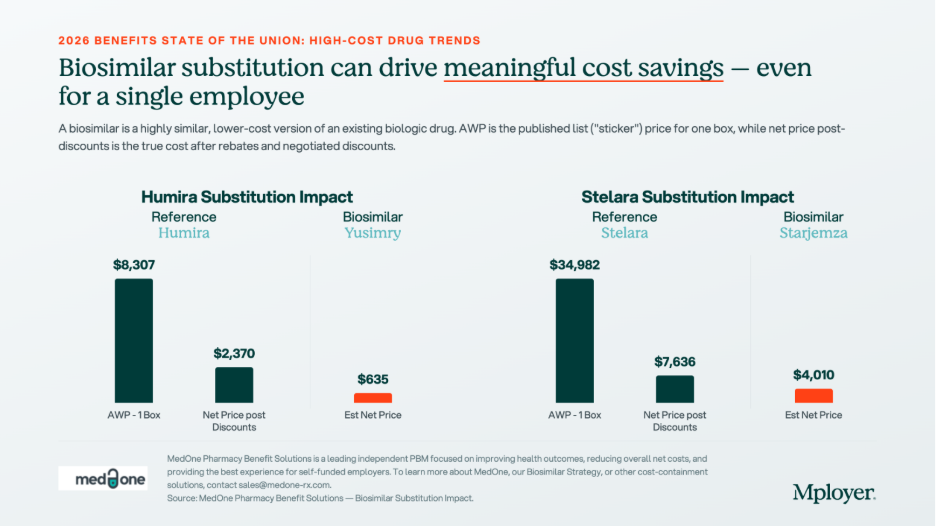
The chart above shows what biosimilar substitution looks like in dollar terms. For Humira, the net price after rebates and negotiated discounts is $2,370 per box. The biosimilar Yusimry has an estimated net price of $635, a 73% reduction. For Stelara, the reference drug net price is $7,636 per box. The biosimilar Starjemza has an estimated net price of $4,010, a 47% reduction. For an employee on monthly Humira therapy, the difference between the reference drug and the biosimilar is approximately $21,000 per year in net plan cost. For a Stelara patient, the annual difference is approximately $43,500. Across even a small number of members on these therapies, biosimilar substitution is one of the highest-return cost management interventions available.

Plan sponsors have four main tools to drive biosimilar adoption: preferred formulary placement (putting the biosimilar on a lower tier and the reference drug on a higher tier), step therapy for new patients, automatic substitution where state law permits, and formulary exclusion of the reference drug entirely. The most important variable in any biosimilar strategy is whether your PBM has a financial incentive to keep the reference drug preferred. A PBM earning a large rebate on Humira has a direct financial reason to keep Humira on the preferred formulary, even when the biosimilar costs the plan less on a net basis. Independent PBMs operating on pass-through pricing remove this conflict entirely, because all rebates return to the plan and formulary decisions are made without a competing financial interest.

What Employers Should Be Asking About Their Pharmacy Benefit

High-cost drug management requires active decisions about PBM contract structure, formulary design, specialty pharmacy strategy, and stop-loss alignment. The questions worth asking at every renewal:

  • Is your PBM contract pass-through or spread-based? A pass-through model means you pay exactly what the pharmacy receives and all rebates come back to the plan. A spread-based model means the PBM earns revenue that is not visible in the administrative fee. Request full compensation disclosure under the CAA requirements.
  • Are you receiving all available biosimilar savings? Ask your PBM for a net cost comparison of each reference drug plus rebate against the available biosimilar net price. The answer will tell you whether your formulary is designed around the plan’s cost interest or the PBM’s rebate interest.
  • What is your specialty drug channel strategy? Are specialty prescriptions being filled through your PBM’s affiliated specialty pharmacy? Carving specialty to an independent pharmacy or using a white-bagging program for clinic-administered drugs can generate meaningful cost differences.
  • How does your stop-loss deductible interact with your specialty drug exposure? Model your actual specialty drug claims against your stop-loss threshold. If most of your high-cost drug claims fall below the deductible, the plan is absorbing those costs without triggering reimbursement.
  • Does your formulary have appropriate Tier 4 controls? Step therapy, prior authorization, and quantity limits on specialty drugs reduce cost without eliminating clinical access. Without these controls, high-cost therapies can be approved and dispensed without any plan-level review of whether a lower-cost alternative exists.

Know How Your Pharmacy Benefit Compares

Pharmacy is now one of the two or three most consequential cost management decisions in health plan design. The employers managing it well are not restricting access to the medications their employees need. They are ensuring that the structure of the benefit, the PBM contract, the formulary design, and the stop-loss coverage work together in the plan’s interest, and that every dollar spent on high-cost drugs is spent as efficiently as possible.

Mployer’s benefits rating evaluates pharmacy benefit design as part of the Medical pillar score, benchmarked against a custom cohort matched by size, region, and industry. Knowing where your pharmacy benefit stands relative to employers who actually look like you is the starting point for making better decisions.

See how your benefits package compares to your custom cohort at MployerAdvisor.com.

Sources

Mployer Insights: Average Spend by Setting, Prescription Structure, and High-Cost Specialty Drugs. Source: Mployer Insights analysis.

MedOne Pharmacy Benefit Solutions: Biosimilar substitution impact data for Humira/Yusimry and Stelara/Starjemza. MedOne is a leading independent PBM focused on improving health outcomes and reducing net costs for self-funded employers. [email protected].

Mployer 2025 and 2026 Employee Benefit Plan Design Study, covering 50,000+ employer plans. Individual stop-loss avg $141,938 self-insured.

Consolidated Appropriations Act of 2021, Section 202: broker/consultant compensation disclosure requirements for group health plans.

FDA Biosimilar approval framework: 42 U.S.C. Section 262(k).
Labor Market Insights
Living Wage vs. Minimum Wage In The Modern Age
While the concept of a living wage has become an issue of increasing importance to both employers and employees in recent years, the number of workers actually earning a living wage has been steadily decreasing at the same time - though that decrease has not been experienced across industries and/or geographies in equal measure.
April 1, 2024

While the concept of a living wage has become an issue of increasing importance to both employers and employees in recent years, the number of workers actually earning a living wage has been steadily decreasing at the same time - though that decrease has not been experienced across industries and/or geographies in equal measure.

It may once have been easy to confuse minimum wage standards with living wage standards. In fact, the federal minimum wage was initially devised in part to ensure a living wage, those standards long ago diverged with cost of living significantly outpacing minimum wage increases on balance since the 1950s.

That said, the chasm between minimum wage and living wage seems to have become all the more stark in recent years, especially during the pandemic recovery when workers paid well above minimum wage found themselves unable to keep up as cost of living climbed faster than rising wages despite (and because of?) the historically labor-friendly labor market. 

Inflation has largely been under control for the better part of a year now, with the last 9 months holding steady below 4% annualized, but cost of living remains high and the minimum wage remains exactly where it has been for the last 15 years - 7 dollars and 25 cents an hour.

That $7.25 an hour in 2009 would be worth $10.58 today accounting for inflation, etc. Meanwhile, as of 2022, the average living wage in the US according to MIT was just over $25 dollars an hour at the time, or $27.53 in today’s dollars. 

With more workers than ever failing to secure a living wage, the repercussions of this situation are likely to be felt far beyond those who are personally affected, though not all industries are contributing equally to the issue nor are all cities/states/regions responding passively to the growing problem.

Industries With the Highest Living Wages

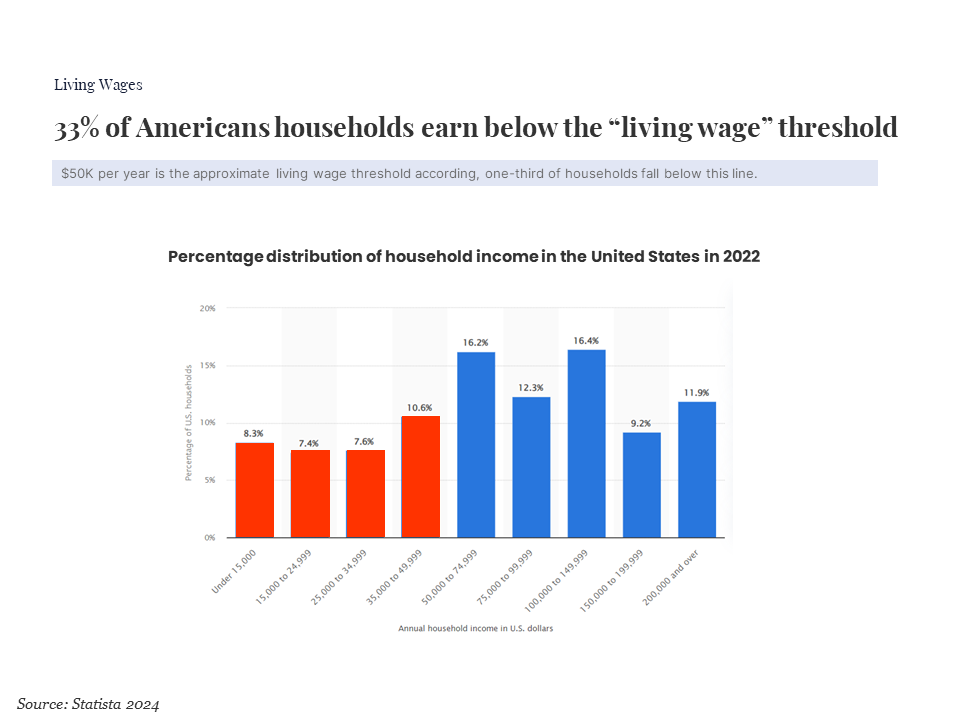
According to data from Revelio Labs, more than one third of workers (36%) employed by the top one thousand companies in the US are paid less than a living wage, defined here as a wage sufficient for two full-time workers to support themselves as well as two dependents. Even worse, nearly 1 out of 5 of those employees (19.2%) does not make enough money to meet basic needs. 

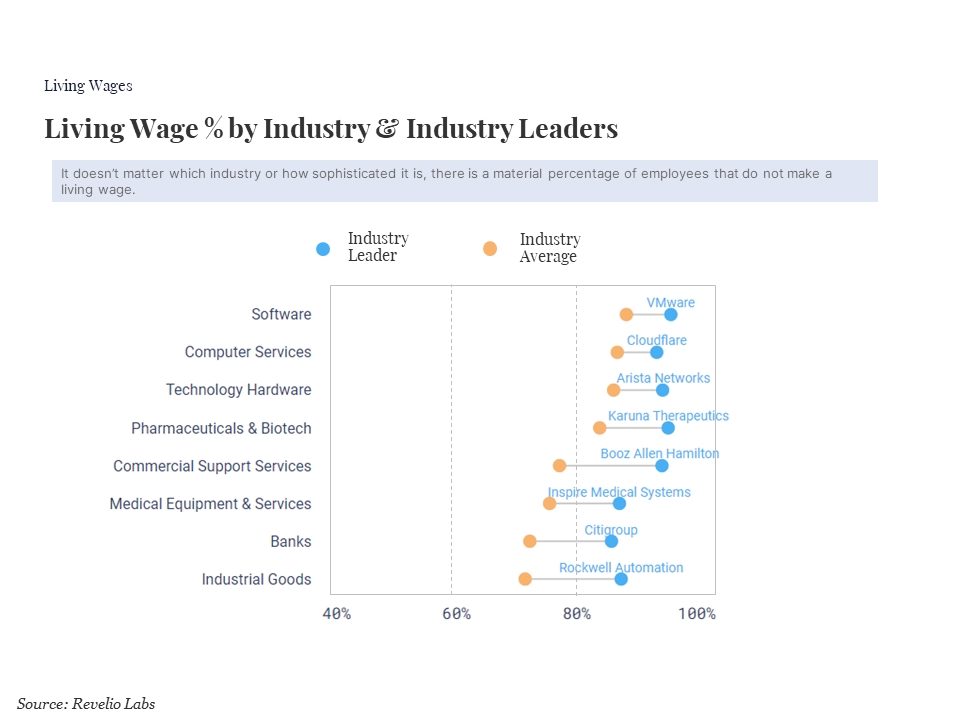
As the following graphic illustrates, among the 10 largest industries in terms of total number of employees (which collectively account for 10% of the US workforce), the industries involving technology development dominate the upper end of the scale, with the software, computer services, technology hardware, and pharmaceuticals/biotech industries all paying more than 80% of their employees at or above the living wage threshold.

On the other extreme, both the restaurant and leisure as well as the retail industries pay living wages to fewer than 40% of their employees, while the commercial support services, medical equipment, banking, and industrial goods industries all pay living wages to about 70% to 80% of their employees. 

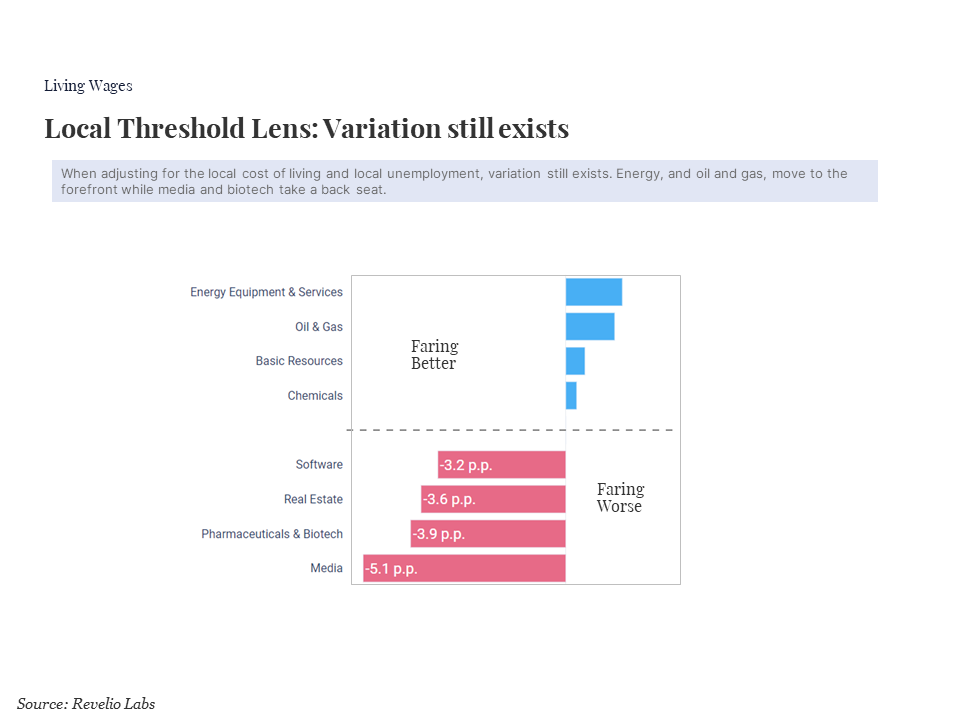
Even when taking into account geographic variance in cost of living, the big picture doesn’t change much, although the following graphic seems to indicate a somewhat less favorable view of the tech industry’s propensity toward paying living wages when factoring for local cost of living, with the total percentage of employees that are paid a living wage in the software and pharmaceuticals/biotech industries dropping by between 3% and 4%, respectively.

Mostly, however, the information best illustrated by this graphic may simply be that industries like tech and media tend to gravitate toward areas with a relatively higher cost of living while the more industrial industries tend to be located in areas with a relatively lower cost of living compared to the national average.

Minimum Wage Across States

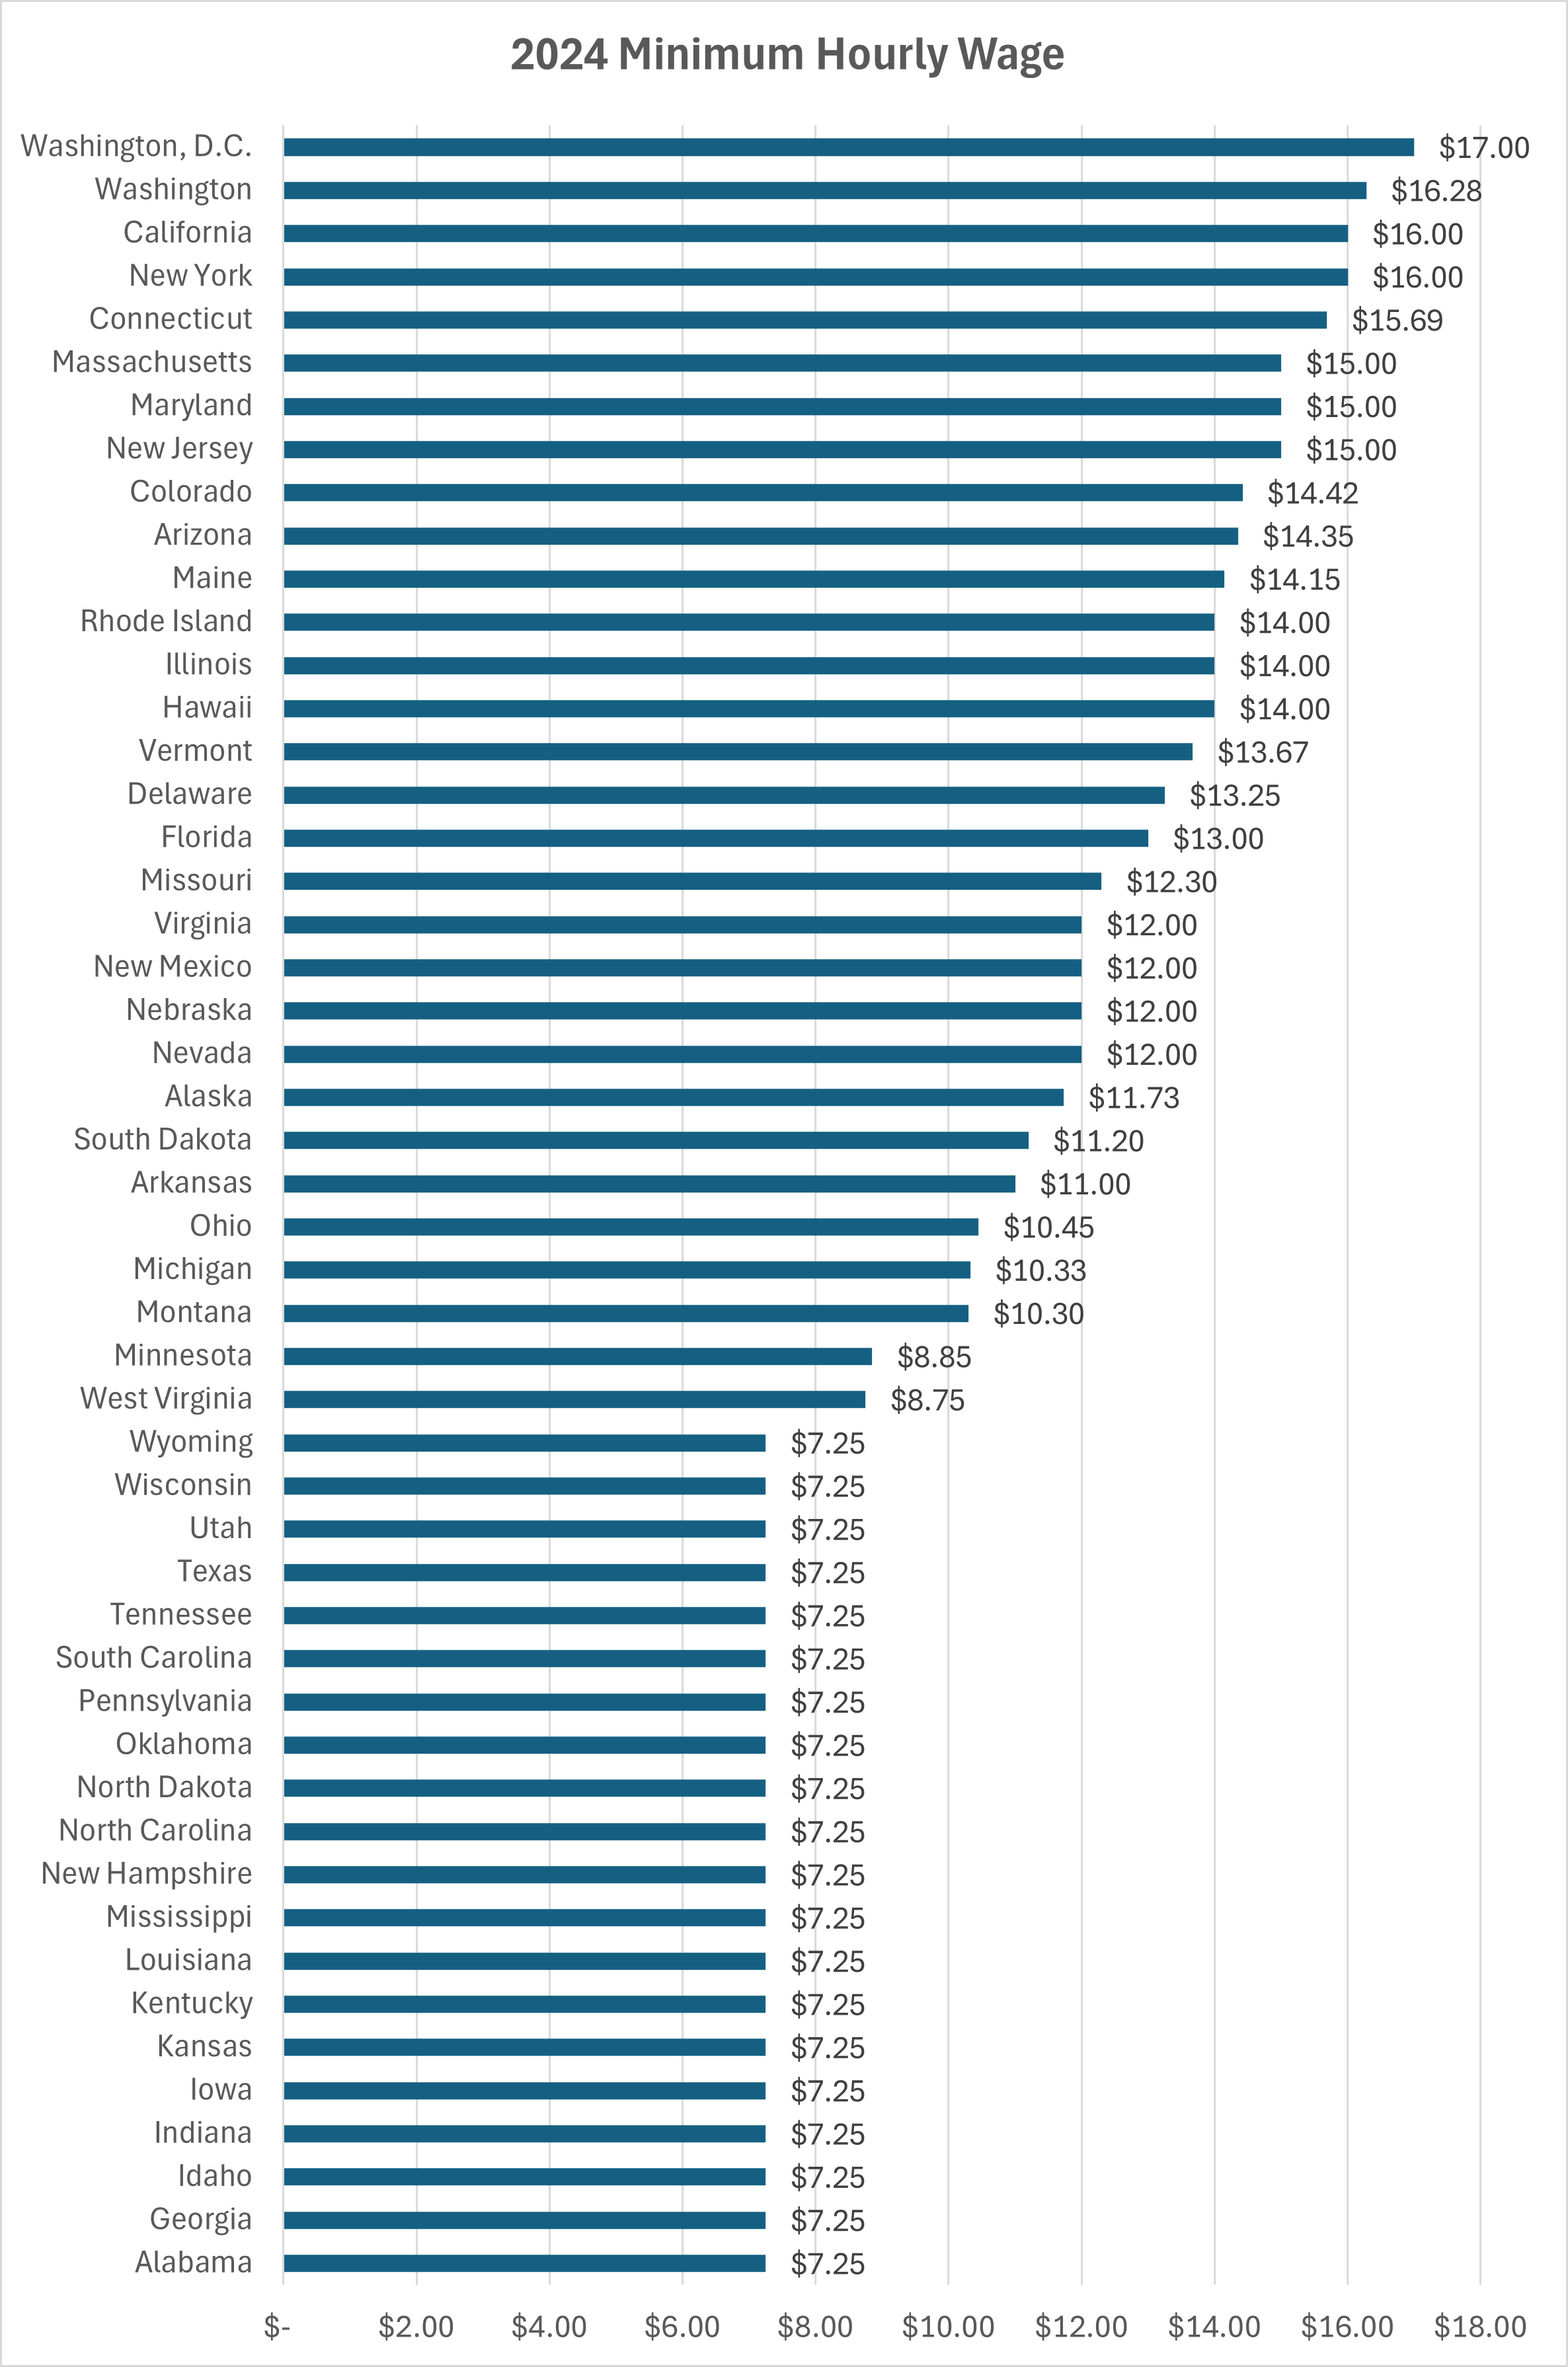
According to the National Conference of State Legislatures, Washington DC currently has the highest minimum wage among ‘states’ at $17 per hour, followed by Washington state at $16.26, then California and New York at $16 each. 

Beyond the 5 states that have no internally legislated minimum wage and are therefore subject only to the federal minimum wage standard (Alabama, Louisiana, Mississippi, South Carolina, Tennessee), there are 15 states that have set their minimum wage to the current federal level of $7.25 per hour - Georgia, Idaho, Indiana, Iowa, Kansas, Kentucky, New Hampshire, North Carolina, North Dakota, Oklahoma, Pennsylvania, Texas, Utah, Wisconsin, and Wyoming. 

Average minimum wage across the remaining states is about $13 per hour.

Minimum Wage Increases Coming Soon

There are 9 states that currently have enacted increases to their current minimum wage thresholds that have not been enacted yet:

  • Delaware: Increase of $1.75 from $13.25 to $15 effective January 1, 2025
  • Florida: A series of three minimum wage increases of $1 each are set to occur on September 30th of each of the next three years, raising the statewide minimum wage from $12 up to $15 by October 1, 2026.
  • Hawaii: 2 minimum wage increases are currently planned, raising the current minimum wage of $14 per hour up to $16 per hour effective on January 1, 2026 followed by another $2 increase up to $18 per hour two years later, effective on January 1, 2028.
  • Illinois: $1 increase from $14 per hour up to $15 per hour effective on January 1, 2025.
  • Michigan: Annual rate hikes are planned for January 1 of each of the next 6 years, increasing the statewide minimum wage from $10.33 per hour up to $12.05 by 2031.
  • Nebraska: 2 minimum wage increases of $1.50 each are currently planned to take effect on January 1 of 2025 and 2026, respectively, increasing the current minimum wage from $12 to $15.
  • Nevada: On July 1 of 2024, Nevada’s minimum wage will climb from $11.25 to $12.
  • Rhode Island: The minimum wage is set to increase by $1 per hour on January 1, 2025, bringing the pay rate up from $14 per hour to $15.
  • Virginia: 2 minimum wage increases of $1.50 each are currently planned to take effect on January 1 of 2025 and 2026, respectively, increasing the current minimum wage from $12 to $15.

What Comes Next?

It’s been almost 12 years since fast food workers launched the Fight for 15 movement to push for better pay (specifically $15 per hour) as well as better/safer working conditions. Currently, the US average living wage is about $27 per hour - nearly double the lofty (and obviously unachieved) goal that $15 per hour represented little more than a decade ago.

In the 85 years since the federal minimum wage was first introduced, it has been raised at least 23 times - most recently in 2009 - with an increase on average more than once every 4 years, but never in the past had more than 10 years passed in between increases, which makes the current 12 year pause all the more noteworthy. Perhaps even more concerning is that the previous record gap between federal minimum wage threshold increases was between 1997 and 2007, which indicates a troubling trend.

Some states are evidently trying to take up the mantle in lieu of waiting for further federal action, but even among the states with the highest planned minimum wages, those thresholds fall significantly short of the living wage standard.

It is also worth noting that all of the states that currently have minimum wage increases set on the books also already have a statewide minimum wage threshold that is meaningfully higher than the current federal standard. 

With 40% of states effectively mirroring the federal minimum wage standard, this problem will likely only worsen in the near term and become exacerbated on a regional basis, until some kind of federal solution is enacted.

Still, whenever Congress eventually gets around to increasing the federal minimum wage again, based on current conditions there is virtually zero chance that the increase will close much of let alone all of the gap between the minimum wage and living wage in a given area. 

Of course, failure to raise minimum wage standards to meet base standard of living expectations does no preclude other factors and/or market forces from reversing the trend toward larger proportions of the workforce earning unlivable wages, but whatever those factors may be they have yet to emerge, and the long-term implications of these conditions remain unclear.

HR Compliance
J&J HR Leader Sued Personally for Violating Fiduciary Liability
A recent lawsuit against Johnson & Johnson brings to light uncharted legal territory concerning employer fiduciary duties related to employee health plans. Alleging overpayment for prescription drugs, this class action suit not only challenges Johnson & Johnson but also targets individual members of its Planning & Benefits Committee. This landmark case raises important questions about the scope of fiduciary duty under ERISA, extending beyond retirement benefits to encompass employee health plans.
February 9, 2024

One recent lawsuit is testing uncharted legal waters when it comes to determining exactly what fiduciary duty employers owe employees with regard to the provision of employee health plans.

On February 5th, a class action lawsuit was filed against Johnson & Johnson in US District Court alleging the company breached its fiduciary duty to employees by egregiously overpaying for prescription drugs.

The plaintiffs, or employees and former employees, support their claim by citing the seemingly exorbitant sticker prices that the company plan appears to be paying for certain medications - prices that supposedly far exceed the cost that uninsured customers pay for the same medication.

Interestingly, in addition to naming Johnson & Johnson as a defendant in the case, the plaintiffs also filed suit specifically against the Johnson & Johnson Planning & Benefits Committee as well as each of the individual fiduciaries that make up that committee, which may be the first time that such fiduciaries have been personally named as defendants in a case like this for employee benefits.

ERISA Fiduciary Liability 

The Employee Retirement Income Security Act of 1974 (ERISA) governs primarily two components for an employer - their retirement and employee benefits. 

Retirement - As a corollary, about 10-15 years ago, with new ERISA requirements for retirement plans, a number of lawsuits were filed against employers for violation of fiduciary duty. These lawsuits have primarily focused on allegations that plan fiduciaries failed to uphold their duties, leading to significant repercussions for plan participants and beneficiaries. The core issues at the heart of these legal battles include:

  1. Excessive Fees - One of the most common grounds for ERISA lawsuits is the accusation that plan fiduciaries allowed excessive fees to be charged for plan administration and investment management. Plaintiffs argue that fiduciaries did not adequately review or negotiate lower fees, which could erode retirement savings over time. Courts have scrutinized whether fiduciaries have conducted regular and thorough fee benchmarking against comparable plans to ensure that fees are reasonable for the services provided.

  1. Poor Investment Options - Another significant area of litigation involves claims that fiduciaries offered poor investment options that underperformed relative benchmarks or were inappropriately risky for the plan’s investment objectives. These lawsuits often allege that fiduciaries failed to properly monitor investment options and replace underperformers, leading to lower returns for plan participants.

  1. Mismanagement of Plan Assets- Lawsuits also have targeted fiduciaries for mismanagement of plan assets, accusing them of failing to follow the plan's investment policies, engaging in prohibited transactions, or not acting in the best interests of plan participants. These cases often hinge on the fiduciary duty of prudence and loyalty, requiring fiduciaries to act with care, skill, prudence, and diligence under the circumstances.

The outcomes of these lawsuits have varied, with some resulting in substantial settlements or judgments against fiduciaries, while others have been dismissed. The legal landscape surrounding ERISA fiduciary liability has evolved, with courts increasingly setting higher standards for fiduciary conduct. These cases have led to greater awareness and changes in how retirement plans are managed, including more transparent fee structures, improved investment option monitoring, and the adoption of best practices in plan governance.

Fast-forward to benefits - It remains to be seen how receptive the judicial system will be to the plaintiffs’ claims given that the excessive list prices plaintiffs are highlighting in the suit may be more a reflection of bundling practices common among pharmacy benefit managers (PBMs) than an indication of price gouging or negligent administration.

Perhaps regardless of the ultimate outcome, however, any validation of the underlying premise that the fiduciary duty owed to employees by employers and health plan fiduciaries may extend to these matters will likely bring with it a surge in employees suing their employers for excessive medical care costs and fees.

These suits could come in a variety of forms as it relates to employee benefits, which span not only medical but also cover dental through disability and voluntary. Key items that attorneys may be considering include:

  • Failing to manage employer benefit spend as a fiduciary, specifically overpaying for medical, dental, vision or other as in the J&J case
  • Improper payments to a broker, consultant or third-party vendor
  • Denial of benefit claims
  • Improper amendment or termination of a plan
  • Failure to provide proper updates or adjustments
  • Failure to act in a timely manner

Strategy vs. Duty

Company leadership is hired to run a company effectively. They have a duty to shareholders to run the business to the best of their ability. Senior officers, directors and officers have insurance to protect themselves. When a company performs below expectations, are they liable to shareholders? Only if there are egregious and potentially illegal errors.

The same line is drawn here. You cannot sue someone for implementing a strategy that was ineffective, but you can sue someone if they were negligent.

How to Reduce Your Company’s Risk

In order to minimize the risk exposure that the expansion of fiduciary duty in line with the plaintiff’s perspective presents, here are 3 steps employers can take to ensure that they are properly exercising their fiduciary duty with regard to employee health plan administration.

Organize and Authorize a Health Plan Committee: In the complaint against Johnson & Johnson, the fact that they did not have a health plan committee in place to oversee health benefit plan issues may end up working against the company, especially in light of their implicit acknowledgment of the potential value of a such a committee as evidenced by the existence of their pension plan committee, which serves a similar function with regard to employee retirement benefits. 

Request Disclosures From EBCs and PBMs: According to the Johnson & Johnson complaint, federal law requires contract service providers like employee benefits consultants and pharmacy benefits managers to disclose in writing any compensation of more than $1,000 that they receive for their services, whether that compensation is acquired directly or indirectly. Further, failure to obtain such written disclosure prior to entering into, renewing, or extending a contract with a contract service provider makes that contract a de facto ERISA violation, so fiduciaries responsible for these matters should insist that such disclosures are documented before those contracts and renewals are signed.

Take Personal Responsibility: With each member of the benefits committee being named individually as a defendant in the Johnson & Johnson class action suit, proper oversight of health plans as well as the associated costs and administration is no longer any single fiduciary’s job - it is every fiduciary's job - which further underscores the value of health plan committees that are organized in part to provide accountability for these kinds of health-plan related issues.

***

Although the outcome of the lawsuit has not yet been determined at this point, the ripples across the benefits industry are already being felt, and with rising medical costs trending in the opposite direction of many people’s ability to afford them, employers and benefits managers are almost certainly going to be targeted as possible recipients of the blame with increasing regularity going forward.

You can read more about this case here.

Employee Benefits
Does your Glassdoor Rating matter?
In the digital age, where transparency and corporate reputation are increasingly scrutinized, the significance of an employer's Glassdoor rating has become a topic of much debate. Glassdoor, a platform where current and former employees anonymously review companies, has transformed into a crucial tool for job seekers and a barometer for companies' workplace cultures.
January 25, 2024

In the digital age, where transparency and corporate reputation are increasingly scrutinized, the significance of an employer's Glassdoor rating has become a topic of much debate. Glassdoor, a platform where current and former employees anonymously review companies, has transformed into a crucial tool for job seekers and a barometer for companies' workplace cultures. But does this rating genuinely matter, especially in the context of hiring new people and retaining current employees? Moreover, how does it compare with other metrics like the 'Best Places to Work' awards in the United States, which, intriguingly, have shown a strong correlation with organizational success?

Firstly, Glassdoor ratings play a pivotal role in shaping a company's image in the eyes of potential hires. In an era where candidates often research a company as rigorously as their potential employers scrutinize them, a low Glassdoor rating can be a red flag. It can deter top talent from applying, as these ratings are perceived as reflections of employee satisfaction, management style, and company culture. Conversely, a high rating can enhance an employer's brand, making it more attractive in a competitive job market. This aspect is particularly crucial in industries where talent is scarce and highly sought after.

However, it's essential to approach these ratings with a nuanced understanding. They can be subject to bias, as disgruntled employees might be more inclined to leave reviews than satisfied ones. Therefore, while these ratings offer valuable insights, they should be considered alongside other factors like company achievements, industry reputation, and direct feedback from current employees.

Regarding employee retention, Glassdoor ratings can serve as a useful barometer for internal health. A sudden drop in ratings can be an early warning sign of underlying issues, such as poor management practices or declining job satisfaction. Proactive companies monitor these ratings not just for external branding but also to gauge internal sentiment and address potential problems before they escalate.

Interestingly, when it comes to predicting a company's success, the 'Best Places to Work' awards in the United States offer a surprisingly accurate metric. These awards, determined through comprehensive employee surveys and an audit of company policies and practices, provide a more holistic view of an organization. They consider factors like employee engagement, job satisfaction, benefits, and work-life balance, which are crucial for long-term organizational success.

Companies that consistently rank high in these awards often demonstrate strong financial performance, lower employee turnover, and higher levels of innovation. This correlation suggests that a positive work environment is not just beneficial for employee morale but is also a critical driver of business success. For potential employees, these awards offer a reliable insight into a company's culture and values, often more so than standalone reviews on platforms like Glassdoor.

In conclusion, while an employer's Glassdoor rating is an important metric in the modern job market, influencing both hiring and retention, it should be viewed in context and supplemented with other information. The 'Best Places to Work' awards, on the other hand, provide a more comprehensive overview of a company's workplace environment and are a surprisingly effective predictor of organizational success. As the corporate world evolves, these tools and metrics will continue to shape the landscape of employment, emphasizing the growing importance of transparency and employee satisfaction in the quest for business excellence.

Workforce Management
Dress Codes Are Evolving - Both In and Outside the Office
The growth of off-site work arrangements has had a substantial effect on workplace attire expectations, building upon trends that were already occurring and massively accelerating them.
January 25, 2024

My mom was an airline stewardess in the glory days of PanAm. People would dress up to go on the plane. That is a distant memory if you have flown in the past two decades. The rise of hybrid work has been well-documented both here and elsewhere, but often less publicized is the massive effect that the proliferation of off-site work arrangements has had on work attire expectations, taking an already occurring evolutionary trend and massively accelerating it.

Where a worker is conducting their work can make a substantial difference in how they dress, of course, and it is no surprise that nearly 4 out of 5 employees (79%) who work hybrid schedules dress differently depending on their work location - whether that be at home, on-site, or in a third place.

Perhaps more interesting, however, is how on-site and in-office dress codes are becoming increasingly more casual at the same time. For example, the most recent polling data from Gallup indicates that only about 3% of US workers wear a suit to work - down 4% from the 7% of respondents who did so in 2019. 

Another survey indicates that the proportion of offices with formal dress codes in the US has fallen from 1.2% to just 0.2% over the last 4 years.

What was once a widely observed professional standard across an array of industries has now become an outlier, and the trend lines for business casual wear in the workplace, while not nearly as drastic, may ultimately lead to a similar fate. 

This recent piece from BizWomen takes a broad look at some of those trends that are emerging with regard to workplace attire:

Work Attire By The Numbers

  • Current Work Attire Breakdown: As of the most recent data from Gallup, about 41% of US workers currently dress in business casual attire, while about 31% wear casual clothing, and 23% wear uniforms on the job. 
  • Employee Perspective: Nearly 3 out of 4 employees believe flexibility in dress code expectations is vital, which includes just about the entire respondent pool if you exclude employees who wear uniforms at work. Further, in a separate poll almost 1 in 4 workers claimed that they would be willing to accept a cut in salary or wages in exchange for the loosening of attire-related restrictions and a more informal dress code generally.
  • Talent Attraction: There was a 20% swing in the number of job postings that mentioned business-casual work attire between 2019 and 2022. In January of 2019, about 40% of job postings referenced business-casual attire, but only 3 years later in January of 2022, just under 20% of job listings did so. Over that same time period, the percentage of job postings that referenced casual attire climbed from about 60% to nearly 80%. 
  • Dress Code Evolution By Gender: 85% of men respondents reported noticing a casual evolution in their professional in-office work attire while 77% of women said the same.
  • Back-to-Office Perk: Nearly a quarter of respondents (24%) claimed that their resistance to spending more time in the office would be reduced significantly if they could wear the clothing of their choosing within reason.

You can read more about this topic and find additional insight on the subject from industry professionals here.

DEI
How DEI Initiatives Are Adapting To Pushback
The uncertainty surrounding the legal foundations and limitations set on diversity, equity, and inclusion efforts has had a chilling effect in recent years, but 2024 may be primed for DEI advocates to retake some of the ground that had been lost while gaining new footing on some less contentious territory.
January 12, 2024

Benefits PRO recently released a piece that highlights an interesting perspective on the likely influence and prevalence of Diversity, Equity, and Inclusion initiatives in the year ahead.

The article notes that there has been a significant reduction in the scope and number of DEI programs across US companies over the past 2 years - in part in response to the additional calls for oversight and negative attention coming from some policymakers and legislators, as we have covered in previous blog entries.

Even beyond the direct action that has been taken in opposition to some DEI initiatives, the resulting uncertainty surrounding the legal foundation and limitations set on diversity-encouraging efforts has had a chilling effect that has likely discouraged additional DEI exploration and investment more than just staying in line with the letter of the law.

The author’s premise, however, is that these dynamics have resulted in a gap in the market, which creates an opportunity for forward-looking companies to bolster their DEI efforts and potentially not only reap all the benefits that diverse thinking, experience, and representation can bring to cooperative problem-solving, but reimagined and reinvigorated DEI programs can better position your organization to attract and retain a more diverse and currently underserved talent pool.

How Will DEI Programs Evolve In 2024?

Three of the top ways that DEI initiatives are expected to adapt and change over the coming year are through an increased focus on inclusion and equity, better integration into the overall business in a way that can be apparent from both internal and external perspectives, and increased adoption of AI to open up enable more opportunities for people with disabilities.

  • Focusing on Inclusion and Equity: Given that some of the more contentious backlash against some DEI efforts was largely specific to the diversity component, additional emphasis and building out the more inclusion and equity oriented aspects of these programs makes a lot of sense. Some companies are taking a look at their existing policies and looking for ways to expand them to cover additional, complementary services or employee groups who may not have been considered when the policy was originally envisioned and enacted - for example, broadening fertility benefits to include adoption support and/or to apply to same-sex couples. 
  • Ingraining DEI Companywide: To optimize the return on investment that can be gained through well-executed DEI programs including the talent-pool-broadening effect, these DEI efforts must be built into the company culture and operations so that people both inside and outside the company can see that these efforts are a priority, which is a necessary first element in order to maximize their impact. 
  • AI Further Enabling People With Disabilities: Artificial intelligence seems well positioned to impact just about every aspect of life and business in the relatively near future, but one less discussed opportunity that AI will afford is to both increase inclusion and broaden the talent pool by making a much wider range of tasks and roles accessible to disabled people.

You can read more about DEI initiatives and which ones your company should be prioritizing here

Workforce Management
The Most Pressing HR Issues of 2024
One recent study took an in-depth look at some of the biggest issues in workforce management and provided some recommendations about how best to meet those challenges.
January 9, 2024

Non-profit research organization The Integrated Benefit Institute recently conducted an in-depth study in order to better understand some of today’s most pressing issues in workforce management.

The research involved more than 300 human resources professionals and collected survey data in addition to less quantitative information and insights, largely focusing on the following topics:

  • Prioritization of Benefits
  • Data & Key Performance Indicators
  • Pandemic Takeaways
  • Strategic Investment Targets
  • Conflict Between Business Interests and Employee Interests
  • Challenges Implementing Effective Employee Well-Being Initiatives

Employers’  Top Organizational Goals

One of the most interesting insights that the research data revealed is that more than half (51%) of respondents claimed that improving employee job satisfaction was their organization’s top goal heading into the new year, which underscores the continuing resilience of the labor market and a power balance that remains relatively favorable to labor. 

Mitigating expenses and boosting revenue was the top priority for the vast majority of the remainder of study participants, accounting for 41% of survey responses. 

Employers’ Top Benefit Priorities

According to the survey results, participants ranked the following employee benefits as top priorities for their organizations:

  • Mental Health & Well-being
  • Financial Security
  • Physical Health & Wellness
  • Job Flexibility and Life Balance
  • Caregiving Support

There were of course generational discrepancies in benefit prioritization, for example employees age 46 and older were most interested in preventative health screenings and retirement related financial concerns, whereas employees under 30 placed the highest priority on work-life balance and fitness/wellness initiatives. 

Organizational Data Habits

The study also revealed that while the adoption of better data collection and management practices is becoming fairly widespread across industry in general, there are still significant opportunities to improve internal processes and gain competitive advantages through better/broader data capture and analysis.

Perhaps unsurprisingly given the employee-job-satisfaction focus that many organizational leaders are emphasizing in the new year, the highest rate of adoption among data categories in the survey responses was the collection of employee job satisfaction data, which nearly 3 out of 4 (72%) survey respondents reported collecting.

Only a little more than half of responding organizations gather data on employee retention or productivity (57% and 52%, respectively), which may reflect the continuing prevalence of outdated presumptions about diminishing returns in the quality of these kinds of measures that have not kept up with recent advancements in data analytics.

Interestingly, when it comes to health care, 64% of survey participants conduct a formal review of their health programs every year, but only 44% of respondents gather the necessary health data from their employee population to optimize the effectiveness and utilization of those health programs. 

Strategic Benefit Design Recommendations For Employers 

Based on their analysis, the authors make the following recommendations as to how employers can best adapt to the changing market conditions outlined above:

  • Evaluate current policies in light of the company mission and the evolving tactics being employed by the company in the furtherance of that mission;
  • Consider creating work arrangements and work flexibility policies that take into account the needs of each role/team on a smaller, more granular scale as opposed to a one-size-fits-all approach;
  • Develop employees internally to fill skill gaps and build a stable talent pool; 
  • Prioritize quality benefit outcomes over employee benefit engagement rates; and
  • Provide additional, specialized training for managers and company leaders;

You can read more about this study and the resulting analysis here.