Employee Benefits
2026 Benefits State of the Union: High-Cost Drugs and What They Mean for Your Health Plan
According to Mployer Insights’ 2026 analysis of 50,000+ employer health plans, prescription drugs account for over 25% of total benefit expenses, with Tier 4 specialty drugs driving the majority of high-cost claims. While Tier 4 copays average $123 with coinsurance requirements in 31% of plans, individual oncology therapies like Darzalex Faspro ($170,800/yr) and Keytruda ($158,200/yr) frequently exceed average individual stop-loss deductibles ($141,938). To mitigate exposure, self-funded employers are increasingly turning to independent, transparent PBM models and biosimilar substitution—which yields up to a 73% net cost reduction per patient.
August 9, 2026

The Likely Fastest-Growing Line in Your Benefits Budget

Modern medicine has produced remarkable advances. Cancer therapies that were not available five years ago are now extending and saving lives. Treatments for autoimmune diseases, multiple sclerosis, and rare genetic conditions are giving employees and their families real options where few existed before. As an employer, providing access to these treatments through your benefit plan is one of the most meaningful things your organization does for the people who work there.

It also comes with a financial reality that every benefits decision maker needs to understand clearly. Over 25% of total employer health benefit expenses are now driven by prescription drugs, and within that figure, a small number of specialty drugs account for an outsized share of the cost. A single covered employee on an oncology therapy can generate $100,000 to $170,000 or more in annual drug spend. A handful of members on these treatments can represent a larger budget impact than the entire pharmacy spend of the rest of your workforce combined. The goal is not to restrict access to these medications. The goal is to understand how the system works, how costs flow, and how to structure your plan so that both your employees and your organization are best positioned for the long term.

This piece covers how the pharmacy benefit system works, how your plan’s tier structure determines who pays what, how stop-loss insurance interacts with high-cost drug claims, and what employers can do to manage this exposure thoughtfully.
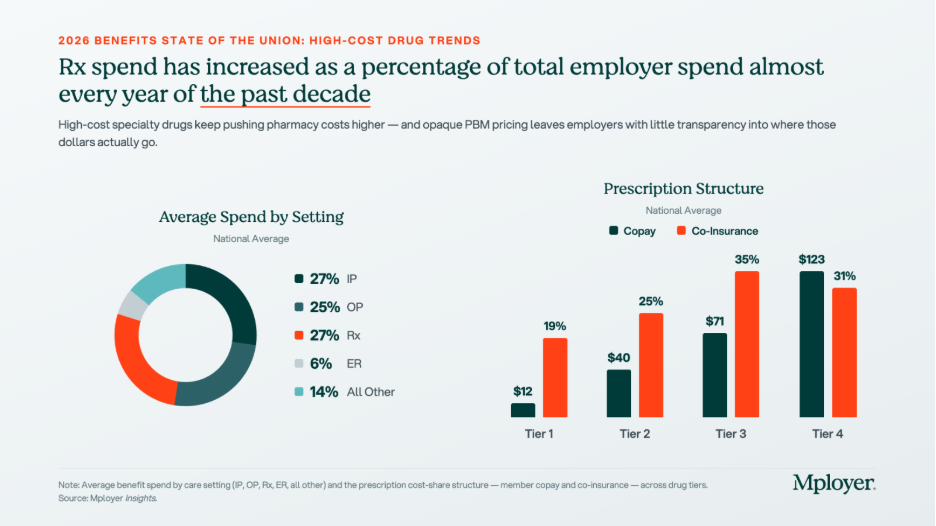
The tier structure in the chart above reflects how plans already account for the cost complexity of specialty drugs. Tier 4, which is where specialty biologics and injectables are typically placed, carries significantly higher cost-sharing than the other tiers: an average employee copay of $123 and coinsurance requirements in 31% of plans. But Tier 4 behaves very differently from the other tiers. On Tier 1, 2, and 3 drugs, cost-sharing is relatively predictable and manageable. On Tier 4, the combination of high drug cost and percentage-based coinsurance can generate out-of-pocket exposure that approaches or exceeds a patient’s annual out-of-pocket maximum in a single month of therapy. How Tier 4 is structured, what controls are in place, and how the plan manages cost is one of the most consequential design decisions an employer makes.

Understanding Your Benefit Plan’s Pharmacy Options

How Pharmacy Benefit Managers Work

Most employer health plans do not manage pharmacy benefits directly. That function is delegated to a Pharmacy Benefit Manager, or PBM, which acts as the intermediary between the health plan, the pharmacy, and the drug manufacturer. The PBM builds and maintains the formulary, negotiates drug prices and rebates with manufacturers, contracts with pharmacy networks, and processes pharmacy claims. The three dominant PBMs, Express Scripts (owned by Cigna), CVS Caremark (owned by CVS Health / Aetna), and OptumRx (owned by UnitedHealth Group), together manage the pharmacy benefits of approximately 80% of covered lives in the United States. Each is affiliated with a major carrier, meaning that employers who use an ASO medical arrangement often default to the carrier’s affiliated PBM without realizing it. Independent PBMs such as Capital Rx, Navitus, and MedOne Pharmacy Benefit Solutions operate on transparent, pass-through pricing models that return all rebates to the plan rather than retaining them as PBM revenue. PBMs are compensated through administrative fees, spread pricing (charging the plan more than the pharmacy receives and keeping the difference), manufacturer rebates in exchange for formulary placement, and specialty pharmacy margin. For any employer managing meaningful specialty drug spend, understanding which of these revenue sources applies to your contract is essential.

How Drug Tiers and Cost-Sharing Work

Every pharmacy benefit plan organizes covered drugs into tiers, with cost-sharing that increases as you move from Tier 1 generics (avg. $12 copay) through Tier 2 preferred brands ($40), Tier 3 non-preferred brands ($71), and into Tier 4 specialty drugs ($123 copay, with coinsurance in 31% of plans). The tier placement of a drug affects both what the employee pays and, indirectly, what the plan pays, since tier placement drives utilization patterns. Plan sponsors have real levers here: step therapy (requiring a patient to try a lower-cost drug first), prior authorization, specialty pharmacy channel mandates, and formulary exclusions all affect Tier 4 cost without eliminating clinical access. These controls require balancing cost management with the reality that for many specialty drugs, no lower-cost alternative achieves the same clinical outcome.

How Stop-Loss Insurance Interacts with High-Cost Drug Claims

For self-funded employers, specialty drug claims are now among the most common triggers for individual stop-loss reimbursement. A single employee on a cancer therapy or rare disease treatment can generate pharmacy claims that exceed the plan’s specific stop-loss deductible, which averages $141,938 nationally for self-insured plans, within a single plan year. The mechanics: the employer pays all claims up to the deductible threshold, and the stop-loss carrier reimburses costs above it. Several dynamics are specific to high-cost drugs. At renewal, stop-loss carriers may laser a known high-cost member by raising their individual deductible or excluding them from coverage. Some carriers now specifically carve out GLP-1 medications or other high-utilization drug categories from stop-loss reimbursement, so employers adding new drug coverage should verify what their contract covers. Specialty drugs can also be administered under either the pharmacy benefit or the medical benefit depending on whether they are self-administered or clinic-administered, and some stop-loss contracts apply different terms to each channel. Employers should model their actual specialty drug cost distribution against their stop-loss deductible at every renewal to understand where the plan’s real exposure sits.

The Costliest Specialty Drugs: What They Treat and What They Cost

The chart below shows the highest-cost specialty and biologic drugs by average cost per patient, ranked from most to least expensive. Cancer therapies dominate the top of the list, but treatments for autoimmune conditions, MS, and inflammatory disease also appear, reflecting how broadly specialty drug spending is distributed across a workforce.
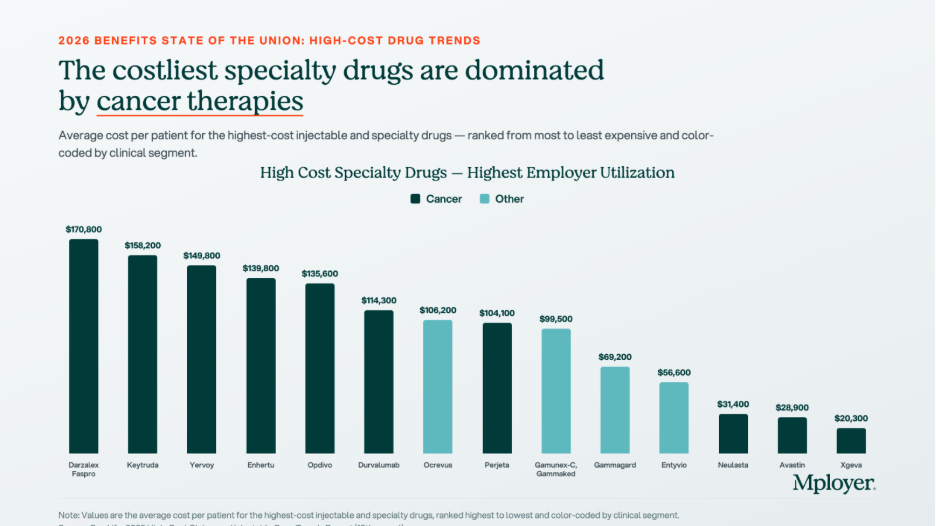
  • Darzalex Faspro (daratumumab/hyaluronidase) | $170,800 avg. annual cost per patient. Janssen (J&J). Multiple myeloma, a blood cancer. The highest-cost drug on the list by average patient cost. The subcutaneous formulation allows home administration, increasing the likelihood it flows through the pharmacy benefit rather than the medical benefit.
  • Keytruda (pembrolizumab) | $158,200 avg. annual cost per patient. Merck. FDA-approved across more than 40 cancer indications including lung, melanoma, head and neck, and bladder cancers. One of the most prescribed oncology drugs globally and one of the most common high-cost pharmacy claims in large employer plans.
  • Yervoy (ipilimumab) | $149,800 avg. annual cost per patient. Bristol-Myers Squibb. Melanoma and in combination with Opdivo for lung and other cancers. Combination Yervoy plus Opdivo therapy is among the highest per-patient drug cost regimens in common use.
  • Enhertu (trastuzumab deruxtecan) | $139,800 avg. annual cost per patient. AstraZeneca / Daiichi Sankyo. HER2-positive and HER2-low breast and gastric cancers. A significant recent clinical advance for patients with cancers that previously had limited options after first-line treatment.
  • Opdivo (nivolumab) | $135,600 avg. annual cost per patient. Bristol-Myers Squibb. Melanoma, lung, kidney, bladder, and other cancers. Frequently used in combination with Yervoy, compounding cost significantly when both are prescribed together.
  • Ocrevus (ocrelizumab) | $106,200 avg. annual cost per patient. Genentech. Relapsing and primary progressive multiple sclerosis. MS therapies are a persistent specialty drug cost driver because patients remain on therapy for years, making each diagnosed member a multi-year plan cost.
  • Entyvio (vedolizumab) | $56,600 avg. annual cost per patient. Takeda. Moderate-to-severe Crohn’s disease and ulcerative colitis. Inflammatory bowel disease therapies are among the most common specialty drug claims in employer plans because the conditions are prevalent in working-age adults.

Biosimilars: The Cost Opportunity Most Employers Are Not Fully Using

A biosimilar is a biologic drug that is highly similar to an already-approved reference biologic, with no clinically meaningful differences in safety, purity, or potency. Biosimilars are not generic drugs in the traditional sense, because biologic drugs are complex proteins manufactured from living cells and cannot be chemically replicated exactly. But they go through an FDA approval pathway that confirms their clinical equivalence to the reference product, and they cost significantly less. The biosimilar market has expanded rapidly as major biologic patents have expired. Humira, the world’s best-selling drug for much of the past decade, now has multiple biosimilar competitors in the U.S. Stelara has followed. The oncology biosimilar pipeline is maturing, with more approvals expected in the next two to three years.
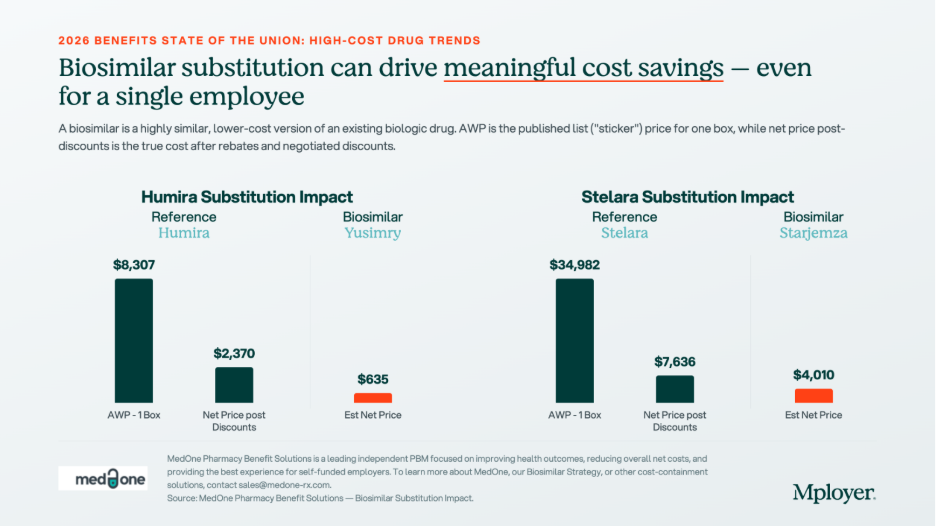
The chart above shows what biosimilar substitution looks like in dollar terms. For Humira, the net price after rebates and negotiated discounts is $2,370 per box. The biosimilar Yusimry has an estimated net price of $635, a 73% reduction. For Stelara, the reference drug net price is $7,636 per box. The biosimilar Starjemza has an estimated net price of $4,010, a 47% reduction. For an employee on monthly Humira therapy, the difference between the reference drug and the biosimilar is approximately $21,000 per year in net plan cost. For a Stelara patient, the annual difference is approximately $43,500. Across even a small number of members on these therapies, biosimilar substitution is one of the highest-return cost management interventions available.

Plan sponsors have four main tools to drive biosimilar adoption: preferred formulary placement (putting the biosimilar on a lower tier and the reference drug on a higher tier), step therapy for new patients, automatic substitution where state law permits, and formulary exclusion of the reference drug entirely. The most important variable in any biosimilar strategy is whether your PBM has a financial incentive to keep the reference drug preferred. A PBM earning a large rebate on Humira has a direct financial reason to keep Humira on the preferred formulary, even when the biosimilar costs the plan less on a net basis. Independent PBMs operating on pass-through pricing remove this conflict entirely, because all rebates return to the plan and formulary decisions are made without a competing financial interest.

What Employers Should Be Asking About Their Pharmacy Benefit

High-cost drug management requires active decisions about PBM contract structure, formulary design, specialty pharmacy strategy, and stop-loss alignment. The questions worth asking at every renewal:

  • Is your PBM contract pass-through or spread-based? A pass-through model means you pay exactly what the pharmacy receives and all rebates come back to the plan. A spread-based model means the PBM earns revenue that is not visible in the administrative fee. Request full compensation disclosure under the CAA requirements.
  • Are you receiving all available biosimilar savings? Ask your PBM for a net cost comparison of each reference drug plus rebate against the available biosimilar net price. The answer will tell you whether your formulary is designed around the plan’s cost interest or the PBM’s rebate interest.
  • What is your specialty drug channel strategy? Are specialty prescriptions being filled through your PBM’s affiliated specialty pharmacy? Carving specialty to an independent pharmacy or using a white-bagging program for clinic-administered drugs can generate meaningful cost differences.
  • How does your stop-loss deductible interact with your specialty drug exposure? Model your actual specialty drug claims against your stop-loss threshold. If most of your high-cost drug claims fall below the deductible, the plan is absorbing those costs without triggering reimbursement.
  • Does your formulary have appropriate Tier 4 controls? Step therapy, prior authorization, and quantity limits on specialty drugs reduce cost without eliminating clinical access. Without these controls, high-cost therapies can be approved and dispensed without any plan-level review of whether a lower-cost alternative exists.

Know How Your Pharmacy Benefit Compares

Pharmacy is now one of the two or three most consequential cost management decisions in health plan design. The employers managing it well are not restricting access to the medications their employees need. They are ensuring that the structure of the benefit, the PBM contract, the formulary design, and the stop-loss coverage work together in the plan’s interest, and that every dollar spent on high-cost drugs is spent as efficiently as possible.

Mployer’s benefits rating evaluates pharmacy benefit design as part of the Medical pillar score, benchmarked against a custom cohort matched by size, region, and industry. Knowing where your pharmacy benefit stands relative to employers who actually look like you is the starting point for making better decisions.

See how your benefits package compares to your custom cohort at MployerAdvisor.com.

Sources

Mployer Insights: Average Spend by Setting, Prescription Structure, and High-Cost Specialty Drugs. Source: Mployer Insights analysis.

MedOne Pharmacy Benefit Solutions: Biosimilar substitution impact data for Humira/Yusimry and Stelara/Starjemza. MedOne is a leading independent PBM focused on improving health outcomes and reducing net costs for self-funded employers. [email protected].

Mployer 2025 and 2026 Employee Benefit Plan Design Study, covering 50,000+ employer plans. Individual stop-loss avg $141,938 self-insured.

Consolidated Appropriations Act of 2021, Section 202: broker/consultant compensation disclosure requirements for group health plans.

FDA Biosimilar approval framework: 42 U.S.C. Section 262(k).
Economy
The Employment Situation for September 2024
The latest economic release from the Bureau of Labor Statistics reports that the U.S. added a respectable 142 thousand new jobs last month, while the unemployment rate fell slightly to 4.2%.
September 9, 2024

Editor's Note: This report is based on survey data from August 2024 that was published in September 2024. This is the most recent data available. (Source: Bureau of Labor Statistics)

For the first time in 5 months, the US unemployment rate has started coming down again, albeit ever so slightly from about 4.2% to 4.1%.

US employers also added 142 thousand jobs to their payrolls, which was a decent performance although about 20 thousand jobs fewer than expected. Downward revisions of the job numbers from the previous 2 months were a bit more substantial, however, accounting for about 80 thousand fewer jobs than previously reported.

The labor force participation rate held steady at about 62.7 million and has been pretty consistent all year long.

The number of people who have part-time jobs because full-time work was not available also essentially held steady at 4.8 million, but it is worth noting that this figure is up almost 15% from 4.2 million just 12 months ago. This change may in part represent a growing number of both employers and employees that have been navigating the softening economy and labor market and waiting for interest rates to come down before reevaluating their labor demand - a wait that will likely soon be over.

Among the 142 thousand jobs added to US employer payrolls last month, the construction industry claimed the largest share, with 34 thousand new jobs - almost an 80% increase over the approximate 19 thousand jobs added by the construction industry on average each of the last 12 months.

The healthcare industry wasn’t far behind with 31 thousand jobs added last month, but that figure represents a significant slow down in healthcare hiring and a major underperformance relative to the approximate 60 thousand jobs by which payrolls in the healthcare industry have increased on average each month over the last year.

The social services industry also added about 13 thousand jobs, down from an average monthly gain of 21 thousand.

While there was little to no change in job figures across the majority of the remainder of industries, the manufacturing industry actually saw a fairly significant reduction in jobs last month, losing 25 thousand positions in the durable goods production industries.

Average hourly pay rose by 4 cents last month, climbing to $35.21 per hour and representing a 0.4% increase over the month before. Average hourly pay has increased by 3.8% over the last year, outpacing inflation by nearly a percentage point over the same time frame.

The average workweek on the other hand increased by one-tenth of an hour up to 34.3 hours per week. In the manufacturing sector, however, the average workweek held steady at about 40 hours per week, but the average amount of overtime inched up one-tenth of a point as well to 3 hours per week.

Mployer’s Take

Last month, Federal Reserve Chair Jerome Powell said that Fed policy goals no longer include any further softening of the labor market, which paves the way for the first interest rate cuts since the Fed began raising rates 2 and a half years ago.

The Fed is expected to lower interest rates when they meet next week and this latest jobs report further solidifies that likelihood, but the main remaining question is how big of a cut they will implement. 

With inflation now down below 3% on an annualized basis, some Fed watchers are expecting a 50 basis point interest rate cut, but the majority seems to be rallying around a more modest 25 basis point cut given the remaining resilience in the job market and economy in addition to the continuing upward pressure on wages.

To be clear, however, a 50 basis point rate cut is still a very real possibility, and is only slightly less likely than a 25 basis point cut.

It’s only a little over a week before September 18th when the Fed is expected to announce whether or not they will be cutting interest rates, and if so by how much, so the speculation about whether and how much rates will be cut this time will very soon be replaced by speculation about whether and how much interest rates will be cut next time when the Fed meets again in the first week of November.

Nothing is certain, of course, but it does seem like some interest rate relief may at long last be at hand. 


While it took less than a year and a half for the Fed to increase interest rates from practically 0 to over 5 and a half percent (in increments of a quarter and half point at a time), however, it is likely going to take much, much longer to bring interest rates back down by even half of the increase we’ve seen since the pandemic.

We still appear to be on track for a relatively soft landing where inflation is tamped down without triggering a swift onset recession, but in order to maintain the delicate balance necessary to avoid some of the worse potential outcomes, this soft landing is going to occur over a very long period of time. 

Check out the Mployer blog here.

Health Insurance Trends
Preliminary Health Insurance Premium Rate Increases for 2025
Preliminary health insurance premium rate increases are starting to be filed by state and are expected to climb considerably on average next year.
August 22, 2024

Key Takeaways

  • Preliminary health insurance premium rate increases are starting to be filed by state and are expected to climb considerably on average next year.
  • These rates cover small group plans but tend to correlate closely with the renewal rates for self-funded insurers as they generally face the same macro-demographic shifts and utilization patterns.
  • These rate hikes are not evenly distributed across states with some seeing major increases and some seeing modest increases or even rate reductions on average in some cases.
  • These rate hikes are only preliminary requests and are typically still subject to review and revision by state regulatory agencies before they can be implemented.
  • Some of the reasons for these rate increases that carriers provide include inflating costs associated with hospital care, pharmaceuticals, and healthcare in general; growing demand for and utilization of medical services; ongoing underestimated COVID-19 expenses; the unwinding of Medicaid; aging populations in some states; better risk analysis; improved quality of carrier services; increased silver loading; premium alignment; and paid-out claims exceeding premiums collected.

ARTICLE | Preliminary Health Insurance Premium Rate Increases for 2025

Preliminary rate changes for 2025 for small group health insurance policy premiums through exchanges have started to be filed. 

For context, the rate at which US healthcare expenditures are rising is expected to hit a 13 year high next year, with data from PwC indicating that medical costs are set to rise by about 8% for group coverage (7.5% for individual coverage), which is half a point above the 2024 growth rates and up significantly from a recent low of 5.5% growth in medical costs recorded in 2017.

At this stage in the process, these proposed rate changes are still open for public comment in many cases and are usually subject to further approval by in-state agencies that cover these insurance-related matters before the changes can be enacted.

Although these rates are not yet finalized, preliminary rates will often pretty closely mirror final rates.

While these proposed rates are not the exact same rates that companies can ultimately get if they are self-funding their employee insurance plans, these rates will usually correlate fairly tightly with the rates that self-funding companies can expect as the employee demographic and healthcare utilization patterns are similar in a given geography.

Proposed 2025 Rate Increases for 2025 Range

Preliminary Rate Changes By State

Here are the proposed rate changes for 2025 plans from all states that have released this information to date.

Alabama

Individual health insurance plan premiums on the exchange are preliminarily set to decrease on (unweighted) average by -3.1% in 2025, while small group plan rates are proposed to climb by an unweighted average of 7.41%.

The largest average rate decrease for individual policies was proposed by Celtic Insurance Co. at - 7.28%, while the smallest increase in small group plan rates was 4.96%, requested by Blue Cross Blue Shield of Alabama.

The largest individual policy average rate increase was proposed by UnitedHealthcare Insurance Co. with a meager rate increase of just 0.55% on average, while VIVA Health requested the largest average rate increase among small group plans at 14.95%.

Alaska

Health insurance premiums in Alaska are currently set to climb by about 17.1% on average for individual plans and plus 11.71% on average unweighted for small group plans next year.

Premera Blue Cross Blue Shield of AK requested the smallest average rate increase for individual policies at 16.26% on average, while UnitedHealthcare Insurance Co. requested the smallest average rate increase for small group plans at 8.65%.

Moda Assurance Co. made the largest requested average rate increase for individual plans among carriers at 19.63%, and the largest average rate increase requested for small group plans was Moda Health Plan, Inc. with an average premium rate increase of 14.77%.

Insurance carriers requesting rate increases largely attribute the need for those increases to inflation in medical/pharmacy costs and utilization. 

Arkansas

Requests to increase premiums for individual and small group health insurance plans through the exchange in 2025 average to about 4.2% for individual plans and about 9.6% for small group plans.

One insurance carrier in Arkansas - QCA Health Plan, Inc. - proposed a decrease of 2% on average for individual policy premiums, while the smallest increase for small group plans was QualChoice Life and Health Ins. Co. Inc. which requested an average rate increase of 4.53%.

USAble HMO Inc. (Octave) requested the largest average rate increase for individual policies at 8.57%. while UnitedHealthcare Insurance Company had the largest small group plan premium rate hike at 15.98%.

Connecticut

Individual and small group health insurance plan premiums via the exchange are currently slated to increase an average of 8.3% in 2025, which is down from 12.4% in 2024. Small group plan rate hike requests average to about 11.9%.

Rate increases were requested by 8 health insurance carriers in Connecticut and are presently under review by the Connecticut Insurance Department, although the public comment period has closed.

CTCare Benefits requested the smallest average rate increase for individual policies at 7.4% while Oxford Health Plans CT had the smallest small group plan premium rate hike at 5.1%.

The largest requested average rate increase for individual plans was made by CTCare Insurance Co. at 12.5%, and the largest average rate increase requested for small group plans was Anthem Health Plans with an average premium rate increase of 13.6%.

The carriers making these requests attribute the increases to overall trends, higher than expected COVID-19 expenses, and the unwinding of Medicaid.

Delaware

Insurance carriers have proposed increasing Individual and small group health insurance plan premiums via the exchange in 2025 by 13.3% and 8%, respectively. 

In the individual market, one carrier proposed reducing premiums by 14%, while the smallest rate increase proposal for the group market was Highmark BCBSD at 8%.

Aetna Health requested the largest average rate increase for individual policies at 34.53%. while UnitedHealthcare had the largest small group plan premium rate hike at 18.2%.

Idaho

Individual and small group health insurance plan premiums are currently slated to increase an average of 6.6% and 9.3% in 2025, respectively.

Mountain Health Co-Op proposed decreasing premiums for individual policies by 2.7% while PacificSource Health Plans requested the smallest premium rate hike among carriers with at least 1% market share for small group plans at 4%.

The largest requested average rate increase for individual plans was made by Regence Blue Shield of Idaho at 11.9%, and the largest average rate increase requested for small group plans was UnitedHealth Insurance Co. with an average premium rate increase of 13%.

Carriers are attributing rate increases in Idaho to health claims paid outpacing premiums collected.

Illinois

Requests to increase premium rates in 2025 for individual health insurance plans in Illinois average to about 4.6%, while the average proposed rate increase to small group plans is an unweighted 9.5%.

Molina Healthcare of IL, Inc. requested the smallest average rate increase for individual policies at 1.6% on average, while MercyCare HMO requested the smallest average rate increase for small group plans at 6.52%, but it is unclear how much market share that MercyCare HMO serves.

Oscar Health Plan, Inc. made the largest requested average rate increase for individual plans among carriers at 19.9%, and the largest average rate increase requested for small group plans was Health Alliance Medical Plans, Inc. with an average premium rate increase of 19.9%.

Indiana

Insurance carriers expect to decrease policy premium expenses for individual health insurance plans through the exchange by an average of - 1.5% in 2025, although the majority of plans are requesting rate increases. Small group plan rates are expected to rise by about 8%.

Coordinated Care Corporation proposed the largest average rate decrease for individual policies at -4.3%, while UnitedHealthcare Insurance Co. proposed the smallest increase for small group policies at 6.54%.

Aetna Health inc. requested the largest average premium rate increase request for individual policies at 10.8%, while Physicians Health Plan of N. Indiana proposed the largest average rate hike for small group premiums at 9.45%.

Maine

Requests to increase premiums for individual and small group health insurance plans via the exchange in 2025 average to about 14.2% and 14.8%, respectively.

The smallest requested average rate increase for individual plans was made by Taro Health Plan of Maine, Inc. at 3.9%, and the smallest average rate increase for small group plans among carriers with at least 1% market share was United Health Insurance with an average premium rate increase of 5.3%.

Harvard Pilgrim Healthcare requested the largest average rate increase for individual policies at 15.8%. while Maine Community Health Options had the largest small group plan premium rate hike at 19.6%.

Maryland

Individual exchange-acquired health insurance plan premiums are currently slated to increase an average of 6.7% in 2025 - with average individual policy rate increase requests ranging from 4.7% to 14.2% - while small group premiums are expected to increase by about 6.11%.

CareFirst BlueChoice requested the smallest average rate increase for both individual policies and small group policies at 4.7% and 4.9%, respectively. 

CareFirst (GHMSI) and CareFirst of Maryland, Inc. shared the largest average premium rate increase request for individual policies, as well, at 14.2%, while Aetna Life Insurance Co. proposed the largest rate hike for small group premiums at 23%.

Massachusetts

Requests to increase premiums for individual and small group exchange health insurance plans in 2025 average to about 8.4%.

Fallon Community Health Plan Inc. requested the smallest average rate increase for both individual and small group policies at 1.4% each. 

The largest requested average rate increase for individual plans among carriers with at least 1% market share was made by Tufts Health Public Plans at 10.4%, and the largest average rate increase requested for small group plans was UnitedHealthcare Insurance Co. with an average premium rate increase of 12.4%.

Rate increases are being attributed primarily to rising hospital and prescription drug costs, although other contributing factors include a population that is aging, risk analysis, general trends, an improved user experience, and use of certain inpatient and outpatient services. 

Michigan

Individual and small group exchange health insurance plan premiums are currently slated to increase an average of 10.5% and 11.2%, respectively, in 2025.

Meridian Health Plan Inc. requested the smallest average rate increase (3.1%) among carriers with at least 1% market share for individual policies, while UnitedHealthInsurance Co. had the smallest small group plan premium rate hike at 4.7%.

Priority Health requested the largest average rate increase for both individual and small group plans was made by Priority Health at 18.89% and 13.2%, respectively.

According to the insurers requesting them, these rate increases are primarily being driven by inflation in medical costs, risk adjustment, changes to plan benefits, and to more accurately reflect past experience. 

Minnesota

Individual health insurance plan premiums are preliminarily slated to increase an average of about 8.7% in 2025. Small group plan premium hike requests have an unweighted average of about 9.4%. 

Medica Insurance Co. requested the smallest average rate increase for both individual and small group policies at 1.95% and 3.71%, respectively.

The largest requested average rate increase for individual plans was made by Blue Plus (HMO Minnesota) at 12.75%, and the largest average rate increase requested for small group plans was Quartz (formerly known as Gundersen) with an average premium rate increase of 15.82%.

New York

Individual health insurance plan premiums are currently slated to increase an average of about 16.2% in 2025 while small group plans are slated to increase by 19%,  although rate increase proposals are currently being reviewed by the New York Department of Financial Services and often result in significantly reduced rates from the initial preliminary figures.

UnitedHealthcare of New York requested the smallest average rate increase for individual policies at 8.8% while MVP Health Plan, Inc. had the smallest small group plan premium rate hike at 9.5%.

The largest requested average rate increase for individual plans was made by HIP of Greater New York at 51%, and the largest average rate increase requested for small group plans was Independent Health Benefits Corporation with an average premium rate increase of 28.1%.

Vermont

The premiums for individual and small group health insurance plans from the exchanges are currently slated to increase an average of 14.9% and 15.1% in 2025, respectively.

For BlueCross Blue Shield plans in Vermont, individual policy rates are expected to climb by 16.3%, while small group rates are expected to climb by 19.1%. 

MVP Health Plans are expected to increase between 2.7% and 34.3%, with an average increase of 11.7%.

These rate increases are largely attributed to increased silver loading and premium alignment.

Washington

The premiums for individual and small group health insurance plans from the exchanges are currently slated to increase an average of 11.3% in 2025, which are presently under review by the Washington Insurance Department.

Of the 13 health insurance carriers that have filed rate increase requests in Washington, the smallest increase was the Community Health Plan of Washington with a 4.5% increase, and the largest rate increase was requested by Regence Blue Shield which requested an increase of 23.8%.

Mployer’s Take

As a reminder, some of these rate increases are likely still to be slashed by state regulatory bodies, so the sticker shock may not ultimately be as bad in some places as it currently appears to be.

Also, self-funding companies are probably going to see somewhat lower rates than the finalized exchange plan rates on average, which will also help a little on the bottom line.

That said, while there rates are still potentially in flux, the ultimate rate increases tend to correlate fairly strongly with preliminary rates. 

On the other hand, these rate increases represent averages across all insurance carriers in a given state (weighted when sufficient data is available), so it is of course a good idea to go ahead and take a look at the premium rate adjustments your insurance carrier is proposing, which may not be final yet but will more accurately reflect the approximate potential rate increases your organization may be facing next year and will help you better prepare in advance for the additional expense.

Economy
The Market Employment Summary for August 2024
Each month, Mployer Advisor breaks down the Bureau of Labor Statistics’ most recent State Employment and Unemployment Summary to highlight some employment trends across various markets. This is an overview of August’s report.
August 19, 2024

Editor's Note: This report is based on survey data from July 2024 that was published in August 2024. This is the most recent data available. (Source: Bureau of Labor Statistics)

The two-tenths of a percent increase registered last month when the US unemployment rate average climbed from 4.1% to 4.3% was the largest jump we’ve seen in almost a year since the rate spiked from 3.5% to 3.8% between July and August 2023. 

In total, 13 states recorded an increase in their state unemployment rate averages over the month of July, led by Massachusetts, Michigan, Minnesota, and South Carolina, which all saw their unemployment rates increase by 0.3%. 

Connecticut was the only state that saw a reduced unemployment rate last month at minus 0.3%.

The 114 thousand new jobs added last month were about 35% below the predicted numbers, while only 2 states - New York and Oregon - registered a meaningful net addition to the number of payroll entries in each state. 

Missouri was the only state last month that recorded a significant net loss in jobs.

Below is the breakdown of the Bureau of Labor Statistics’ (BLS) market employment summary for August 2024.

States With the Highest Unemployment Rates

For 3 months in a row now, Washington DC has had the highest unemployment rate among ‘states’ - up one-tenth of a point from last month to 5.5% - followed by Nevada at 5.4% and California and Illinois at 5.2% unemployment, each.

Washington is the only state that currently has an unemployment rate in the 4% range at 4.9% as of last month, with all the other states coming in in the 3% and 2% unemployment range.

Last month, 13 states saw their unemployment rates climb - Delaware, Georgia, Missouri, and North Dakota each recorded a 0.1% increase; Illinois, Indiana, Kansas, Nevada, and Utah each recorded a 0.2% increase; and Massachusetts, Michigan, Minnesota, and South Carolina each recorded a 0.3% increase in unemployment.

Over the last 12 months, 29 states have seen their unemployment rates increase, led by Rhode Island at plus 1.8%, followed by Ohio and South Carolina at plus 1.1%, and Washington at plus 1.0%.

States With The Lowest Unemployment Rates

South Dakota recorded an unemployment rate of 2.0% last month and retains the title of state with the lowest unemployment rate for the 7th month in a row.

Vermont, North Dakota, and New Hampshire posted the next lowest unemployment rates at 2.1%, 2.2%, and 2.5%, respectively.

The only state that recorded a reduction in its unemployment rate was Connecticut, which saw its unemployment rate drop by 0.3% over the month.

Over the last year, only Arizona and Michigan recorded net reductions in their unemployment rates at minus 0.5% and 0.4% each.

States With New Job Losses

Missouri was the only state to record a net decrease in job numbers over the course of July, dropping a little more than 22 thousand jobs and seeing their payrolls in state reduced by 0.7%.

No state recorded a net reduction in jobs over the course of the last year.

States With New Job Gains

Only New York and Oregon saw their payroll figures climb last month. New York added about 41 thousand jobs and Oregon added about 8 thousand jobs, amounting to about a 0.4% increase each.

Over the last 12 months, California has added the most jobs in terms of raw job numbers at plus about 284 thousand, followed by Texas at plus 265 thousand, and Florida at plus 229 thousand.

The largest proportional job increases over the last year have occurred in South Carolina (plus 3.7%), Nevada (plus 3.3%), Alaska plus (3.1%), and Montana (plus 3.0%).

Mployer's Take: 

Despite a respectable 100 thousand plus new jobs added to US payrolls last month, the employment data from July renewed a lot of speculation about an imminent economic downturn. 

In fact, one of the many metrics used to identify recession known as the Sahm Rule now indicates that we have in fact already entered one - although the accuracy of this metric as applied to the current economic conditions may be less useful than they normally would be as a result of the continuing effects of the COVID dip and recovery.

The stock market saw a steep decline of more than 5% over the first 5 days of the month, as well - which also added fuel to the recession predictors' fire and led to significant speculation that a past-due market correction was at hand.

As of this writing two business weeks later, however, the DOW has recovered 99.5% of the losses in the dip from earlier this month in part due to an influx of cash from retail investors looking to take advantage of some relatively cheaper prices, and a major correction no longer appears to be at hand. 

With the Fed set to meet again in just over 4 weeks and most forecasts predicting a quarter to half point cut in baseline interest rates, we may be in a position soon in which an economic downturn looks less likely than it did even just a few weeks ago.

The fact that trends sometimes appear to be shifting in a matter of weeks speaks to a degree of volatility in the current economic climate, however, and with elections coming up in just a couple months in which control of Congress and the presidency are up for grabs, increased volatility is certainly possible if not likely.

We may soon get the opportunity to find out how much of a stabilizing factor the presumed interest rate cut turns out to be, assuming that it comes to pass in September as expected. 

Looking for more exclusive content? Check out the Mployer blog.

Employee Benefits
The Employers' Guide To Ozempic and GLP-1 Drugs
There's growing demand by employees for increasingly expensive prescription weight-loss solutions as employers weigh the costs and benefits of providing coverage for these drugs when used for weight-loss purposes.
July 22, 2024

Key Takeaways:

  • Ozempic and other GLP-1 drugs have a number of different uses with more still being tested and discovered, but their (sometimes off-label) effectiveness as a weight loss drug has led to a spike in demand in the last couple years that continues to climb
  • These drugs can cost as much as $15 thousand per year per user and represent a growing proportion of total employer health care costs that may have accounted for almost 9% in 2023 - a 2% increase from 2022
  • Some employers are abandoning GLP-1 coverage in the face of those growing expenses, but others are expanding coverage in pursuit of the reduced long-term health care expenditures and a competitive advantage in terms of talent attraction and retention, with about 1 in 3 employers currently covering these drugs for weight loss purposes
  • Some ways employers are attempting to offer these drug treatments for weight loss purpose while also limiting their exposure to excessive expenses include lifetime use caps, minimum body mass thresholds, and limiting drug offerings

ARTICLE | The Employers' Guide To Ozempic and GLP-1 Drugs

The meteoric rise of Ozempic has been widely documented. 

More than just the traditional drug marketing via billboards, commercials, and pamphlets at primary care offices, some of the most heavily publicized evidence of Ozempic’s effectiveness has been found on magazine covers, streaming platforms, and in social media feeds, all providing the kind of organic promotion that even huge sums of money can’t (always) buy.

While to some it may seem like a miracle drug - with potential health benefits including blood sugar regulation, cardiovascular issue risk reduction, and of course weight loss - there is, it seems, at least one catch - Ozempic is very expensive.

The sudden surge in demand as a result of Ozempic’s success has left manufacturers scrambling to keep up, which has contributed to soaring prices and in turn sent employers and insurance providers struggling to adapt to the rapid rise in popularity of a drug that can cost more than $1,000 per person per month. 

Not all employers are addressing that tension between the growing employee demand and the accompanying growing expense in the same way, however, and in this piece we’ll take a look at some of those potential approaches as well as some of the potential costs and benefits associated with each.

Background

Ozempic is a type of drug known as a GLP-1, which is a relatively new class of drugs that first gained approval from the FDA in 2005. 

There are currently at least 10 different GLP-1 drugs, but treating diabetes, cardiovascular conditions, and/or weight loss seem to be fairly consistent among them, although new uses such as treating kidney disease are still being explored.

Ozempic was approved by the FDA as a diabetes medication in the final month of 2017 before hitting the market in earnest the following year, but it wasn’t too long before users and their doctors started taking note of the weight loss side-effect.

Nearly 20 thousand Ozempic prescriptions were written in 2018, which grew to just over 60 thousand active prescriptions in 2019, 100 thousand in 2020, and 160 thousand in 2021. 

But in 2022, Ozempic seems to have crossed the tipping point, with prescriptions doubling to more than 300 thousand over the year before then growing by another 25% - up to about 375 thousand - within the first couple of months of 2023, which is the most recent data available.

Collectively, prescriptions for Ozempic and its GLP-1 weight loss drug competitors have grown by more than 300% over the last 3 years with total US sales growing from less than $5 billion at the end of 2020 to more than $15 billion at the end of 2023. 

According to a Gallup poll released at the end of May 2024, more than 15.5 million people in the US had used one of these drugs for weight loss - representing 6% of the US population and counting. 

GLP-1 Drug Sales In US (Ozempic, Rybelsus, Wegovy)

The Problem

According to the Pew Research Center, about 3 in 4 Americans are either overweight or obese based on current medical classifications, and that number has been growing pretty consistently for a quite awhile.

As a result, the target market of potential Ozempic, et al. weight loss users is considerably larger than the (still substantial) 30 plus million Americans with type 2 diabetes, and although the resulting Ozempic shortages are certainly more problematic for the latter group, any sufficiently substantial surge in demand will make the price goes up for everyone.

While the company that produces Ozempic has plans in the works to build a more than 4 billion dollar factory in order to improve production capacity, any release of demand pressure as a result of the increased accessibility of the drug is still likely several years away at least.

Further, that patent on Ozempic will prevent the production and sale of cheaper generic alternatives until at least 2031 in the US, so no short-term cost-saving hope on that front either.

Given these market conditions, Ozempic-comparable weight loss drugs are likely to continue costing upwards of 15 thousand dollars per patient per year for the foreseeable future. 

For employers, those costs, which essentially were non-existent just a handful of years ago before doctors started prescribing GLP-1 drugs for weight loss, accounted for 8.9% of total employer health care spending in 2023 according to a survey from the International Foundation of Employee Benefits - up from 6.9% of total employer health care expenses the year before. 

Proportion Of Americans Who Are Overweight Or Obese Over Time

How Are Employers Responding

At those prices in the face of near-exponential demand growth, it is not hard to understand why multiple health systems have chosen to drop or reduce weight-loss-based GLP-1 coverage from their employer-sponsored plans, including Hennepin Health Care, University of Texas Health System, and the Mayo Clinic. 

At the same time, however, other employers and health systems are looking past the sticker shock and weighing the totality of health benefits that can accompany weight loss in the cost-benefit analysis, including potential reversal of diabetes, cardiovascular improvements, reduced incidence of certain cancers, and improved arthritic conditions. 

After looking at those net benefits, a growing number of companies including Elevance Health, Kaiser Permanente, and CVS Health are expanding coverage and concluding that it is worth paying the high ticket price of GLP-1 medication for improved patient outcomes and the expectation of reduced expenses in the long run.

In terms of proportional breakdown, those employers who see the value in GLP-1-assisted weight loss are still in the minority, but they have the momentum on their side, with the percentage of employers covering Ozempic or a comparable drug for weight loss purposes rising to 34% in 2023, up from 28% in 2022. 

Further, larger businesses are even more likely to adopt GLP-1 weight loss coverage according to the head of Cigna’s health services business, who also noted that 50% of the employers utilizing their pharmacy benefits management system already cover GLP-1 weight loss uses, and that figure is inching up.

Finding The Right Balance

For those employers who are not yet ready to buy-in completely on the long-term benefits or for whom full coverage of Ozempic and comparable drugs for weight loss purposes is economically infeasible in the short-term, there are still several measures that can be taken in order to minimize the risk of runaway costs while still providing employees with a meaningful option.

  • Lifetime Cap: Some companies are limiting their exposure to excessive GLP-1 weight loss expenses by setting a lifetime cap on the amount of funds available to covered employees. The Mayo clinic, for example, instituted a lifetime cap of $20 thousand per person in order to provide meaningful access to these drugs for weight loss purposes while also putting a ceiling in place on a rapidly growing expense line item. 
  • Minimum Body Mass Threshold: Other companies have set a minimum body mass index that must be met in order to qualify for GLP-1 weight loss drugs, limiting cost exposure by limiting the size of the population with access to these treatments. Fairview Health Services, for example, only offers GLP-1 weight loss coverage to employees with a body mass index of 40 or higher.
  • Limit GLP-1 Options Covered: Some companies also restrict the number of GLP-1 weight loss drug options to only those that are the most cost effective at any given time, which may also reduce demand.

Mployer Advisor’s Take

The appetite for these drugs among employees is likely to continue growing, especially as new treatments and functions emerge (i.e. treating kidney disease), which will likely keep the costs relatively inflated in the short term even as new production capacity comes online.

In the long run, however, short term price inflation may be a small price to pay relative to the long-term benefits that can potentially come from a reduced risk of obesity-related illnesses that go well beyond cost savings, and that’s true for both employers and employees.

But more than just putting upward pressure on the price, that demand reflects health care that is both expensive and increasingly sought after by a large portion of the talent pool, so there’s also an opportunity here to differentiate your organization from the competition in terms of employee attraction and retention.

Although some employers are moving away from Ozempic and other GLP-1 coverage to curb those growing expenses, there are more employers moving in the opposite direction and opening up coverage, and absent an unforeseen change in circumstances, that trend is unlikely to reverse course anytime soon.

Compliance & Policy
Top 25 States With Most Employee-Friendly Paid Leave Laws (Part 2)
Even among states with some paid leave requirements, the nature and degree of those requirements can vary significantly, with some states adopting relatively minimal paid leave requirements and others with paid leave laws that are significantly more involved and comprehensive.
July 11, 2024

Key Takeaways

  • Even among states with paid leave requirements, the nature and degree of those requirements can vary significantly, with some states adopting relatively minimal paid leave requirements and others with paid leave laws that are significantly more involved and comprehensive
  • Employers with operations in different locations or those seeking to expand beyond their city/county/state borders will likely have to take an assortment of paid leave rules into account in crafting and executing their own internal paid leave policies
  • While applicable laws certainly shape paid leave policy and expectation from one place to another, employers that operate in areas with relatively unobtrusive paid leave rules often adopt policies that go well beyond the minimum required of them by the government in order to comply with industry/geographic norms and/or gain a competitive advantage with regard to talent attraction and retention

ARTICLE | Top 25 States With Most Employee-Friendly Paid Leave Laws (Part 2)

In part 1 of this 2 part series, we took a look at the 25 states with the most employer-friendly laws and regulations in terms of the circumstances in which the state may require some or all employers to provide some or all employees with paid leave. 

In this piece, we’ll review the paid leave rules in the remaining 25 states that have more employee-friendly laws and regulations, which includes a much wider spectrum of regulatory involvement, ranging from a relatively minor paid leave requirements that don’t go much beyond what is required in the states covered in Part 1, all the way up to substantial, robust paid leave mandates and worker protections.

Arizona

Arizona paid leave law requires private employers with $500,000 or more in annual revenues to provide their employees with one hour of paid sick leave for every 30 hours worked. 

For employers that have more than 15 or more employees, those employees can accrue up to 40 hours of sick leave per year, while the employees of employers with fewer than 15 employees can accrue a maximum of 24 hours of paid sick leave per year. 

Employers can require employees to wait up to 90 days after the start of their employment before they can use any paid sick leave that has accrued, and employers are not required to pay out any accrued PSL upon termination, employees are allowed to roll over paid sick leave from one year to the next.

Arizona employers are also required to provide up to 3 hours of paid leave to enable employees to vote in any municipal, county, state, or federal primary or general election if those employees do not already have 3 consecutive hours available to them when the polls are open and they are not required to be at work. 

California

California enacted one of the more robust paid sick leave policies among states, requiring pretty much all employers - with few exceptions, such as railroad companies and airlines - to provide at least 40 hours of paid sick leave each year to their employees, even part-time and temporary workers, who have worked at least 30 days out of the first year of their employment. While employees begin accruing pid sick leave as soon as they begin working, accruing at 1 hour of paid sick leave for every hour worked, employees are not legally allowed to use the accrued leave until they have been on the job for at least 90 days.

California state law doesn’t require employers to offer either paid or unpaid vacations, but if an employer chooses to offer PTO, then any unused hours (not including unused paid sick leave) must eventually be paid out with the employee’s last paycheck. 

Further, while California employers are required to allow employees to roll over unused PTO days, as well as up to 80 hours of paid sick leave, they do have significant leeway in determining how many consecutive PTO days an employee can use, preventing employees from using PTO on certain dates, and implementing notice requirements that must be met before leave will be granted. 

California law entitles employees to 8 weeks of paid family leave at between 60% to 70% of employee’s income, up to $1,620 each week in 2024, although importantly this leave is not necessarily job-protected, though other state and federal laws may protect an employees job in this situation nonetheless. State Disability Insurance can also be used as support for up to 1 year with weekly payouts of between 60% -90% of income, capped at $1,325 per week. 

California employees who don’t otherwise have time to vote also get up to 2 paid hours for voting leave if they provide their employers with at least 3 days’ notice of their intent to be away from their job for the purpose of voting.

Colorado

Colorado state law requires all employers to provide paid sick leave, which accrues at a rate of one hour of paid sick leave for every hour worked. That accrued sick leave can be capped at 48 hours per year, but Colorado law requires employers to allow employees to roll over unused paid sick leave from one year to another. 

Colorado employees who earn at least $2,500 per year and have been on the job for at least 180 days are entitled to up to 12 weeks of family leave with partial pay, which can include up to an additional 4 weeks of paid parental leave in the event of pregnancy and/or childbirth complications. 

And while Colorado state law does not require employers to offer paid vacation time, Colorado does require employers to pay out any unused PTO in the event that the employee leaves the company.  

Colorado law also requires employers to pay employees $50 per day for the first 3 days of jury duty service, after which the state will take over jury service compensation. 

Finally, for any employee whose shift starts less than 3 hours after the polls open or ends less than three hours before the polls close, employers must offer up to 2 hours of PTO so that employees can exercise their right to vote, and while employers can choose when an employee votes during the middle of a shift, if the employee requests to vote at the beginning or end of a shift, the employer is obligated to honor that request.

Connecticut

Connecticut law requires employers who had averaged at least 50 employees at some point in the prior year, to provide paid sick leave to employees who work at least 10 hours a week, which accrues at a rate of 1 hour of paid sick leave for every 40 hours worked for up to 40 hour per year, which can be rolled over to the next year if unused. Paid sick leave hours begin accruing immediately, but can not be used until an employee has worked 680 hours on the job. These rules cover most employees, but exceptions include employees who are exempt from overtime and minimum wage rules in accordance with the Fair Labor Standards Act. 

Paid family and medical leave is available to most Connecticut employees (including many sole proprietors and self-employed people) for up to 12 weeks per year (with a potential additional 2 weeks in the event of medical complication) so long as the employee has earned at least $2,325 in one of the previous four quarters, is currently employed, and has been employed for the preceding 12 weeks. Qualifying employees can receive up to 95% of their typical income with a cap set at 60 times the state’s minimum wage, currently $15.69 per hour. 

Further, for the first 5 days of an employee’s jury duty service, Connecticut law requires employers to pay employees $50 per day before the state then takes over those payments. 

While Connecticut voters had been entitled since 2021 to 2 hours of paid time off to vote in special elections and standard elections for state and federal representatives should they request that time off at least 2 days in advance, those rules are set to expire at the end of June 2024, after which time the voting paid time off requirement will no longer be valid absent the intervention of Connecticut lawmakers. 

Delaware

Delaware currently has no laws in effect with regard to paid time off requirements, but beginning January 1, 2026, employees who have worked at least 1,250 hours for an employer over the past year are eligible for up to 12 weeks of paid family and medical leave at a rate equivalent to the lesser of $900 per week or 80% of the employee’s weekly pay. 

Georgia

Georgia state law requires employers with 25 or more employees to allow those employees who work at least 30 hours per week to accrue up to 5 paid sick leave days per calendar year that can be used to care for close family members in need. 

Hawaii

Hawaii state law allows for partial paid leave via Temporary Disability Insurance, which requires that an employee has worked in Hawaii for 14 or more weeks and has worked at least 20 hours and earned at least $400 in each of those weeks, although the weeks need not be in a row and can be spread among multiple employers. Employees can receive up to 67% of their average weekly wages, with a cap that’s currently set around $700 per week. 

While pregnancy and childbirth applications of the temporary disability insurance program usually last between 4 and 6 weeks, the disability insurance generally is available for up to 6 months. 

Hawaiian employees that don’t already have 2 consecutive hours when they are off work and polls are open are also entitled to up to 2 hours of paid voting leave, though employers can require proof that the employee voted. 

Illinois

Illinois state law entitles employees with 1 hour of flex leave for every 40 hours worked (capped at 40 hours per year) that can be used for any purpose. Employees must, however, wait 90 days after their leave time has begun accruing before they can exercise it, and employers are allowed to require 7 days notice before accrued leave can be used and can set a minimum leave usage increment of at least 2 hours. 

Whether or not employees are allowed to roll over unused leave depends on whether employers have front-loaded leave (i.e. provided a pro rated 40 hours on the first day of the year to all employees, in which case employee leave does roll over from one year to the next) or whether employees accrue their hours of leave one at a time - 1 hour of leave for every 40 hours worked as described in the preceding paragraph - in which case leave does roll over. 

Further, while Illinois does not provide for paid sick leave statewide, Cook County and the city of Chicago both have laws in place guaranteeing paid sick leave for employees who have been with their employer for at least 6 months, worked at least 2 hours within the city/county over the last 2 weeks, and have worked at least 80 hours within the last 120 days. Paid sick leave for qualifying employees accrues at 1 hour for every 40 hours worked, capped at 40 hours annually. 

Employees in Illinois are also entitled to up to  2 hours of paid leave in order to vote if their schedule does not already provide for 2 consecutive hours off work during which the polls are open. 

While Illinois does not require most unused leave to be paid out upon termination, if leave has been specifically granted as PTO or vacation, then employers must compensate employees for it when an employee leaves the company.

Louisiana

Louisiana employers are not required to provide paid vacation time, but those employers that choose to offer such PTO are required to pay out any unused time at the conclusion of employment if the employee is eligible for a vacation at that time of their departure according to company policy.

Louisiana employers also must provide employees with one day’s wages on the employee’s first day of jury duty.

Maine

Maine law requires that most employers provide employees with 1 hour of paid leave for every 40 hours worked, capped at 40 hours per year - although there are exceptions including employers with fewer than 10 employees and employees that are seasonal or commission-based. 

If employers front-load employee paid leave banks to 40 hours at the start of each year (or at the start of an individual new employee’s employment) then that leave is not required to roll over, but if the leave is accrued, then roll over is mandated by law. Employers must also pay out any unused leave at the conclusion of an employee’s employment. 

Maryland

Maryland state law requires employers to provide 1 hour of paid sick leave for every 30 hours worked, capped at 40 hours per year, to employees who have worked for the employer at least 12 hours per week for 15 weeks, although the law excludes employees under the age of 18, independent contract workers, seasonal agricultural workers, and those operating under collective bargaining agreements. Further, unused leave can roll over but the bank is capped at 64 hours accumulated total. Employees who work at least 8 hours each week in Montgomery County have their annual sick leave accrual cap set at 56 hours.

For employers with 15 or more employees that do provide paid leave, the Maryland Flexible Leave act provides for paid time off in the event of an illness or death of an immediate family member, as well. 

Maryland employers are also required to provide at least 2 hours of paid voting leave if an employee’s schedule does not already provide for 2 consecutive non-working hours when polls are open. 

Massachusetts

Massachusetts state law does not require employers to provide paid vacation leave, but employers who have adopted such a policy are required to pay out any unused time when the employee leaves the company. 

Massachusetts employees earn 1 hour of paid sick time for every 30 hours worked - capped at 40 hours per year and unusable until the employee has been on the job for at least 90 days - which can be utilized to take care of themselves and/or close family members dealing with physical or mental illness. Employers are allowed to require 7 days notice for appointments that are scheduled in advance, and can also opt to allow employee paid sick leave to accrue on a statutorily-set lump-sum schedule if they don’t want to track the hours worked of individual employees. Employers in Massachusetts also have the option of front-loading paid sick leave for their employees, in which case roll over isn’t required, but roll over is mandated when the leave is accrued.

Massachusetts employees are also entitled to up to 12 weeks of paid family leave and 20 weeks of paid medical leave which can combine to amount to as many as 26 weeks of paid leave in a year. 

Further, Massachusetts employers are required to pay out up to 3 days of jury duty leave.

Michigan

Michigan state employers and private employers with 50 or more employees must provide paid sick leave to employees who work at least 25 hours a week for at least 26 weeks a year, which accrues at a rate of 1 hour of leave for every 35 hours worked, capped at 40 hours per year and can roll over from one year to the next if unused. Employees, however, are not allowed to use accrued leave until their 90th day on the job. Employees exempted from these paid sick leave requirements include workers operating under collective bargaining agreements or those exempt from minimum wage and overtime regulations. 

Minnesota

Minnesota employees who worked at least 80 hours over the last year in Minnesota can accrue 1 hour of paid sick leave for every 30 hours worked, capped at 48 hours per year - but that paid leave doesn’t become available to employees until they’ve been on the job for 90 days. Unused hours also roll over from one year to the next, capped at 80 hours. 

4 cities in Minnesota - Minneapolis, St. Paul, Duluth, and Bloomington - each have additional paid sick laws that go further than the statewide paid sick leave requirements. 

Minnesota employers are also required to allow employees paid leave so they can vote, though no minimum or maximum lengths of time for that leave are specified. 

Nebraska

Nebraska employers are not required to provide any paid vacation leave, but if they do offer such PTO, employers are required to pay out for any PTO that remains unused when an employee leaves the company. Nebraska state law also specifically forbids Nebraska employers from enacting use-it-or-lose-it policies with regard to earned leave, so Nebraska employees are entitled to be paid out for any remaining unused leave at the conclusion of their employment.

Nebraska law also requires employers to provide paid leave for jury duty, and 2 consecutive hours of paid leave to vote in municipal, country, state, and federal primaries and general elections if the employees schedule does not already allow for 2 consecutive off-duty hours during polling hours, though employers retain the right to determine during which hours eligible employees are allowed paid leave in order to vote. 

Nevada

Nevada employers with 50 or more employees must provide flex leave time that can be used for any purpose, which employees acquire at a rate of 0.01923 hours of paid leave per hour worked, which is about 1 hour of paid leave for every 52 hours worked. The law doesn’t apply to temporary, seasonal, and on-call workers, and employers can exempt themselves from the law by providing a flat 40 hours of paid time off each year to each eligible employee. Employers who have been in operation for less than 2 years are also exempt.

Further, Nevada state law doesn’t cap the amount of PTO that employees can accrue, but it does allow employers to limit the amount that employees can use to as little as 40 hours in a benefit year. Employees must also work for 90 days before they are able to use any of the accrued PTO.

Employers are required to provide paid leave for employees to vote, as well: 1 hour of paid leave if the polling place is less than 2 miles away, 3 hours of paid leave if the polling place is more than 10 miles away, and 2 hours of paid leave otherwise. 

New Jersey

New Jersey law mandates that employees earn 1 hour of paid sick leave for every 30 hours worked capped at 40 hours per year, and employees must be on the job for 120 days before utilizing any accrued paid leave. Further, employees are entitled to roll over from one year to the next up to 40 hours of unused paid sick leave, but employers can require up to 7 days notice for appointments and can require reasonable documentation for absences that last 3 or more days in a row. 

New Jersey state law also enables employees to take up to 12 weeks per year of flexible paid family leave, which is funded by the New Jersey Family Leave Insurance Program via payroll deductions. 

New Mexico

New Mexico state law entitles employees to 1 hour of paid sick leave for every 30 hours worked, capped at 64 hours per year, which employees can roll over from one year to the next. 

New Mexico does not require PTO accrual, but if an employer adopts a policy of providing PTO and allowing earned/unused hours to accrue, then unused time off must be paid out when the employee leaves the company. 

Employers in New Mexico must also allow employees 2 hours to vote if polls are not open for 2 hours prior to the start of a shift of 3 hours after the end of a shift. 

New York

New York employers that have between 0 and 4 employees and more than $1 million in revenue and New York employers that have between 5 and 99 employees regardless of revenue must provide employees with 40 hours of paid sick leave per year, accrued at 1 hour of leave for every 30 hours worked. New York employers with 100 or more employees must provide 56 hours of paid sick leave each year.

New York employees are also entitled to 12 weeks of paid family leave per year after they have completed at least 26 weeks in a row of at least 20 hours of work per week. Those leave payments are typically covered through insurance and provide up to 67% of an employee’s average weekly salary, capped at 67% of the statewide average weekly salary, which currently puts the cap at about $1,068 per week.

New York employees are also entitled to collect up to 26 weeks of short-term disability (or 4 to 6 weeks for disability as a result of pregnancy and/or childbirth), but these disability payments are only available during times when an employee is actually, physically unable to perform the job. 

New York state law also requires that employers with more than 10 employees must pay $40 dollars a day for each of the first 3 days of an employee’s jury duty service.

New York employees that don’t have 4 consecutive hours during which to vote are also entitled up to 2 hours of paid voting leave, but employees must notify their employers between 2 and 10 days before their planned voting absence, and employers can choose what time the voting leave is exercised.

Oregon

Oregon employers are not required to provide paid vacation leave, but if they choose to offer it and their employment policies and contracts don’t specifically absolve employers of the responsibility to pay out unused PTO at the conclusion of employment, then employers are required to make those payouts when an employee parts ways with the employer.

Oregon employers with 10 or more employees are required to provide paid sick leave at a rate of 1 hour earned for every 30 hours worked, which is capped at 40 hours per year that can be rolled over to the next year when unused (unless the leave is front-loaded), but any accrued leave can not be used until the employee has worked at least 90 days. 

Oregon employees are also entitled to up to 12 weeks per year of paid family/medical/safe leave via a social insurance program.

Rhode Island

Rhode Island state law requires employers to pay out any unused PTO upon termination if the employee has been on the job for at least 1 year. 

Rhode Island employers that have 18 or more employees are required to provide paid sick leave at a rate of 1 hour for every 35 hours worked (capped at 40 hours per year and capable of roll over from one year to the next), which accrue immediately upon commencement of work but can not be used for the first 90 days of employment. 

Rhode Island employees are also entitled to up to 30 weeks of temporary disability insurance and up to 6 weeks of temporary caregiver insurance, each offering up to about $1000 per week.

Tennessee

Tennessee employers with 5 or more employees are required to provide paid leave for jury duty service, though employees must show their employer their jury summons on the day they receive their jury summons or the day after receiving summons in order to be eligible, and employers can deduct any payment received from the court from the wages owed to the employee. 

Tennessee employers are also required to provide up to 3 consecutive hours of paid vote leave to any employee that does not already have 3 consecutive hours off work when the polls are open. In order to qualify, employees must request paid voting leave by 12pm on the day prior to Election Day.

Tennessee state employees and some metropolitan employees also are eligible for up to 6 weeks of paid family leave. 

Utah

Utah employers are not required to provide PTO, but if they do they must explicitly make clear their policy of not paying out unused PTO upon termination, otherwise unused PTO must be paid out when an employee is terminated. 

Utah employees that don’t already have at least 3 hours off during polling hours are entitled to 2 hours of paid voting leave, provided that they give their employer at least 1 day of advanced notice, and employers may still choose when the leave is exercised.

Vermont

Vermont employees earn 1 hour of paid sick leave for every 52 hours worked, capped at 40 hours per year which can be rolled over from 1 year to the next if unused, but employees may have to wait up to 1 year before utilizing accrued leave. In order to be eligible, however, employees must be at least 18 years old, must have worked at least 20 weeks in the last year, and must have averaged 18 hours per week over the year, as well.

Washington

Washington employers are required to provide employees with paid sick leave that accrues at a rate of 1 hour earned for every 40 hours worked, with up to 40 hours capable of being rolled over from one year to the next. Employees may have to wait 90 days before utilizing the accrued leave, at the employer's discretion. 

The city of Seattle expands upon the statewide paid sick leave rules by allowing the employees of employers that employ between 50 and 259 employees to roll over 56 hours of accrued paid sick leave per year, while employees of employers with 250 or more employees can roll over up to 72 hours per year of unused leave.

Washington state law also provides for a paid family leave insurance program that enables employees to take up to 12 weeks of paid leave for many family and medical events including childbirth under normal circumstances, and up to 18 weeks given certain qualifying events. 

Mployer Advisor’s Take

While the range of regulatory involvement with regard to paid leave varies considerably between states, the bars set by state rulemakers can tend to be on the low-side relative to the actual paid leave benefits offered by companies within those states.

Even in states with no paid leave requirements whatsoever, industry and regional/intra-state norms often set standards that many if not most applicable employers follow, and those norms can sometimes go beyond the heftier mandates laid out by some of the states with more comprehensive regulation, as well.

As a result, in order to maintain a more complete picture of both best practices and talent expectations, it is important to keep up with a changing regulatory environment, both on the state and federal level, as well as benchmarking against comparable employers in the same industry and/or region.

Compliance & Policy
Top 25 States With Most Employer-Friendly Paid Leave Laws (Part 1)
Laws and regulations that mandate paid leave for employees in certain circumstances can vary widely from state to state, from circumstance to circumstance, and even within a given state.
July 11, 2024

Key Takeaways

  • Laws and regulations that mandate paid leave for employees in certain circumstances can vary widely from state to state, from circumstance to circumstance, and even within a given state
  • Employers with operations in different locations or those seeking to expand beyond their city/county/state borders will likely have to take an assortment of paid leave rules into account in crafting and executing their own internal paid leave policies
  • While applicable laws certainly shape paid leave policy and expectation from one place to another, employers that operate in areas with relatively unobtrusive paid leave rules often adopt policies that go well beyond the minimum required of them by the government in order to comply with industry/geographic norms and/or gain a competitive advantage with regard to talent attraction and retention

ARTICLE | Top 25 States With Most Employer-Friendly Paid Leave Laws

Last month, we covered the rising popularity and prevalence of consolidated and unlimited leave policies relative to non-consolidated leave policies, which have now nearly become a minority policy among US employers.

These policy choices and changes do not occur in a vacuum, however, and can be significantly impacted by both industry and geographic norms as well as governmental rules and regulations, which can sometimes vary widely from one state, county, and municipality to another.

While data on the geographic distribution of leave policy structure can be found in our benchmarking reports, available on mployeradvisor.com, this piece will be the first in a pair of articles that will highlight major differences in the rules governing paid leave from state to state in the US, compiled from information primarily from Vacation Tracker and Paycom.

This piece will cover the 25 states that provide the most leeway for employers to determine their own policies with regard to providing employees with paid leave.

Alabama

Alabama state paid leave law requires only that employers provide their employees with paid leave for jury duty if the employee provides notice of jury duty summons within one business day of receiving the summons. Further, that PTO for jury duty service must not reduce the amount of PTO an employee may have otherwise accrued, although employers are permitted to deduct the amount paid to the employee by the court from any amount the employer owes the employee.

Alaska

Alaska state paid leave law requires employers to provide employees with paid voting leave in order to cast ballots in municipal, county, state, and federal primary and general elections if that employee’s shift starts earlier than 2 hours after the polls open or ends later than 1 hour before the polls close. While the employee is to be given sufficient time to enable them to vote, the employer gets to determine the hour(s) when the employee leaves work to cast their vote.

Arkansas

While Arkansas provides no mandatory paid leave for private employees in the state beyond what the policies and contract requirements set by the employers themselves, state law does allow public employees paid sick leave for illness, injury, and the death or illness of a close family member. Those public employees can accrue up to 30 days (depending on employee tenure) of paid sick leave every year.

Arkansas state law also requires state employers to provide paid leave for jury duty, but no similar requirement exists for private employers, although private employers are prohibited from requiring an employee to use vacation or other leave in order to fulfill their jury duty requirements.

Florida

Florida state law imposes no obligations on employers with regard to paid leave for employees.

Idaho

Idaho state law entitles state employees to up to 8 weeks of paid leave following the birth or adoption of a child, but no similar requirement for private employers exists unless the private employer has adopted or contracted to provide such a policy.

Indiana

Indiana state law makes no requirements for employers to provide employees with paid leave.

Iowa

Iowa provides for some paid vacation leave for state employees, but there is no similar requirement for the employees of private employers.

Further, employees who do not have 3 consecutive hours off work during which time polls are open are entitled to up to 3 hours of paid leave in order to cast their votes, though employers have the right to determine which 3 hours are made available to their employees.

Kansas

Kansas has no formal state laws requiring paid leave, although internal leave policies adopted by companies may be legally enforceable against employers if they rise to the level of a “promise.”

Kansas employers must, however, provide employees with up to 2 consecutive hours to vote (including employee non-working hours when the polls are open) and the timing of which the employer has the right to determine.

Kentucky

In Kentucky, employers are not required to offer paid leave for vacation, but if they do offer such paid leave, it is considered essentially equivalent to wages and must be dealt with accordingly - in this case meaning any unused leave of this sort must be paid out when an employee leaves the company.

Further, while Kentucky doesn’t require paid family leave to employees upon the birth of a child, if an employer does provide paid maternity/paternity leave, they must also make those provisions available to newly adoptive parents.

Mississippi

Mississippi state law imposes no obligations on employers with regard to paid leave for employees.

Missouri

Missouri employers are required to provide 3 hours of paid voting leave if employees schedules do not already allow for 3 consecutive non-working hours when the polls are open.

Montana

Montana state law imposes no obligations on employers with regard to paid leave for employees.

New Hampshire

New Hampshire state law imposes no obligations on employers with regard to paid leave for employees, although there is an optional paid family and medical leave insurance program that employers can opt into.

North Carolina

Although North Carolina state law doesn’t require employers to provide paid vacation time, if employers choose to do so and don’t specifically state as a matter of policy or contract that unused PTO will not be paid out when the employee leaves the company, then NC employers are required to make those payouts at the conclusion of employment.

North Dakota

While North Dakota state law doesn’t mandate PTO, employers who choose to offer it are required to pay out unused PTO upon the conclusion of employment, although there are a few exceptions. Employers are not required to pay out unused PTO if the employee does not provide at least 5 days notice prior to their departure or if an employee has been on the job for less than 1 year. Also, employers can provide written notice at the start of their employment that any unused PTO will not be paid out, in which case the employer is not required to pay out unused time.

Ohio

Although Ohio employers are not required to provide paid vacation time, if they do offer paid vacation and employment policy and contracts don’t specifically make it clear that unused PTO will not be paid out when an employee leaves the company, then employers are required to pay out for unused PTO when the employ departs the organization for whatever reason.

Oklahoma

Oklahoma employees are entitled to 2 hours of paid voting leave (and more than 2 hours if their commute to polling place and work would reasonably require it), but employees are required to provide at least 1 day notice to their employer regarding their absence.

Pennsylvania

Pennsylvania employers are not required to provide paid sick leave in general, but employers in Philadelphia, Pittsburgh, and Allegheny County are required to provide employees with paid sick leave.

In Philadelphia, employers with 10 or more employees must provide paid sick leave to employees, which accrues at a rate of 1 hour earned for every 40 hours worked up to 40 hours, which aren’t usable until the employee has been on the job for 90 days.

In Pittsburgh, employees earn 1 hour of paid sick leave for every 35 hours worked, capped at 24 hours per year for employers with fewer than 10 employees and capped at 40 hours total for employers with 10 or more employees.

Allegheny County employers with 26 or more employees must provide them with 1 hour of paid sick leave for every 35 hours worked, capped at 40 hours.

South Carolina

South Carolina state law places no paid leave requirements on employers.

South Dakota

South Dakota employers are required to provide any employee that doesn’t already have 2 consecutive hours off duty when the polls are open with 2 hours of paid vote leave, although the employer can set the time during which the leave is exercised.

Texas

Texas employees who notify their employer in advance and who don’t already have 2 consecutive hours off work during polling hours are entitled to a reasonable amount of paid voting leave.

Virginia

Virginia state law limits paid sick leave requirements to home health care workers who work an average of 20 hours per week or 90 hours per month. Qualifying employees accrue paid sick leave at a rate of 1 hour earned for every 30 hours worked, capped at 40 hours per year and capable of being rolled over from year to year unless the sick leave was frontloaded.

West Virginia

West Virginia employees who don’t already have 3 consecutive hours available when they’re off duty and polls are open are entitled to 3 hours of paid voting leave so long as they provide at least 3 days notice prior to the day of the election.

Wisconsin

Wisconsin state law imposes no obligations on employers with regard to paid leave for employees.

Wyoming

Wyoming employers are required to provide employees (who don’t already have 3 consecutive hours when they are not scheduled at work and polls are open) with 1 hour of paid voting leave, though the employer is allowed to pick when the employee exercises the leave and only has to pay out on the hour of wages owed if the employee actually votes.

Mployer Advisor’s Take

Stay tuned for Part 2 where we'll take a look at the 25 states with more employee-friendly paid leave laws and what they are requiring from employers.