Employee Benefits
2026 Benefits State of the Union: High-Cost Drugs and What They Mean for Your Health Plan
According to Mployer Insights’ 2026 analysis of 50,000+ employer health plans, prescription drugs account for over 25% of total benefit expenses, with Tier 4 specialty drugs driving the majority of high-cost claims. While Tier 4 copays average $123 with coinsurance requirements in 31% of plans, individual oncology therapies like Darzalex Faspro ($170,800/yr) and Keytruda ($158,200/yr) frequently exceed average individual stop-loss deductibles ($141,938). To mitigate exposure, self-funded employers are increasingly turning to independent, transparent PBM models and biosimilar substitution—which yields up to a 73% net cost reduction per patient.
August 9, 2026

The Likely Fastest-Growing Line in Your Benefits Budget

Modern medicine has produced remarkable advances. Cancer therapies that were not available five years ago are now extending and saving lives. Treatments for autoimmune diseases, multiple sclerosis, and rare genetic conditions are giving employees and their families real options where few existed before. As an employer, providing access to these treatments through your benefit plan is one of the most meaningful things your organization does for the people who work there.

It also comes with a financial reality that every benefits decision maker needs to understand clearly. Over 25% of total employer health benefit expenses are now driven by prescription drugs, and within that figure, a small number of specialty drugs account for an outsized share of the cost. A single covered employee on an oncology therapy can generate $100,000 to $170,000 or more in annual drug spend. A handful of members on these treatments can represent a larger budget impact than the entire pharmacy spend of the rest of your workforce combined. The goal is not to restrict access to these medications. The goal is to understand how the system works, how costs flow, and how to structure your plan so that both your employees and your organization are best positioned for the long term.

This piece covers how the pharmacy benefit system works, how your plan’s tier structure determines who pays what, how stop-loss insurance interacts with high-cost drug claims, and what employers can do to manage this exposure thoughtfully.
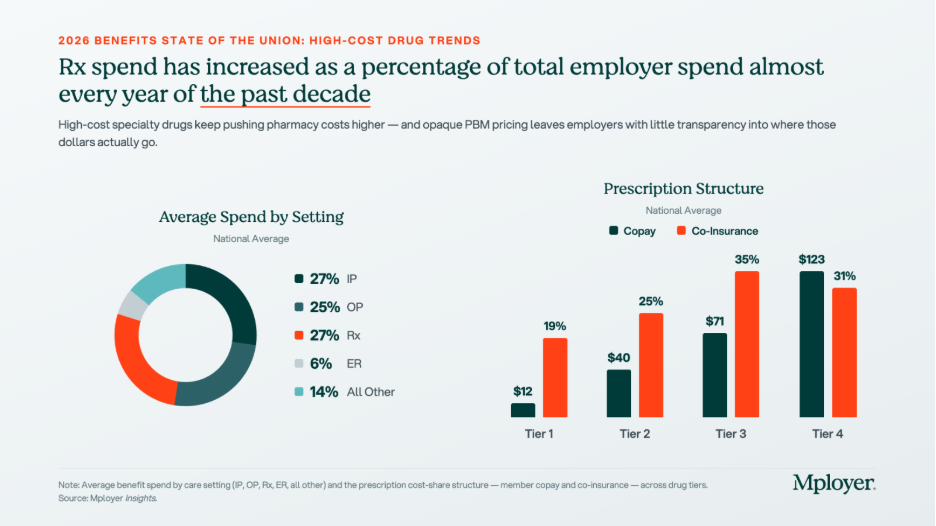
The tier structure in the chart above reflects how plans already account for the cost complexity of specialty drugs. Tier 4, which is where specialty biologics and injectables are typically placed, carries significantly higher cost-sharing than the other tiers: an average employee copay of $123 and coinsurance requirements in 31% of plans. But Tier 4 behaves very differently from the other tiers. On Tier 1, 2, and 3 drugs, cost-sharing is relatively predictable and manageable. On Tier 4, the combination of high drug cost and percentage-based coinsurance can generate out-of-pocket exposure that approaches or exceeds a patient’s annual out-of-pocket maximum in a single month of therapy. How Tier 4 is structured, what controls are in place, and how the plan manages cost is one of the most consequential design decisions an employer makes.

Understanding Your Benefit Plan’s Pharmacy Options

How Pharmacy Benefit Managers Work

Most employer health plans do not manage pharmacy benefits directly. That function is delegated to a Pharmacy Benefit Manager, or PBM, which acts as the intermediary between the health plan, the pharmacy, and the drug manufacturer. The PBM builds and maintains the formulary, negotiates drug prices and rebates with manufacturers, contracts with pharmacy networks, and processes pharmacy claims. The three dominant PBMs, Express Scripts (owned by Cigna), CVS Caremark (owned by CVS Health / Aetna), and OptumRx (owned by UnitedHealth Group), together manage the pharmacy benefits of approximately 80% of covered lives in the United States. Each is affiliated with a major carrier, meaning that employers who use an ASO medical arrangement often default to the carrier’s affiliated PBM without realizing it. Independent PBMs such as Capital Rx, Navitus, and MedOne Pharmacy Benefit Solutions operate on transparent, pass-through pricing models that return all rebates to the plan rather than retaining them as PBM revenue. PBMs are compensated through administrative fees, spread pricing (charging the plan more than the pharmacy receives and keeping the difference), manufacturer rebates in exchange for formulary placement, and specialty pharmacy margin. For any employer managing meaningful specialty drug spend, understanding which of these revenue sources applies to your contract is essential.

How Drug Tiers and Cost-Sharing Work

Every pharmacy benefit plan organizes covered drugs into tiers, with cost-sharing that increases as you move from Tier 1 generics (avg. $12 copay) through Tier 2 preferred brands ($40), Tier 3 non-preferred brands ($71), and into Tier 4 specialty drugs ($123 copay, with coinsurance in 31% of plans). The tier placement of a drug affects both what the employee pays and, indirectly, what the plan pays, since tier placement drives utilization patterns. Plan sponsors have real levers here: step therapy (requiring a patient to try a lower-cost drug first), prior authorization, specialty pharmacy channel mandates, and formulary exclusions all affect Tier 4 cost without eliminating clinical access. These controls require balancing cost management with the reality that for many specialty drugs, no lower-cost alternative achieves the same clinical outcome.

How Stop-Loss Insurance Interacts with High-Cost Drug Claims

For self-funded employers, specialty drug claims are now among the most common triggers for individual stop-loss reimbursement. A single employee on a cancer therapy or rare disease treatment can generate pharmacy claims that exceed the plan’s specific stop-loss deductible, which averages $141,938 nationally for self-insured plans, within a single plan year. The mechanics: the employer pays all claims up to the deductible threshold, and the stop-loss carrier reimburses costs above it. Several dynamics are specific to high-cost drugs. At renewal, stop-loss carriers may laser a known high-cost member by raising their individual deductible or excluding them from coverage. Some carriers now specifically carve out GLP-1 medications or other high-utilization drug categories from stop-loss reimbursement, so employers adding new drug coverage should verify what their contract covers. Specialty drugs can also be administered under either the pharmacy benefit or the medical benefit depending on whether they are self-administered or clinic-administered, and some stop-loss contracts apply different terms to each channel. Employers should model their actual specialty drug cost distribution against their stop-loss deductible at every renewal to understand where the plan’s real exposure sits.

The Costliest Specialty Drugs: What They Treat and What They Cost

The chart below shows the highest-cost specialty and biologic drugs by average cost per patient, ranked from most to least expensive. Cancer therapies dominate the top of the list, but treatments for autoimmune conditions, MS, and inflammatory disease also appear, reflecting how broadly specialty drug spending is distributed across a workforce.
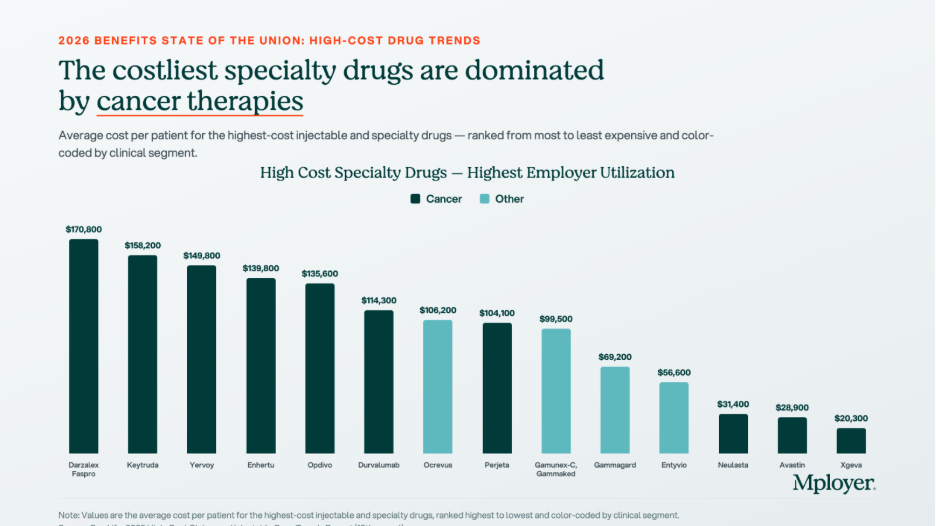
  • Darzalex Faspro (daratumumab/hyaluronidase) | $170,800 avg. annual cost per patient. Janssen (J&J). Multiple myeloma, a blood cancer. The highest-cost drug on the list by average patient cost. The subcutaneous formulation allows home administration, increasing the likelihood it flows through the pharmacy benefit rather than the medical benefit.
  • Keytruda (pembrolizumab) | $158,200 avg. annual cost per patient. Merck. FDA-approved across more than 40 cancer indications including lung, melanoma, head and neck, and bladder cancers. One of the most prescribed oncology drugs globally and one of the most common high-cost pharmacy claims in large employer plans.
  • Yervoy (ipilimumab) | $149,800 avg. annual cost per patient. Bristol-Myers Squibb. Melanoma and in combination with Opdivo for lung and other cancers. Combination Yervoy plus Opdivo therapy is among the highest per-patient drug cost regimens in common use.
  • Enhertu (trastuzumab deruxtecan) | $139,800 avg. annual cost per patient. AstraZeneca / Daiichi Sankyo. HER2-positive and HER2-low breast and gastric cancers. A significant recent clinical advance for patients with cancers that previously had limited options after first-line treatment.
  • Opdivo (nivolumab) | $135,600 avg. annual cost per patient. Bristol-Myers Squibb. Melanoma, lung, kidney, bladder, and other cancers. Frequently used in combination with Yervoy, compounding cost significantly when both are prescribed together.
  • Ocrevus (ocrelizumab) | $106,200 avg. annual cost per patient. Genentech. Relapsing and primary progressive multiple sclerosis. MS therapies are a persistent specialty drug cost driver because patients remain on therapy for years, making each diagnosed member a multi-year plan cost.
  • Entyvio (vedolizumab) | $56,600 avg. annual cost per patient. Takeda. Moderate-to-severe Crohn’s disease and ulcerative colitis. Inflammatory bowel disease therapies are among the most common specialty drug claims in employer plans because the conditions are prevalent in working-age adults.

Biosimilars: The Cost Opportunity Most Employers Are Not Fully Using

A biosimilar is a biologic drug that is highly similar to an already-approved reference biologic, with no clinically meaningful differences in safety, purity, or potency. Biosimilars are not generic drugs in the traditional sense, because biologic drugs are complex proteins manufactured from living cells and cannot be chemically replicated exactly. But they go through an FDA approval pathway that confirms their clinical equivalence to the reference product, and they cost significantly less. The biosimilar market has expanded rapidly as major biologic patents have expired. Humira, the world’s best-selling drug for much of the past decade, now has multiple biosimilar competitors in the U.S. Stelara has followed. The oncology biosimilar pipeline is maturing, with more approvals expected in the next two to three years.
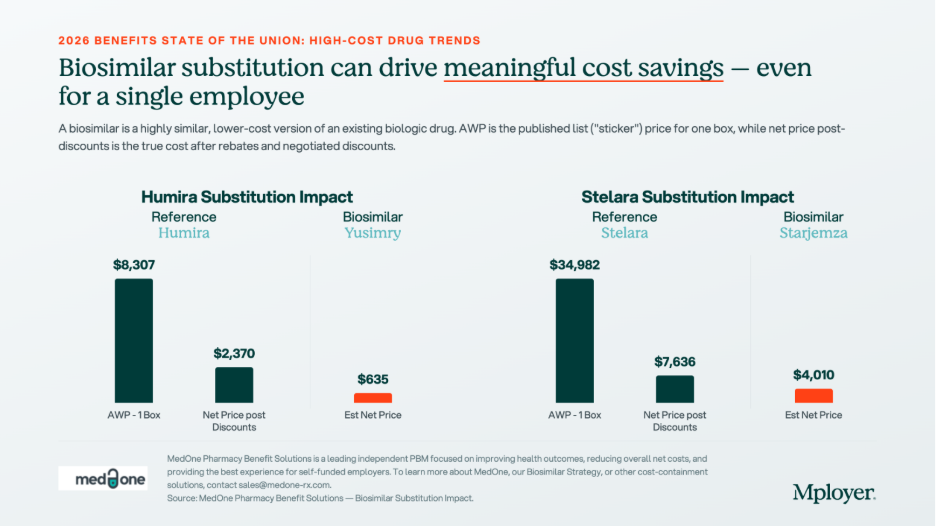
The chart above shows what biosimilar substitution looks like in dollar terms. For Humira, the net price after rebates and negotiated discounts is $2,370 per box. The biosimilar Yusimry has an estimated net price of $635, a 73% reduction. For Stelara, the reference drug net price is $7,636 per box. The biosimilar Starjemza has an estimated net price of $4,010, a 47% reduction. For an employee on monthly Humira therapy, the difference between the reference drug and the biosimilar is approximately $21,000 per year in net plan cost. For a Stelara patient, the annual difference is approximately $43,500. Across even a small number of members on these therapies, biosimilar substitution is one of the highest-return cost management interventions available.

Plan sponsors have four main tools to drive biosimilar adoption: preferred formulary placement (putting the biosimilar on a lower tier and the reference drug on a higher tier), step therapy for new patients, automatic substitution where state law permits, and formulary exclusion of the reference drug entirely. The most important variable in any biosimilar strategy is whether your PBM has a financial incentive to keep the reference drug preferred. A PBM earning a large rebate on Humira has a direct financial reason to keep Humira on the preferred formulary, even when the biosimilar costs the plan less on a net basis. Independent PBMs operating on pass-through pricing remove this conflict entirely, because all rebates return to the plan and formulary decisions are made without a competing financial interest.

What Employers Should Be Asking About Their Pharmacy Benefit

High-cost drug management requires active decisions about PBM contract structure, formulary design, specialty pharmacy strategy, and stop-loss alignment. The questions worth asking at every renewal:

  • Is your PBM contract pass-through or spread-based? A pass-through model means you pay exactly what the pharmacy receives and all rebates come back to the plan. A spread-based model means the PBM earns revenue that is not visible in the administrative fee. Request full compensation disclosure under the CAA requirements.
  • Are you receiving all available biosimilar savings? Ask your PBM for a net cost comparison of each reference drug plus rebate against the available biosimilar net price. The answer will tell you whether your formulary is designed around the plan’s cost interest or the PBM’s rebate interest.
  • What is your specialty drug channel strategy? Are specialty prescriptions being filled through your PBM’s affiliated specialty pharmacy? Carving specialty to an independent pharmacy or using a white-bagging program for clinic-administered drugs can generate meaningful cost differences.
  • How does your stop-loss deductible interact with your specialty drug exposure? Model your actual specialty drug claims against your stop-loss threshold. If most of your high-cost drug claims fall below the deductible, the plan is absorbing those costs without triggering reimbursement.
  • Does your formulary have appropriate Tier 4 controls? Step therapy, prior authorization, and quantity limits on specialty drugs reduce cost without eliminating clinical access. Without these controls, high-cost therapies can be approved and dispensed without any plan-level review of whether a lower-cost alternative exists.

Know How Your Pharmacy Benefit Compares

Pharmacy is now one of the two or three most consequential cost management decisions in health plan design. The employers managing it well are not restricting access to the medications their employees need. They are ensuring that the structure of the benefit, the PBM contract, the formulary design, and the stop-loss coverage work together in the plan’s interest, and that every dollar spent on high-cost drugs is spent as efficiently as possible.

Mployer’s benefits rating evaluates pharmacy benefit design as part of the Medical pillar score, benchmarked against a custom cohort matched by size, region, and industry. Knowing where your pharmacy benefit stands relative to employers who actually look like you is the starting point for making better decisions.

See how your benefits package compares to your custom cohort at MployerAdvisor.com.

Sources

Mployer Insights: Average Spend by Setting, Prescription Structure, and High-Cost Specialty Drugs. Source: Mployer Insights analysis.

MedOne Pharmacy Benefit Solutions: Biosimilar substitution impact data for Humira/Yusimry and Stelara/Starjemza. MedOne is a leading independent PBM focused on improving health outcomes and reducing net costs for self-funded employers. [email protected].

Mployer 2025 and 2026 Employee Benefit Plan Design Study, covering 50,000+ employer plans. Individual stop-loss avg $141,938 self-insured.

Consolidated Appropriations Act of 2021, Section 202: broker/consultant compensation disclosure requirements for group health plans.

FDA Biosimilar approval framework: 42 U.S.C. Section 262(k).
Medical Benefits
Employee Medical Benefits Summary Alabama
How do your benefits compare to other companies in Alabama?
Author:

Medical benefits are an important element of a total compensation package. Medical insurance is critical for employees, whether you work at Montgomery Eye Clinic or Peco Foods. There are approximately 1,500,000 people covered by healthcare in Alabama, regardless of where you work.

The Affordable Care Act (ACA) requires businesses with more than 50 employees to provide health insurance to their workers. This may be accomplished in a variety of ways. As a result, we've split out what medical benefits look like for both small corporations (1-50 employees) and big enterprises (51 or more employees).

Small Employer Guide to Medical Benefits

Cost & Coverage

67% of Alabama small firms with 57,000 employees offer medical benefits, and 67% of workers utilize the benefit. On average, if you're a tiny employer in Alabama, your organization pays for 77% of single employees' premiums and 62% of family premiums, costing you on average $428 per month for individuals and $996 per month for families. Employees must also pay an annual premium of $428 per single and $996 per family on average. Individual component ranges from $390 at the 25th percentile to $735 at the 75th percentile, while a family component is between $390 and $735.

Plan Design

Small businesses may design insurance coverage plans in a variety of methods. High deductible health plans are selected by 17% of employees, 9% select an HMO, and 48% select a PPO. Having numerous plan types to pick from allows for various levels of protection. This can be accomplished through a restricted network that accepts only specific PCPs, specialists, and hospitals or through an open network that offers access to a wide range of doctors and hospitals.

Tax Advantaged Accounts

In Alabama, 33% of businesses provide a Health Savings Account (HSA) and 39% a Healthcare Flexible Spending Account (FSA) to help workers manage their costs while still paying adequately. Either option is an excellent method for employees to save money on medical bills while also saving the employer money.

Dental and Vision

Dental benefits are covered by 26% of small businesses, whereas vision is only provided by 17%, which is far lower than big companies. This is a highly sought-after perk, with 74% using dental services and 78% utilizing vision services. As a result, when employers choose their comprehensive benefits package, both dental and vision are critical options.

Large Employer Guide to Medical Benefits

Cost & Coverage

In Alabama, over 1 million people are enrolled in medical programs through 34,000 large companies, with 74 percent of those benefiting from the benefit. Larger employers are generally able to offer more comprehensive medical insurance than smaller ones. On average, single workers in Alabama receive coverage for 79% of their monthly premiums and families for 70%. Employers pay a monthly premium of $486 per month on average for singles and $1230 per month for families on the employee side. Employees in Alabama must pay an average of $486 per month for single people and $1230 per month for families, with costs ranging from $76 each month for a family at the 25th percentile to $157 each month for a family at the 75th percentile. If you work with a few select Alabama major employers, though, you may benefit from 8.2% coverage of all medical expenditures for single individuals and 1.8 percent coverage of all expenses for families.

Plan Design & Cost

According to the employee demographics, plan types can be chosen for a variety of reasons. 55% of Alabama workers enrolled in PPO plans, 9% enrolled in HMOs, and 29% joined High Deductible Health Plans (HDHPs). The difference in plan type determines the extent of coverage available from providers. It also affects co-payments, deductibles, and other factors.

Tax Advantaged Accounts

A crucial element of a complete benefits package is allowing staff to manage their medical costs in a tax-advantaged manner. What are your options? Flexible Spending Accounts (FSA) and a Health Savings Account (HSA) are popular choices. An HSA is available at 53 percent of large businesses in Alabama, while an FSA is accessible at 64% of these firms.

Dental & Vision

Large firms, on average, have a greater number of dental and vision plan options than small businesses. Large employers in Alabama provide dental coverage to their employees 50% of the time, with 79% taking advantage of that opportunity, and 34% offering vision care with 78% using it.

Medical Benefits Considerations

If you're searching for medical benefits, Mployer Advisor can help you choose a top insurance broker that specializes in your area. Whether you're a small or big company in Alabama, selecting an insurance broker is a crucial decision.

Medical Benefits
Employee Medical Benefits Summary Arkansas
How do your benefits compare to other companies in Arkansas?
Author:

Medical benefits are an important aspect of a complete compensation package and must be provided at a reasonable cost. In Arkansas, about 800,000 people are covered by healthcare, whether you work for Tyson Foods or The Hillshire Brands Company.

The Affordable Care Act (ACA) says that if you have more than 50 workers in the state of Arkansas, you must provide health insurance to your staff. Because this can be achieved in a variety of ways, we've divided it into two categories: small businesses (1-50 employees) and large businesses (51+).

Small Employer Guide to Medical Benefits

Cost & Coverage

There are about 36,000 small businesses in Arkansas with around 140,000 employees. Benefit plans range from the absolute minimum to comprehensive employer coverage. With 64% taking advantage of the benefit, 68% of Arkansas employers provide medical benefits to their staff. The average employer in Arkansas covers 76% for single workers and 59% for families (families). On average, a small business with one employee spends $420 monthly for an individual and $994 monthly for a family. The worker is then responsible for a monthly charge that costs around $420 on average, or $994 for a family. To have an idea of the parameters, consider a family's component, which can range from $423 at the 25th percentile to $983 at the 75th percentile.

Plan Design

When it comes to plan design, 17% of small businesses' employees choose a high deductible health policy, 9% pick an HMO, and 48% opt for a PPO. When choosing a plan design, having several different plan types to pick from allows for coverage choices ranging from a restricted network with access to only certain PCPs, specialists, and hospitals to an open network that includes access to numerous physicians and hospitals.

Tax Advantaged Accounts

Arkansas small businesses can assist their employees in managing expenditures and paying appropriately by promoting tax-optimizing plans like Health Savings Accounts (HSAs) or Healthcare Flexible Spending Accounts (FSAs). Both an HSA and an FSA are excellent methods for employees to manage their medical expenses while saving the company money. 39% of Arkansas's small employers provide an HSA, while 40% provide an FSA.

Dental and Vision

Dental coverage is more common among small businesses, with 31% providing it and 20% offering vision, which is considerably less than big companies. Dental and eye care are two highly desired benefits, with 75% taking advantage of dental services and 72% taking advantage of vision services. As a result, both dental and eye care are important components of employers' comprehensive benefit plans.

Large Employer Guide to Medical Benefits

Cost & Coverage

Over 733,000 individuals in Arkansas benefit from a medical insurance program provided by 19,000 major employers. In general, larger employers are able to provide most comprehensive medical care to their staff. Arkansas's percentage of employees at large enterprises that take advantage of this perk is 70%. Arkansas's largest businesses cover on average 78% of the single employee's monthly premium and 67% of the family premium. The monthly cost for a single individual is $476, and for a family, it's $1227. For employees, this translates to an average of $476 per month for individuals and $1227 per month for families, with costs ranging from $86 each month for a family at the 25th percentile to $179 per month for a family at the 75th percentile. If you're fortunate, 11.4% of large Arkansas businesses cover all medical expenses for single people and 1.8% cover families.

Plan Design & Cost

Depending on variables like age, gender, and job type, employees may select from a variety of alternatives. 55% of workers in Arkansas enrolled in PPO plans, 9% chose to join an HMO, and 29% opted for a High Deductible Health Plan. The difference in plan type has an effect on the amount of insurance coverage available at different medical providers. It also influences co-payments and deductibles.

Tax Advantaged Accounts

Providing employees with methods to manage their medical expenditures from a tax-advantaged standpoint is an important aspect of a comprehensive benefits package. How can you do this? Flexible Spending Accounts (FSA) and a Health Savings Account (HSA) are popular options. An HSA is a type of regulated retirement account in which you deposit money into your employer's health plan to pay for qualified medical expenses. Companies in Arkansas offer 58% of large employers with an HSA, while 65% provide employees with access to an FSA.

Dental & Vision

Larger organizations have a higher offering rate than smaller ones when it comes to dental and vision plans. In Arkansas, 54% of major employers provide dental coverage, while 80% utilize the benefit, whereas 37% offer vision coverage and 72% use the benefit.

Medical Benefits Considerations

If you want assistance selecting an insurance broker that specializes in medical benefits in your area, contact Mployer Advisor right away. Whether you're a small or big business in Arkansas, choosing a broker is a significant decision.


Medical Benefits
Employee Medical Benefits Summary Arizona
How do your benefits compare to other companies in Arizona?
Author:

Employer-sponsored healthcare, particularly in the form of medical plans, is an important aspect of total employee compensation. Across Arizona's top sectors, from Petsmart to Troon Golf, there are roughly 2,300,000 individuals covered by employer-sponsored healthcare.

If you have more than 50 workers in the state of Arizona, the Affordable Care Act (ACA) requires that you provide health insurance to your employees. As a result, we've separated out how this looks for both small businesses (1-50 people) and big enterprises (51 or more).

Small Employer Guide to Medical Benefits

Cost & Coverage

In Arizona, 69% of SMEs provide medical benefits for their workers, and 70% of employees take advantage of the opportunity. With 93,000 small businesses in Arizona with over 350,000 employees, the employer covers 77% for individuals and 65% for families on average. The monthly premium is $445 for an individual and $1098 for a family. The employee has to pay a monthly premium of $445 per person and $1098 per family. At the 25th percentile, the cost of the individual component may be as low as $351, while it can reach up to $765 at the 75th percentile.

Plan Design

Small businesses may use a variety of methods to create their business plans. 13% select high deductible health plans, 29% pick an HMO, and 34% select a PPO. Having several plan variants to select from allows for various levels of coverage. This may be found with a restricted network that includes only specific PCPs, specialists, and hospitals, or with an open network that provides access to numerous physicians and hospitals.

Tax Advantaged Accounts

In Arizona, 46% of businesses provide a Health Savings Account (HSA), while 43% give a Healthcare Flexible Spending Account (FSA) to assist employees in managing their costs and optimizing payments. Either alternative is an excellent approach to assist workers in managing their health-related expenditures in the most cost-effective manner possible with little expense for the employer.

Dental and Vision

Dental and vision benefits are offered by 45% of small companies, whereas only 25% provide dental care, which is far lower than that provided by large businesses. This is a highly valued benefit since 78% take advantage of dental services and 82% utilize vision care. As a result, both dental and vision are critical components in employer-sponsored package of benefits.

Large Employer Guide to Medical Benefits

Cost & Coverage

In Arizona, 48,000 large businesses offer medical coverage to 1,968,000 people. Larger employers, in general, can provide most comprehensive healthcare coverage to their staff. The percentage of employees at big companies in Arizona who take advantage of this benefit is 76%. In the state as a whole, large employers pay an average of 79% of the monthly premium for single workers and 73% of the family's premium. For a single person, the employer cost is $505 per month, or $1356 for a family. For individuals, this translates to an average of $505 per month for single workers and $1356 for families, with costs ranging from $65 each month for a family at the 25th percentile to $181 each month for a family at the 75th percentile. If you are blessed, 9.0% of Arizona's large businesses cover all medical expenses for single people and 4.5% do so for families.

Plan Design & Cost

Depending on the demographics of your staff, you may pick a variety of options. When workers in Arizona sign up for PPO plans, 38% select it, 31% opt for an HMO, and 22% choose a High Deductible Health Plan (HDP). The difference in plan kind influences the scope of coverage available from physicians and hospitals. It also affects co-payments, deductibles, and other factors.

Tax Advantaged Accounts

65% of large Arizona businesses provide a Health Savings Account (HSA) and 69% give a Flexible Spending Account (FSA). Both an FSA and HSA are vital elements in assisting employees with their medical expenditures on a tax-advantaged basis.

Dental & Vision

Large employers, on average, provide dental and vision benefits at a greater frequency than small businesses. Large Arizona companies offer dental plans to their workers 69% of the time, with 83% utilizing that option, and 41% offer vision services with 83%.

Medical Benefits Considerations

If you want assistance in selecting a top insurance broker that specializes in medical benefits in your area, contact Mployer Advisor right now. Whether you're a small or big business in Arizona, picking a broker is an important decision.


Medical Benefits
Employee Medical Benefits Summary Colorado
How do your benefits compare to other companies in Colorado?
Author:

Medical insurance is an important part of a complete compensation package. Providing high-quality, low-cost medical insurance to employees is a crucial element of any total compensation package. Healthcare coverage in Colorado is provided by approximately 2,100,000 people, whether you work for Davita or Agrium U.S.

The Affordable Care Act (ACA) requires that businesses with more than 50 workers in the state of Colorado provide healthcare to their employees. Because this might be achieved in a variety of ways, we've divided it out based on small employers (1-50 people) and large employers (51 or more individuals).

Small Employer Guide to Medical Benefits

Cost & Coverage

There are about 400,000 small businesses in Colorado with roughly 114,000 workers. Benefit programs range from the most basic to full employer coverage. Medical benefits are provided by 69% of Colorado employers, with 70% utilizing the benefit. For individuals in Colorado, the employer covers 77% and 65% for families on average. This costs a small company $445 monthly for an individual and $1098 per family. The employee is then required to pay a monthly premium that ranges from $445 for single people to $1098 for a family. To put things another way, the individual component of a household might range from $351 at the 25th percentile to $765 at the 75th percentile.

Plan Design

In terms of plan design, for small businesses, 13% pick a high deductible health plan, 29% choose an HMO, and 34% select a PPO. These various plan types provide for varying levels of coverage, from a restricted network that includes only certain PCPs, specialists, and hospitals to an open network with access to a variety of physicians and hospitals.


Tax Advantaged Accounts

Colorado small enterprises may assist and manage costs by offering tax-optimizing savings accounts like Health Savings Accounts (HSAs) or healthcare Flexible Spending Accounts (FSAs). In Colorado, 46% of small businesses provide an HSA, while 43% offer an FSA. Both are excellent methods to help employees manage their medical expenses in the most cost-effective way possible for little cost to the employer.

Dental and Vision

When looking at your comprehensive employee benefits program, dental and vision perks are important considerations. Only 25% of small businesses provide vision care, while 45% provide dental coverage. This is significantly lower than what we observe among major employers. Employees take advantage of dental and vision services when they are available, with 78% utilizing dentistry and 82% utilizing eyesight.

Large Employer Guide to Medical Benefits

Cost & Coverage

The 1,761,000 individuals covered by the state's 44,000 large employers receive medical insurance. People all around Colorado benefit from this program. In general, larger businesses are capable of giving their workers the most comprehensive medical coverage. The percentage of people employed by big businesses in Colorado who utilize this benefit is 76%. Large Colorado companies pay an average of 79% of a single employee's monthly premium and 73% of a family's premium each month. For a single person, the average cost per month is $505 for an employer. For a family of two adults and one child, the monthly employer cost is about $1356. For employees, this includes an average of $505 per month for individuals and $1356 per month for families, with costs ranging from $65 each month for a family at the 25th percentile to $181 each month for a family at the 75th percentile. If you're lucky, 9% of big Colorado employers cover all medical expenditures for single persons and 4.5% do so for families.

Plan Design & Cost

Depending on the characteristics of your staff, you may pick a number of different plan types. In Colorado, 38% of employees opted to join a PPO, 31% selected an HMO, and 22% picked a High Deductible Health Plan when enrolling in PPO plans. The choice of plan type determines the breadth of care provided by doctors and hospitals. It also influences co-payments, deductibles, and other elements.

Tax Advantaged Accounts

Providing employees with options to handle their medical expenses on a tax-advantaged basis is an important aspect of a comprehensive benefits package. What can you do? Flexible Spending Accounts (FSA) and a Health Savings Account (HSA) are popular options. 65% of Colorado's major businesses provide an HSA, as well as 69% of employers who offer an FSA.

Dental & Vision

Large employers, on average, provide more dental and vision insurance options than smaller businesses. Large Colorado employers offer dental plans to their employees 69% of the time, and 83% utilize that choice, while 41% offer vision coverage and 83% use it.

Medical Benefits Considerations

If you need assistance in selecting an excellent insurance broker that specializes in medical benefits in your region, contact Mployer Advisor right now. Whether you're a small or big business in Colorado, picking a broker is a significant decision.


401(k) & Retirement
Communicating the Value of Benefits Increases Applications and Improves Close Rates
The labor market remains highly competitive, particularly for skilled and high-performing roles. Despite some macroeconomic cooling, the structural shortage of qualified talent persists: nearly three-quarters of employers continue to report difficulty filling key positions. At the same time, employee expectations have evolved — flexibility, security, and well-being now weigh as heavily as base compensation in determining employer preference
Author:

Competing for Talent in a Constrained Market

The labor market remains highly competitive, particularly for skilled and high-performing roles. Despite some macroeconomic cooling, the structural shortage of qualified talent persists: nearly three-quarters of employers continue to report difficulty filling key positions. At the same time, employee expectations have evolved — flexibility, security, and well-being now weigh as heavily as base compensation in determining employer preference.

For most organizations, benefits represent one of the largest investments in the total rewards portfolio. Yet in practice, those investments are often under-leveraged in the recruiting process. Health coverage, retirement plans, paid time off, and wellness programs frequently appear as a brief bullet point in job descriptions or are mentioned only when an offer is extended. By that stage, the opportunity to differentiate has largely passed.

Mployer’s recent survey of more than 700 companies across 17 industries found that employers who clearly communicate the value of their benefits — and substantiate that value through credible data or recognition — are nine times more likely to be selected by candidates and to convert accepted offers. Transparency and validation drive both higher-quality applicant flow and stronger offer acceptance rates.

Transparency Converts Interest Into Action

In a competitive market, candidates are no longer applying indiscriminately. They evaluate prospective employers through publicly available information, reviews, and visible signals of value. When benefit information is vague, candidates interpret that as a risk. “Competitive benefits” have become shorthand for “average,” and uncertainty creates hesitation.

Conversely, when an organization provides a clear, quantified, and credible overview of its benefits, the dynamic changes immediately. Candidates are more willing to engage early, stay active through the interview process, and make faster, more confident decisions.

  • 89% of candidates say they are more likely to apply when an employer provides clear benefit details.
  • 90% say they are more likely to accept a role when benefits have been recognized or benchmarked externally.

Clarity reduces friction. It replaces speculation with understanding and shifts the employer-candidate relationship from negotiation to alignment.

The Missed Opportunity: The Awkward Offer Conversation

In many recruiting processes today, the discussion around benefits occurs only after a verbal or written offer is made. The exchange is familiar: the candidate receives the offer, reviews the salary, and then pauses at the benefits section — uncertain whether what’s being offered is “good” or “below market.”

Recruiters often find themselves attempting to explain why the plan is competitive, citing anecdotal points about employer contributions or coverage levels. But without comparative data, the explanation sounds defensive, not differentiating. The candidate may nod politely but remain unconvinced — or worse, use the ambiguity to negotiate or delay.

At that stage, the opportunity to use benefits as a selling point has already been lost. The employer is reacting rather than leading.

In contrast, organizations that proactively communicate the strength of their benefits — in quantitative and comparative terms — enter offer discussions from a position of confidence. The candidate already understands the total value being provided and perceives the offer as comprehensive, not partial.

This is the distinction between defending your benefits and leveraging them. One undermines momentum; the other accelerates decisions.

Making Benefits a Strategic Differentiator

Leading employers are now approaching benefits communication as a core component of their talent strategy — not an HR formality. Several best practices have emerged:

  1. Integrate Benefits Early in the Candidate Journey
    Incorporate concise benefit summaries directly into job descriptions, career pages, and early-stage recruiting materials. Candidates should understand your total rewards value before they ever meet a recruiter.
  2. Quantify Total Rewards Clearly
    Provide a simple, high-level estimate of annual benefit value. For example, “This role includes approximately $18,000 in annual benefit value beyond base salary.” Quantification allows candidates to make informed, apples-to-apples comparisons across competing offers.
  3. Leverage Third-Party Validation
    External benchmarks and awards give candidates confidence that your benefits are not only competitive, but verified. Independent recognition communicates quality far more effectively than internal claims.
  4. Equip Recruiters with Data
    Provide recruiters with accessible talking points and benchmark comparisons. When recruiters can articulate specifics — not generalities — they move from explaining to demonstrating.

These practices shorten time-to-hire, increase offer acceptance rates, and strengthen employer brand equity in measurable ways.

From Hidden Cost to Competitive Advantage

For many organizations, benefits are treated primarily as a cost center — a compliance requirement and a necessary expense. In reality, they are one of the most powerful levers available for talent attraction and retention.

When the value of those benefits is communicated with clarity, evidence, and confidence, the perception shifts. The benefits package becomes part of the employer’s market narrative — a tangible signal of how the company invests in its people.

In a tight labor market, that clarity doesn’t just help you attract candidates; it helps you close them.

How Mployer Enables Employers to Compete

Mployer helps organizations turn their benefits into a verified strategic advantage. We independently evaluate and rate employee benefit plans, comparing them across thousands of employers nationwide.

Participating organizations receive a clear assessment of how their benefits stack up against peers, along with recognition materials and benchmarking insights that can be shared directly with candidates. These assets — digital badges, comparison visuals, and concise summaries — give recruiting teams the ability to communicate benefit value credibly and consistently.

Employers across the country are already using Mployer’s data-driven validation to increase applicant volume, improve offer acceptance rates, and reinforce their reputation as employers of choice.

If you’d like to see how your benefits compare, we offer a free initial benchmark report to qualified employers. Join thousands of organizations already leveraging independent proof to strengthen their talent strategy — and move from explaining your benefits to winning with them.

In today’s hyper-competitive labor market, the fight for high-end talent has become a defining business challenge. Organizations invest significant resources into hiring and developing high- performing employees—only to lose them to competitors offering slightly higher pay or better benefits. The cost of voluntary turnover is not only financial; it disrupts operations, damages customer relationships, and erodes company culture.This white paper explores how offering market-competitive benefits—and communicating them effectively—dramatically reduces voluntary turnover. Backed by Mployer’s proprietary benchmarking and benefit rating data, we’ll show how employers that promote their benefits will experience on average 27% lower voluntary turnover each year and potentially up to 51% lower annual turnover compared to peers.

The Cost of Losing Great Talent

Every HR leader and CFO understands the financial cost of turnover—but few quantify its full scope. When an employee leaves voluntarily, costs include:

• Recruiting and onboarding new talent (often 30–50% of annual salary)

• Lost productivity during ramp-up and training

• Knowledge drain, as institutional know-how walks out the door

• Team disruption and morale impacts

• Customer relationship risks when account-facing employees depart

For specialized or customer-integrated roles, this loss compounds. A trained employee with both technical knowledge and deep integration into your teams and clients is a valuable asset—one not easily replaced. Studies show total turnover costs can exceed 1.5x–2x the employee’s annual salary for mid-level positions.

The Talent War: Competing Beyond Compensation

Across industries, the labor market remains tight. Wage competition has intensified, especially in sectors where every dollar per hour matters—manufacturing, wholesale trade, and financial services among them. Employees are increasingly willing to move for small pay increases, unless they clearly understand the total value of their benefits package.This is where benefit perception and communication become critical. When employees can see and understand the full value of what you provide—healthcare coverage, retirement matching, paid leave, mental health support—they’re less likely to be swayed by modest salary increases elsewhere. In short, benefits visibility equals retention power.

The Data: Better Benefits, Better Retention

Mployer Advisor’s analysis found that companies with highly rated benefits and effective benefits communication experience an average of 27% lower voluntary turnover than their peers. That’s a significant impact—one that directly translates into stronger productivity, reduced recruiting costs, and better workforce stability.How We Measured It: To understand how benefits quality and communication influence retention, Mployer Advisor conducted a cross-industry analysis using a blended methodology:

• Sample Group: Thousands of U.S. employers across key industries were evaluated, each with at least 50 full-time employees.

• Benefit Quality Scoring: Companies were benchmarked using Mployer’s proprietary benefit rating system, which integrates multiple data sources—including public ratings, plan benchmarking data, and employee feedback metrics.

• Communication Effectiveness: We measured not just the quality of benefits offered, but how clearly and frequently those benefits were communicated to employees through internal channels, digital materials, and recognition programs.

• Turnover Tracking: Over a 12-month period, we compared voluntary turnover rates among high-rated employers versus industry averages, focusing on trained, professional employees who had completed at least one year of tenure.The outcome was consistent and striking across every major sector: employers who both provide strong benefits and communicate them effectively retain significantly more of their trained workforce.

What this means in Practice - Let's put these numbers into context:

• Example 1: Mid-Sized Manufacturing Firm (200 Employees) Suppose a manufacturing company employs 200 workers with an annual average salary of $60,000 and a typical voluntary turnover rate of 20%. That’s 40 employees leaving each year. Replacing and retraining them at a conservative cost of 1.5× salary would total $3.6 million annually. With improved benefits communication and recognition, this firm could reduce its turnover by 44%—down to 22 separations a year—saving over $1.6 million annually in direct and indirect costs.

• Example 2: Growth-Stage Tech Company (50 Employees) A 50-person software firm might see a 25% voluntary turnover rate in a competitive labor market. Replacing those 12–13 employees could cost roughly $25,000 each in lost productivity and recruiting, totaling $300,000 per year. By improving benefits visibility and achieving results similar to the 27% national average reduction, the company could retain an additional 3–4 key employees annually—saving $75,000–$100,000 and preserving critical institutional knowledge.

The data and the dollars tell the same story: when employees both receive and recognize valuable benefits, they stay longer. Employers who treat benefits as a strategic investment—not just a line-item cost—achieve stronger retention, higher engagement, and measurable savings year over year.

Why Communication Matters as Much as the Benefits Themselves

Even the most generous benefits package fails to deliver ROI if employees don’t fully understand it. HR leaders often underestimate how little employees know about their coverage and perks. A recent survey found that:

• 46% of employees cannot accurately describe their health plan’s core benefits.

• Only 35% believe their employer communicates benefits “very effectively.”

• Yet 68% say that well-communicated benefits would increase their loyalty to the company.

Communicating benefits is no longer a once-a-year open enrollment exercise. It’s a year-round engagement effort that connects the dots between employee well-being and company investment.

Turning Benefits into a Competitive Advantage

This is where the Mployer Benefit Recognition Program makes the difference.

Through our Employer Benefit Award and recognition system, Mployer provides third-party validation that your benefits are not only competitive—but also worthy of public recognition.

Participating employers receive:

• An unbiased benefits rating benchmarked against industry peers

• A benefit summary report highlighting your strongest advantages

• Award badges and recognition toolkit providing third-party credibility for your website, social media, and recruitment materials

• Ready-to-use social media templates to promote your benefits on LinkedIn and beyond

• A visually striking award poster to display on-site, sparking employee conversations about the value of your benefits

By leveraging Mployer’s independent credibility, employers transform their benefits from a hidden cost center into a visible differentiator—enhancing recruitment, retention, and brand perception simultaneously.

Retention Starts with Recognition

In an era defined by labor shortages and rising turnover costs, the companies that win will be those that treat employee benefits not as an expense, but as a strategic investment.

The data tells the story: organizations that both offer competitive benefits and communicate them effectively enjoy up to half the turnover rates of their peers. Recognition, transparency, and consistent messaging are key to helping employees see the true value of what you provide.

Your workforce is your most valuable asset. Make sure they know how much they’re worth.

Learn more or see if your company qualifies for an Employer Benefit Award by visiting Mployer.