Employee Benefits
2026 Benefits State of the Union: High-Cost Drugs and What They Mean for Your Health Plan
According to Mployer Insights’ 2026 analysis of 50,000+ employer health plans, prescription drugs account for over 25% of total benefit expenses, with Tier 4 specialty drugs driving the majority of high-cost claims. While Tier 4 copays average $123 with coinsurance requirements in 31% of plans, individual oncology therapies like Darzalex Faspro ($170,800/yr) and Keytruda ($158,200/yr) frequently exceed average individual stop-loss deductibles ($141,938). To mitigate exposure, self-funded employers are increasingly turning to independent, transparent PBM models and biosimilar substitution—which yields up to a 73% net cost reduction per patient.
August 9, 2026

The Likely Fastest-Growing Line in Your Benefits Budget

Modern medicine has produced remarkable advances. Cancer therapies that were not available five years ago are now extending and saving lives. Treatments for autoimmune diseases, multiple sclerosis, and rare genetic conditions are giving employees and their families real options where few existed before. As an employer, providing access to these treatments through your benefit plan is one of the most meaningful things your organization does for the people who work there.

It also comes with a financial reality that every benefits decision maker needs to understand clearly. Over 25% of total employer health benefit expenses are now driven by prescription drugs, and within that figure, a small number of specialty drugs account for an outsized share of the cost. A single covered employee on an oncology therapy can generate $100,000 to $170,000 or more in annual drug spend. A handful of members on these treatments can represent a larger budget impact than the entire pharmacy spend of the rest of your workforce combined. The goal is not to restrict access to these medications. The goal is to understand how the system works, how costs flow, and how to structure your plan so that both your employees and your organization are best positioned for the long term.

This piece covers how the pharmacy benefit system works, how your plan’s tier structure determines who pays what, how stop-loss insurance interacts with high-cost drug claims, and what employers can do to manage this exposure thoughtfully.
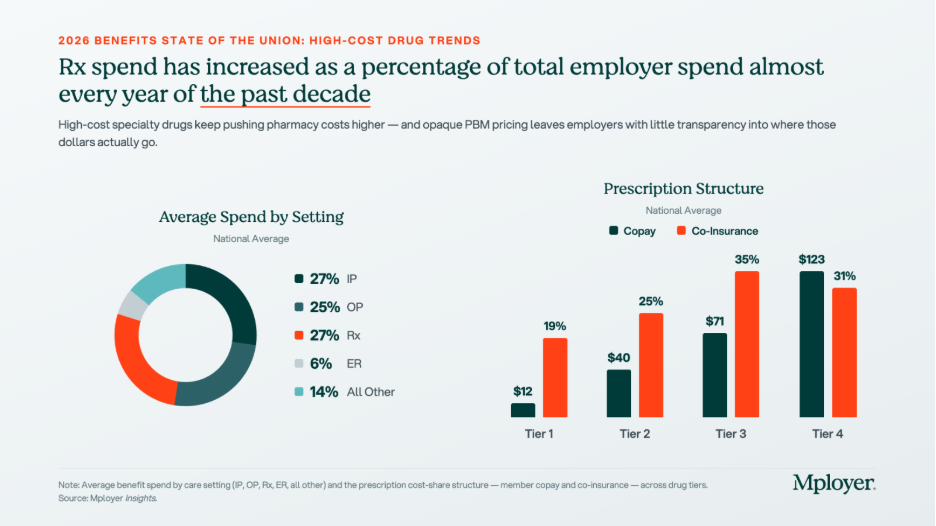
The tier structure in the chart above reflects how plans already account for the cost complexity of specialty drugs. Tier 4, which is where specialty biologics and injectables are typically placed, carries significantly higher cost-sharing than the other tiers: an average employee copay of $123 and coinsurance requirements in 31% of plans. But Tier 4 behaves very differently from the other tiers. On Tier 1, 2, and 3 drugs, cost-sharing is relatively predictable and manageable. On Tier 4, the combination of high drug cost and percentage-based coinsurance can generate out-of-pocket exposure that approaches or exceeds a patient’s annual out-of-pocket maximum in a single month of therapy. How Tier 4 is structured, what controls are in place, and how the plan manages cost is one of the most consequential design decisions an employer makes.

Understanding Your Benefit Plan’s Pharmacy Options

How Pharmacy Benefit Managers Work

Most employer health plans do not manage pharmacy benefits directly. That function is delegated to a Pharmacy Benefit Manager, or PBM, which acts as the intermediary between the health plan, the pharmacy, and the drug manufacturer. The PBM builds and maintains the formulary, negotiates drug prices and rebates with manufacturers, contracts with pharmacy networks, and processes pharmacy claims. The three dominant PBMs, Express Scripts (owned by Cigna), CVS Caremark (owned by CVS Health / Aetna), and OptumRx (owned by UnitedHealth Group), together manage the pharmacy benefits of approximately 80% of covered lives in the United States. Each is affiliated with a major carrier, meaning that employers who use an ASO medical arrangement often default to the carrier’s affiliated PBM without realizing it. Independent PBMs such as Capital Rx, Navitus, and MedOne Pharmacy Benefit Solutions operate on transparent, pass-through pricing models that return all rebates to the plan rather than retaining them as PBM revenue. PBMs are compensated through administrative fees, spread pricing (charging the plan more than the pharmacy receives and keeping the difference), manufacturer rebates in exchange for formulary placement, and specialty pharmacy margin. For any employer managing meaningful specialty drug spend, understanding which of these revenue sources applies to your contract is essential.

How Drug Tiers and Cost-Sharing Work

Every pharmacy benefit plan organizes covered drugs into tiers, with cost-sharing that increases as you move from Tier 1 generics (avg. $12 copay) through Tier 2 preferred brands ($40), Tier 3 non-preferred brands ($71), and into Tier 4 specialty drugs ($123 copay, with coinsurance in 31% of plans). The tier placement of a drug affects both what the employee pays and, indirectly, what the plan pays, since tier placement drives utilization patterns. Plan sponsors have real levers here: step therapy (requiring a patient to try a lower-cost drug first), prior authorization, specialty pharmacy channel mandates, and formulary exclusions all affect Tier 4 cost without eliminating clinical access. These controls require balancing cost management with the reality that for many specialty drugs, no lower-cost alternative achieves the same clinical outcome.

How Stop-Loss Insurance Interacts with High-Cost Drug Claims

For self-funded employers, specialty drug claims are now among the most common triggers for individual stop-loss reimbursement. A single employee on a cancer therapy or rare disease treatment can generate pharmacy claims that exceed the plan’s specific stop-loss deductible, which averages $141,938 nationally for self-insured plans, within a single plan year. The mechanics: the employer pays all claims up to the deductible threshold, and the stop-loss carrier reimburses costs above it. Several dynamics are specific to high-cost drugs. At renewal, stop-loss carriers may laser a known high-cost member by raising their individual deductible or excluding them from coverage. Some carriers now specifically carve out GLP-1 medications or other high-utilization drug categories from stop-loss reimbursement, so employers adding new drug coverage should verify what their contract covers. Specialty drugs can also be administered under either the pharmacy benefit or the medical benefit depending on whether they are self-administered or clinic-administered, and some stop-loss contracts apply different terms to each channel. Employers should model their actual specialty drug cost distribution against their stop-loss deductible at every renewal to understand where the plan’s real exposure sits.

The Costliest Specialty Drugs: What They Treat and What They Cost

The chart below shows the highest-cost specialty and biologic drugs by average cost per patient, ranked from most to least expensive. Cancer therapies dominate the top of the list, but treatments for autoimmune conditions, MS, and inflammatory disease also appear, reflecting how broadly specialty drug spending is distributed across a workforce.
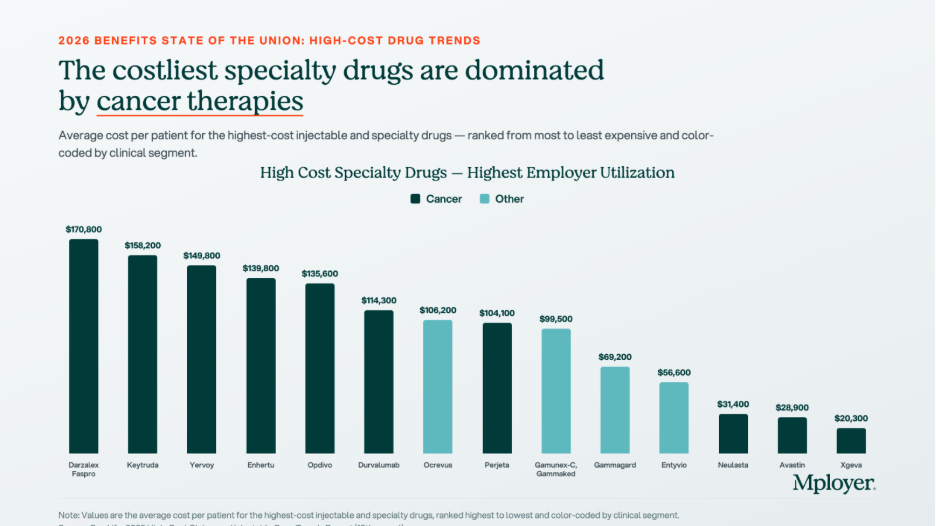
  • Darzalex Faspro (daratumumab/hyaluronidase) | $170,800 avg. annual cost per patient. Janssen (J&J). Multiple myeloma, a blood cancer. The highest-cost drug on the list by average patient cost. The subcutaneous formulation allows home administration, increasing the likelihood it flows through the pharmacy benefit rather than the medical benefit.
  • Keytruda (pembrolizumab) | $158,200 avg. annual cost per patient. Merck. FDA-approved across more than 40 cancer indications including lung, melanoma, head and neck, and bladder cancers. One of the most prescribed oncology drugs globally and one of the most common high-cost pharmacy claims in large employer plans.
  • Yervoy (ipilimumab) | $149,800 avg. annual cost per patient. Bristol-Myers Squibb. Melanoma and in combination with Opdivo for lung and other cancers. Combination Yervoy plus Opdivo therapy is among the highest per-patient drug cost regimens in common use.
  • Enhertu (trastuzumab deruxtecan) | $139,800 avg. annual cost per patient. AstraZeneca / Daiichi Sankyo. HER2-positive and HER2-low breast and gastric cancers. A significant recent clinical advance for patients with cancers that previously had limited options after first-line treatment.
  • Opdivo (nivolumab) | $135,600 avg. annual cost per patient. Bristol-Myers Squibb. Melanoma, lung, kidney, bladder, and other cancers. Frequently used in combination with Yervoy, compounding cost significantly when both are prescribed together.
  • Ocrevus (ocrelizumab) | $106,200 avg. annual cost per patient. Genentech. Relapsing and primary progressive multiple sclerosis. MS therapies are a persistent specialty drug cost driver because patients remain on therapy for years, making each diagnosed member a multi-year plan cost.
  • Entyvio (vedolizumab) | $56,600 avg. annual cost per patient. Takeda. Moderate-to-severe Crohn’s disease and ulcerative colitis. Inflammatory bowel disease therapies are among the most common specialty drug claims in employer plans because the conditions are prevalent in working-age adults.

Biosimilars: The Cost Opportunity Most Employers Are Not Fully Using

A biosimilar is a biologic drug that is highly similar to an already-approved reference biologic, with no clinically meaningful differences in safety, purity, or potency. Biosimilars are not generic drugs in the traditional sense, because biologic drugs are complex proteins manufactured from living cells and cannot be chemically replicated exactly. But they go through an FDA approval pathway that confirms their clinical equivalence to the reference product, and they cost significantly less. The biosimilar market has expanded rapidly as major biologic patents have expired. Humira, the world’s best-selling drug for much of the past decade, now has multiple biosimilar competitors in the U.S. Stelara has followed. The oncology biosimilar pipeline is maturing, with more approvals expected in the next two to three years.
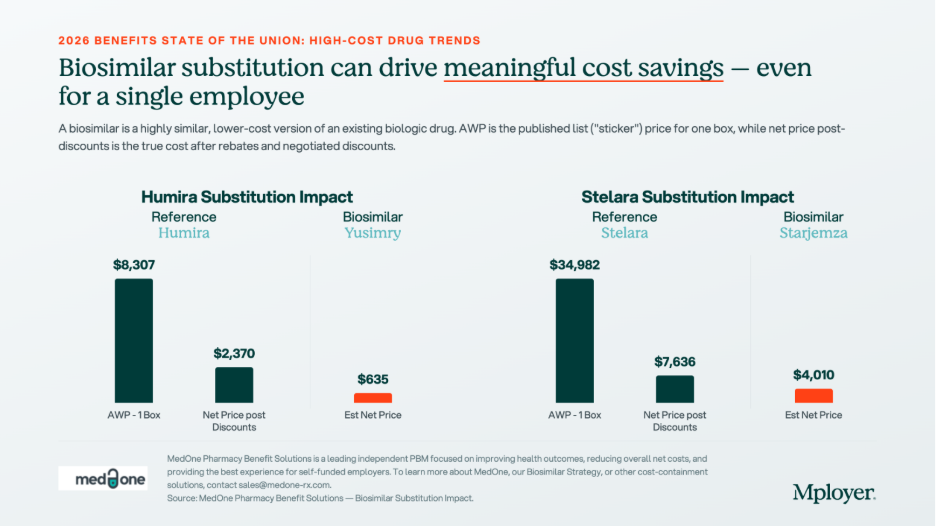
The chart above shows what biosimilar substitution looks like in dollar terms. For Humira, the net price after rebates and negotiated discounts is $2,370 per box. The biosimilar Yusimry has an estimated net price of $635, a 73% reduction. For Stelara, the reference drug net price is $7,636 per box. The biosimilar Starjemza has an estimated net price of $4,010, a 47% reduction. For an employee on monthly Humira therapy, the difference between the reference drug and the biosimilar is approximately $21,000 per year in net plan cost. For a Stelara patient, the annual difference is approximately $43,500. Across even a small number of members on these therapies, biosimilar substitution is one of the highest-return cost management interventions available.

Plan sponsors have four main tools to drive biosimilar adoption: preferred formulary placement (putting the biosimilar on a lower tier and the reference drug on a higher tier), step therapy for new patients, automatic substitution where state law permits, and formulary exclusion of the reference drug entirely. The most important variable in any biosimilar strategy is whether your PBM has a financial incentive to keep the reference drug preferred. A PBM earning a large rebate on Humira has a direct financial reason to keep Humira on the preferred formulary, even when the biosimilar costs the plan less on a net basis. Independent PBMs operating on pass-through pricing remove this conflict entirely, because all rebates return to the plan and formulary decisions are made without a competing financial interest.

What Employers Should Be Asking About Their Pharmacy Benefit

High-cost drug management requires active decisions about PBM contract structure, formulary design, specialty pharmacy strategy, and stop-loss alignment. The questions worth asking at every renewal:

  • Is your PBM contract pass-through or spread-based? A pass-through model means you pay exactly what the pharmacy receives and all rebates come back to the plan. A spread-based model means the PBM earns revenue that is not visible in the administrative fee. Request full compensation disclosure under the CAA requirements.
  • Are you receiving all available biosimilar savings? Ask your PBM for a net cost comparison of each reference drug plus rebate against the available biosimilar net price. The answer will tell you whether your formulary is designed around the plan’s cost interest or the PBM’s rebate interest.
  • What is your specialty drug channel strategy? Are specialty prescriptions being filled through your PBM’s affiliated specialty pharmacy? Carving specialty to an independent pharmacy or using a white-bagging program for clinic-administered drugs can generate meaningful cost differences.
  • How does your stop-loss deductible interact with your specialty drug exposure? Model your actual specialty drug claims against your stop-loss threshold. If most of your high-cost drug claims fall below the deductible, the plan is absorbing those costs without triggering reimbursement.
  • Does your formulary have appropriate Tier 4 controls? Step therapy, prior authorization, and quantity limits on specialty drugs reduce cost without eliminating clinical access. Without these controls, high-cost therapies can be approved and dispensed without any plan-level review of whether a lower-cost alternative exists.

Know How Your Pharmacy Benefit Compares

Pharmacy is now one of the two or three most consequential cost management decisions in health plan design. The employers managing it well are not restricting access to the medications their employees need. They are ensuring that the structure of the benefit, the PBM contract, the formulary design, and the stop-loss coverage work together in the plan’s interest, and that every dollar spent on high-cost drugs is spent as efficiently as possible.

Mployer’s benefits rating evaluates pharmacy benefit design as part of the Medical pillar score, benchmarked against a custom cohort matched by size, region, and industry. Knowing where your pharmacy benefit stands relative to employers who actually look like you is the starting point for making better decisions.

See how your benefits package compares to your custom cohort at MployerAdvisor.com.

Sources

Mployer Insights: Average Spend by Setting, Prescription Structure, and High-Cost Specialty Drugs. Source: Mployer Insights analysis.

MedOne Pharmacy Benefit Solutions: Biosimilar substitution impact data for Humira/Yusimry and Stelara/Starjemza. MedOne is a leading independent PBM focused on improving health outcomes and reducing net costs for self-funded employers. [email protected].

Mployer 2025 and 2026 Employee Benefit Plan Design Study, covering 50,000+ employer plans. Individual stop-loss avg $141,938 self-insured.

Consolidated Appropriations Act of 2021, Section 202: broker/consultant compensation disclosure requirements for group health plans.

FDA Biosimilar approval framework: 42 U.S.C. Section 262(k).
Industry Benefits Summary
Data Processing and Hosting Services Industry- Employee Benefits Summary
How do your benefits compare to other Data Hosting and Processing companies?
Author:

The data hosting and processing service industry is a subsector of the larger Information sector. These organizations are responsible for producing and distributing different channels of communication, as well as accurately handling and preparing data.

Businesses in the data hosting and processing service industry include software publishing services, broadcasting, telecommunications, web search portals, and information services. With more and more businesses choosing to run their operations online, this industry is expected to grow on an average of 3.5% year over year for the next 5 years. As a result, there is a need for quality employees to commit to this expansion with experience and ease.

In this industry, employees are typically skilled workers, and competitive benefit packages can help to attract talented employees. This means that student loan repayment, flexible work schedules are attractive and more creative to entice employees. As a result, employers will experience lower turnover rates, and lower major healthcare utilization and therefore could see lower than average rates on a PM/PM basis.

The Data Hosting and Processing Industry Employment Summary

There are about 30,000 data hosting companies across the nation, employing 828,000 individuals. Businesses in this industry tend to be mid-sized, with an average of 28 employees each. 44% of their employees identify as female, and the median age of each worker is 40 years old.

Data Hosting and Processing Service Industry Benefits Comparison

86%

What percent of data hosting companies offer medical insurance?

  • A full 86% of data hosting companies offer medical insurance, well over the national average of 69%.
  • These firms provide an average monthly employer premium of $1,240 for family coverage. This is slightly above the national average of $1,121.
  • They also provide an average monthly employer premium of $463 for individual coverage. Again, this is slightly over the national average of $456.

75%

What percent of data hosting companies offer short and/or long-term disability insurance?

75% of data hosting businesses offer short-term disability insurance, and 72% provide long-term disability insurance. Comparatively, the national average is 42% and 34%, respectively.

79%

What percent of data hosting companies offer life insurance?

79% of these businesses offer life insurance coverage. The national average is 56%.

47%

Do data hosting companies provide access to paid family leave?

  • 47% provide access to paid family leave, well over the national average of 20%.
  • Unpaid family leave is offered 92% of the time, and the national average is 88%.
  • Consolidated leave plans are used in 44% of businesses, in line with the national average.

Summary

Overall, the data processing and hosting services industry offers extremely competitive benefits, that are well above the general industry standard nationwide. There is only one metric, retirement benefits, that companies in this industry can improve upon. But even still, they currently stand right under the national average, so they don’t have much to improve upon. But when they do, business owners can expect an influx of quality, experienced employees ready to add value and expertise to their teams.

The computer, electronic, and appliance manufacturing industry is included in the goods-producing industries supersector. Its primary concern is manufacturing computers, communications equipment, and other similar electronic products. Working together to design, manufacture, and assemble these products is a wide-ranging field of computer hardware engineers, electrical engineers and technicians, and electronic equipment assemblers.

The rapid growth of this industry indicates that companies will need to hire new and talented employees to keep up with the demand and the pace of technological advancement. Employers advertising robust and comprehensive insurance coverage will attract the top minds in the field to work for their businesses.

A higher amount of physical labor can result in an increased number of workers comp claims and higher overall medical expenses, thus making quality short and long term disability plans important. Additionally, a higher percentage of males are in this industry, and this demographic tends to place importance on having access to employer sponsored healthcare and 401K match benefits.

The Computer, Electronic & Appliance Manufacturing Industry Employment Summary

There are about 18,000 computer, electronic, and appliance manufacturing plants across the country, employing over 1.13 million employees. Companies in this industry are mid-sized, with each one having an average of 64 employees. This is a male-dominated industry, with 30% of employees identifying as female, and the median employee age is 44 years old.

Computer, Electronic & Appliance Manufacturing Industry Benefits Comparison

91%

What percent of computer, electronic, and appliance manufacturing plants offer medical insurance?

  • 91% offer their employees access to medical insurance. This is well above the national average of 69%.
  • These employers provide an average monthly employer premium of $1,234 for family coverage. This is above the national average of $1,121.
  • Additionally, these businesses provide an average monthly employer premium of $452 for individual coverage. This is also a bit below the national average of $458.

65%

What percentage of computer, electronic, and appliance manufacturing plants offer short and/or long-term disability insurance?

65% of computer, electronic, and appliance manufacturing plants offer short-term disability insurance, and 49% provide a long-term disability option. The national average for these metrics is 42% and 34%, respectively.

81%

What percent of computer, electronic, and appliance manufacturing plants offer life insurance?

81% offer access to life insurance coverage. This is well above the national average of 56%.

18%

Do computer, electronic, and appliance manufacturing plants provide access to paid family leave?

  • 18% provide access to paid family leave, which is slightly below the national average of 20%.
  • 92% provide access to unpaid family leave, which is above the national average of 88%.
  • 33% offer consolidated leave plans, which is also slightly below the national average of 44%.

Summary

The computer, electronic, and appliance manufacturing industry stands above the national average for providing all-inclusive employee benefits packages. There are a few opportunities for improvement, including providing access to paid family leave and consolidated leave plans, as well as boosting their retirement benefits offerings. Once these employers improve their employee benefits packages, they will notice how their business can grow and thrive.

Industry Benefits Summary
Dental and Physician Offices Industry- Employee Benefits Summary
How do your benefits compare to other dentist and physician office companies?
Author:

The dentist and physician offices industry handles the diagnosing and treatment of various injuries and illnesses, with dentists focusing primarily on the teeth, gums, and other parts of the mouth. Both professions require years of schooling, training, and certain licenses to practice medicine.<pThe employment rate of dentists and physicians is expected to rise 3% and 4%, respectively, within the next eight years. Considering the experience and time required to become either, companies will have to offer comprehensive benefits packages to beat out the competition and draw the best talent to their door.

High education and training costs to become medical professionals are incurred and usually result in above average income. To supplement that, employers often need a short and/or long term disability plan that pays above rates, which is usually $15K or higher, and is typically not standard and will take specialized resources such as incredible benefits packages. Competitive benefit packages can help to attract talented employees, lower turnover rates, and lower major healthcare utilization and therefore could see lower than average rates on a PM/PM basis. Additionally, student loan repayment, flexible work schedules are attractive and more creative mechanisms like FSAs, HSAs and similar products are likely to be used.

The Dental and Physician Offices Industry Employment Summary

There are about 517,000 dentist and physician offices nationwide, employing over 4.2 million professionals. On average, each business is small, with only 8 staff members. This is a female-dominated industry, with only 22% of employees identifying as male, and the average employee age is 43 years old.

The Dental and Physician Offices Insurance Benefits Comparison

72%

What percentage of these employers offer medical insurance?

  • 72% offer access to medical insurance. This is above the national average of 69%.
  • These businesses provide an average monthly employer premium of $1,118 for family coverage. This is in-line with the national average of $1,121.
  • Additionally, they provide an average monthly employer premium of $484 for individual coverage. This is above the national average of $458.

37%

What percentage of these employers offer short and/or long-term disability insurance?

37% of these employers offer short-term disability coverage, and 39% offer long-term disability insurance. The national average is 42% and 34%, respectively.

60%

What percentage of these employers offer life insurance?

60% offer access to a life insurance plan. Comparatively, the national average is 56%.

26%

Do these employers provide access to paid family leave?

  • 26% provide access to paid family leave. The national average is 20%.
  • 91% provide access to unpaid family leave. The national average is 88%.
  • 67% offer consolidated leave plans. The national average is 44%.

Summary

As a whole, employers in the dental and physician office industry provide all-inclusive employee benefits packages that are above the national industry standard. However, it is important to mention that there are some improvements that can be made when it comes to providing more disability coverage options. But generally speaking, employers in this industry understand the importance of giving comprehensive benefits to meet their employee’s needs.

Industry Benefits Summary
Child Daycare, Sitters, Rehab & Other Social Assistance Industry- Employee Benefits Summary
How do your benefits compare to other child daycare, sitters, rehab, and other social assistance companies?
Author:

The child daycare industry focuses on providing supervision and educational programs for children of all ages. As a result of an increase in women in the workforce as well as single-parent households, the need for daycare staff is increasing throughout the world.

Companies looking to get a jump start on the hiring process are going to need to offer extensive benefits in order to attract experienced, passionate individuals in the childcare field. Generally speaking, this includes access to medical, dental, and vision insurance, disability coverage, paid vacation days, a life insurance policy, and retirement savings options.

The Child Daycare, Sitters, Rehab, and Social Assistance Industry Employment Summary

There are about 100,000 child daycare and social assistance organizations nationwide, employing over 1.4 million professionals. On average, each business tends to be on the smaller side, with 15 staff members. This is a female-dominated industry, and the median employee age is 42 years old.

The  Child Daycare, Sitters, Rehab, and Social Assistance Industry Insurance Benefits Comparison

72%

What percentage of child daycare employers offer medical insurance?

  • 72% offer access to medical insurance. This is just above the national average of 69%.
  • These businesses provide an average monthly employer premium of $1,118 for family coverage. This is in-line with the national average of $1,121.
  • Additionally, they provide an average monthly employer premium of $484 for individual coverage. This is slightly above the national average of $458.

37%

What percentage of child daycare employers offer short and/or long-term disability insurance?

37% of employers offer short-term disability insurance, and 39% provide a long-term disability option. The national average is 42% and 34%, respectively.

60

What percentage of child daycare employers offer life insurance?

60% offer access to a life insurance plan. Comparatively, the national average is 56%.

26%

Do child daycare employers provide access to paid family leave?

  • 26% provide access to paid family leave. The national average is 20%.
  • 91% provide access to unpaid family leave. The national average is 88%.
  • 67% offer consolidated leave plans. The national average is 44%.

Summary

As a whole, the child daycare and social assistance industry stands above the national industry standard of providing comprehensive benefits packages to their employees. There is some room for improvement, such as providing more disability coverage options that will help employers meet all of their employee’s needs. Once these slight changes are made, employers will soon realize how providing all-inclusive employee benefits packages is key to standing out as a differentiator to their competition, while also attracting top-notch and experienced candidates to their team.

Industry Benefits Summary
Business Consulting Industry- Employee Benefits Summary
How do your benefits compare to other Business Consulting companies?
Author:

Business consulting, also known as management consulting, is the act of providing professional advice for a fee. Typically, small business consultants are specialized in a certain field and are hired on a per-diem basis.

The business consulting industry is growing at a steady rate, with a reported 0.5% growth year over year since 2016. This growth drives home the need for employers to invest in valuable employees to ensure the industry continues on a sustainable growth path.

One of the easiest methods to attracting and retaining quality employees is by offering an in-depth employee benefits package as a differentiator to your competition. As these employees are educated and skilled workers, competitive benefit packages can help to attract talented employees and lower turnover rates. Additionally, benefits can help to lower major healthcare utilization and therefore could see lower than average rates on a PM/PM basis. Some examples of this include student loan repayment, flexible work schedules are attractive and more creative mechanisms like FSAs, HSAs and similar products are likely to be used.

The Business Consulting Industry Employment Summary

There are about 248,000 business consulting firms nationwide, employing more than 1.9 million individuals. On average, each firm has 8 employees, and the employee demographics are pretty evenly split between male and female. The median age of each employee is 42 years old.

Business Consulting Insurance Benefits Comparison

87%

What percent of business consulting firms offer medical insurance?

  • 87% of business consulting firms offer medical insurance. This is above the national average of 69%.
  • These firms provide an average monthly employer premium of $1,032 for family coverage. The national average is $1,121.
  • Additionally, they provide an average monthly employer premium of $433 for individual coverage. The national average is $456.

60%

What percent of business consulting firms offer short and/or long-term disability insurance?

60% of business consulting firms provide access to both short and long-term disability insurance. In comparison, the national average is 42% and 34%, respectively.

75%

What percent of business consulting firms offer life insurance?

A full 75% of business consulting firms offer life insurance coverage. The national average is 56%.

20%

Do business consulting firms provide access to paid family leave?

  • A third of all business consulting firms provide access to paid family leave. Comparatively, the national average is 20%.
  • Unpaid family leave is offered 90% of the time, and the national average is 88%.
  • Consolidated leave plans are used in 63% of firms, compared to the national average of 44%.

Summary

As it stands, the business consulting industry stands in-line compared to other nationwide organizations. To improve their employee healthcare insurance for small business consultants, employers can increase their average medical premiums for both family and individual coverage. Amping up these benefits packages will lead to increased employee retainment, which results in cutting costs and increased productivity.

Industry Benefits Summary
Churches, Synagogues, and Religious Organizations Industry- Employee Benefits Summary
How do your benefits compare to other churches, synagogues, and religious organizations?
Author:

The churches, synagogues, and religious organizations industry is comprised of establishments that provide religious worship or promote various religious activities. Generally, this includes convents, monasteries, religiously affiliated community centers, and other houses of worship.

Organizations looking to hire new talent will have to provide comprehensive religious organization employee benefits. These organizations have a higher percentage of part time employees. Usually their boards play a very influential role in who the insurance broker is and the RFP process as well as likely participate in the benefit and insurance carrier plan selection.

The Churches, Synagogues, and Religious Organizations Industry Employment Summary

There are about 187,000 religious organizations nationwide, employing over 1.6 million professionals. On average, each facility is small, with only 9 staff members, and the average employee age is 42 years old.

The Churches, Synagogues, and Religious Organizations Insurance Benefits Comparison

49%

What percentage of religious organizations offer medical insurance?

  • 49% offer access to medical insurance. This is well below the national average of 69%.
  • These businesses provide an average monthly employer premium of $1,043 for family coverage. This is below the national average of $1,121.
  • Additionally, they provide an average monthly employer premium of $502 for individual coverage. This is above the national average of $458.

25%

What percentage of religious organizations offer short and/or long-term disability insurance?

25% of these employers offer short-term disability coverage, and 19% offer long-term disability insurance. The national average is 42% and 34%, respectively.

32%

What percentage of religious organizations offer life insurance?

32% offer access to a life insurance plan. Comparatively, the national average is 56%.

14%

Do religious organizations provide access to paid family leave?

  • 14% provide access to paid family leave. The national average is 20%.
  • 87% provide access to unpaid family leave. The national average is 88%.
  • 34% offer consolidated leave plans. The national average is 44%.

Summary

As a whole, the churches, synagogues, and religious organizations industry stands well below the national average of providing comprehensive employee benefits packages. There is a lot of room for improvement, as employers should increase their benefits offerings as a way to not only meet their employee’s needs, but make them feel valuable and secure.