

.svg)
Inside Mployer’s Benefits Award Methodology
Employee benefits have never mattered more.
In a labor market shaped by rising healthcare costs, changing workforce expectations, and increased transparency, employers are under pressure to offer programs that truly support their people.
That’s exactly why the Mployer Benefits Award exists.
The award isn’t based on opinions, sponsorships, or self-reported marketing claims. It’s built on independent data, consistent scoring, and a clear definition of what “great benefits” actually look like in today’s market.
This post pulls back the curtain on:
How Mployer Determines Top-Tier Benefits
At the core of the Benefit Award is a simple principle: great benefits should be measurable.
Mployer evaluates employer-sponsored health plans using the largest, independent dataset available that reflects real plan design, cost structures, and coverage value across the market. Instead of relying on surveys or subjective rankings, the methodology compares each employer’s offering directly against relevant peers.
This allows Mployer to answer critical questions like:
Employers who earn Gold or Platinum recognition aren’t just “good for their size.”
They are delivering objectively strong value within their competitive landscape.
Behind the Scenes: From Data to Recognition
Behind every Mployer Benefits Award is a structured, data-driven evaluation designed to turn complex benefit information into clear, trustworthy recognition.
The process begins with real plan data by analyzing cost structures, coverage value, and employer investment across a large independent market dataset. Each employer’s benefits are then compared against relevant peers to determine how their offering truly performs in context, not just in isolation.
From there, Mployer applies a standardized scoring model that translates plan performance into an objective, comparable result. This ensures that recognition reflects measurable value delivered to employees, rather than marketing claims or subjective interpretation.
The final award levels are intentionally simple:
What makes this approach unique is its consistency. Every employer is evaluated using the same methodology, the same benchmarks, and the same independent data foundation.
The outcome is recognition employers, employees, and partners can trust because it’s earned through performance, not participation.
Why Independent Validation Matters
For years, employers have had limited ways to prove the strength of their benefits.
Most recognition programs are:
Mployer’s Benefits Award is different because it is independently calculated using real market data.
The Business Impact for Employers
Independent validation isn’t just about recognition, it delivers real strategic value.
Candidates increasingly ask: “How good are our benefits really?”
An objective award provides instant credibility and differentiation in a competitive hiring market.
Recognition signals that an employer’s benefits strategy is working, which strengthens relationships with advisors, carriers, and leadership stakeholders.
Healthcare spending is one of the largest line items for employers.
Independent scoring confirms whether that investment is translating into meaningful value for employees.
Raising the Standard for Employee Benefits
The broader mission behind the Mployer Benefits Award is simple: bring transparency and accountability to the benefits market.
When employers can clearly see how their plans compare, the entire system improves.
Better benchmarking leads to:
Recognition is just the visible result of a much bigger goal: making high-quality benefits the norm, not the exception.
See Where Your Benefits Stand
Whether an employer earns Gold, Platinum, or is still improving, the most important outcome is clarity. Because once you can measure benefits objectively, you can make them better.
Upload you plan documents to get your free benefit rating here: https://portal.mployeradvisor.com/employerprocess

.png)

What Every Benefits Decision Maker Needs to Know
If you sit on a benefits committee, approve vendor contracts, set plan design, or sign off on employee benefit programs, you are a fiduciary under ERISA. That responsibility comes with real legal exposure, and the litigation environment surrounding it has grown substantially over the past decade. The Consolidated Appropriations Act of 2021 added new teeth to this exposure by requiring health insurance brokers and consultants to disclose all direct and indirect compensation they receive in connection with employer health plans. That disclosure requirement has become a direct underpinning of a new and expanding wave of ERISA lawsuits, as plaintiff firms use disclosed compensation data to allege that employers failed to monitor whether their brokers were acting in the plan’s interest or their own, including in voluntary benefit programs where broker commissions are now under direct scrutiny. Understanding that environment is not a reason for alarm. It is a strong reason to ensure your process is documented, your decisions are benchmarked, and your programs are structured in a way that reflects the care the law requires.
The Employee Retirement Income Security Act of 1974, known as ERISA, was enacted to protect employees from the mismanagement of benefits promised to them. It does that by imposing fiduciary duties on anyone who exercises discretionary authority over a benefit plan or its assets, from benefits committee members and HR leaders to the brokers and consultants who advise them.
This post explains who is at risk, what the key legal theories are, and where this is heading.
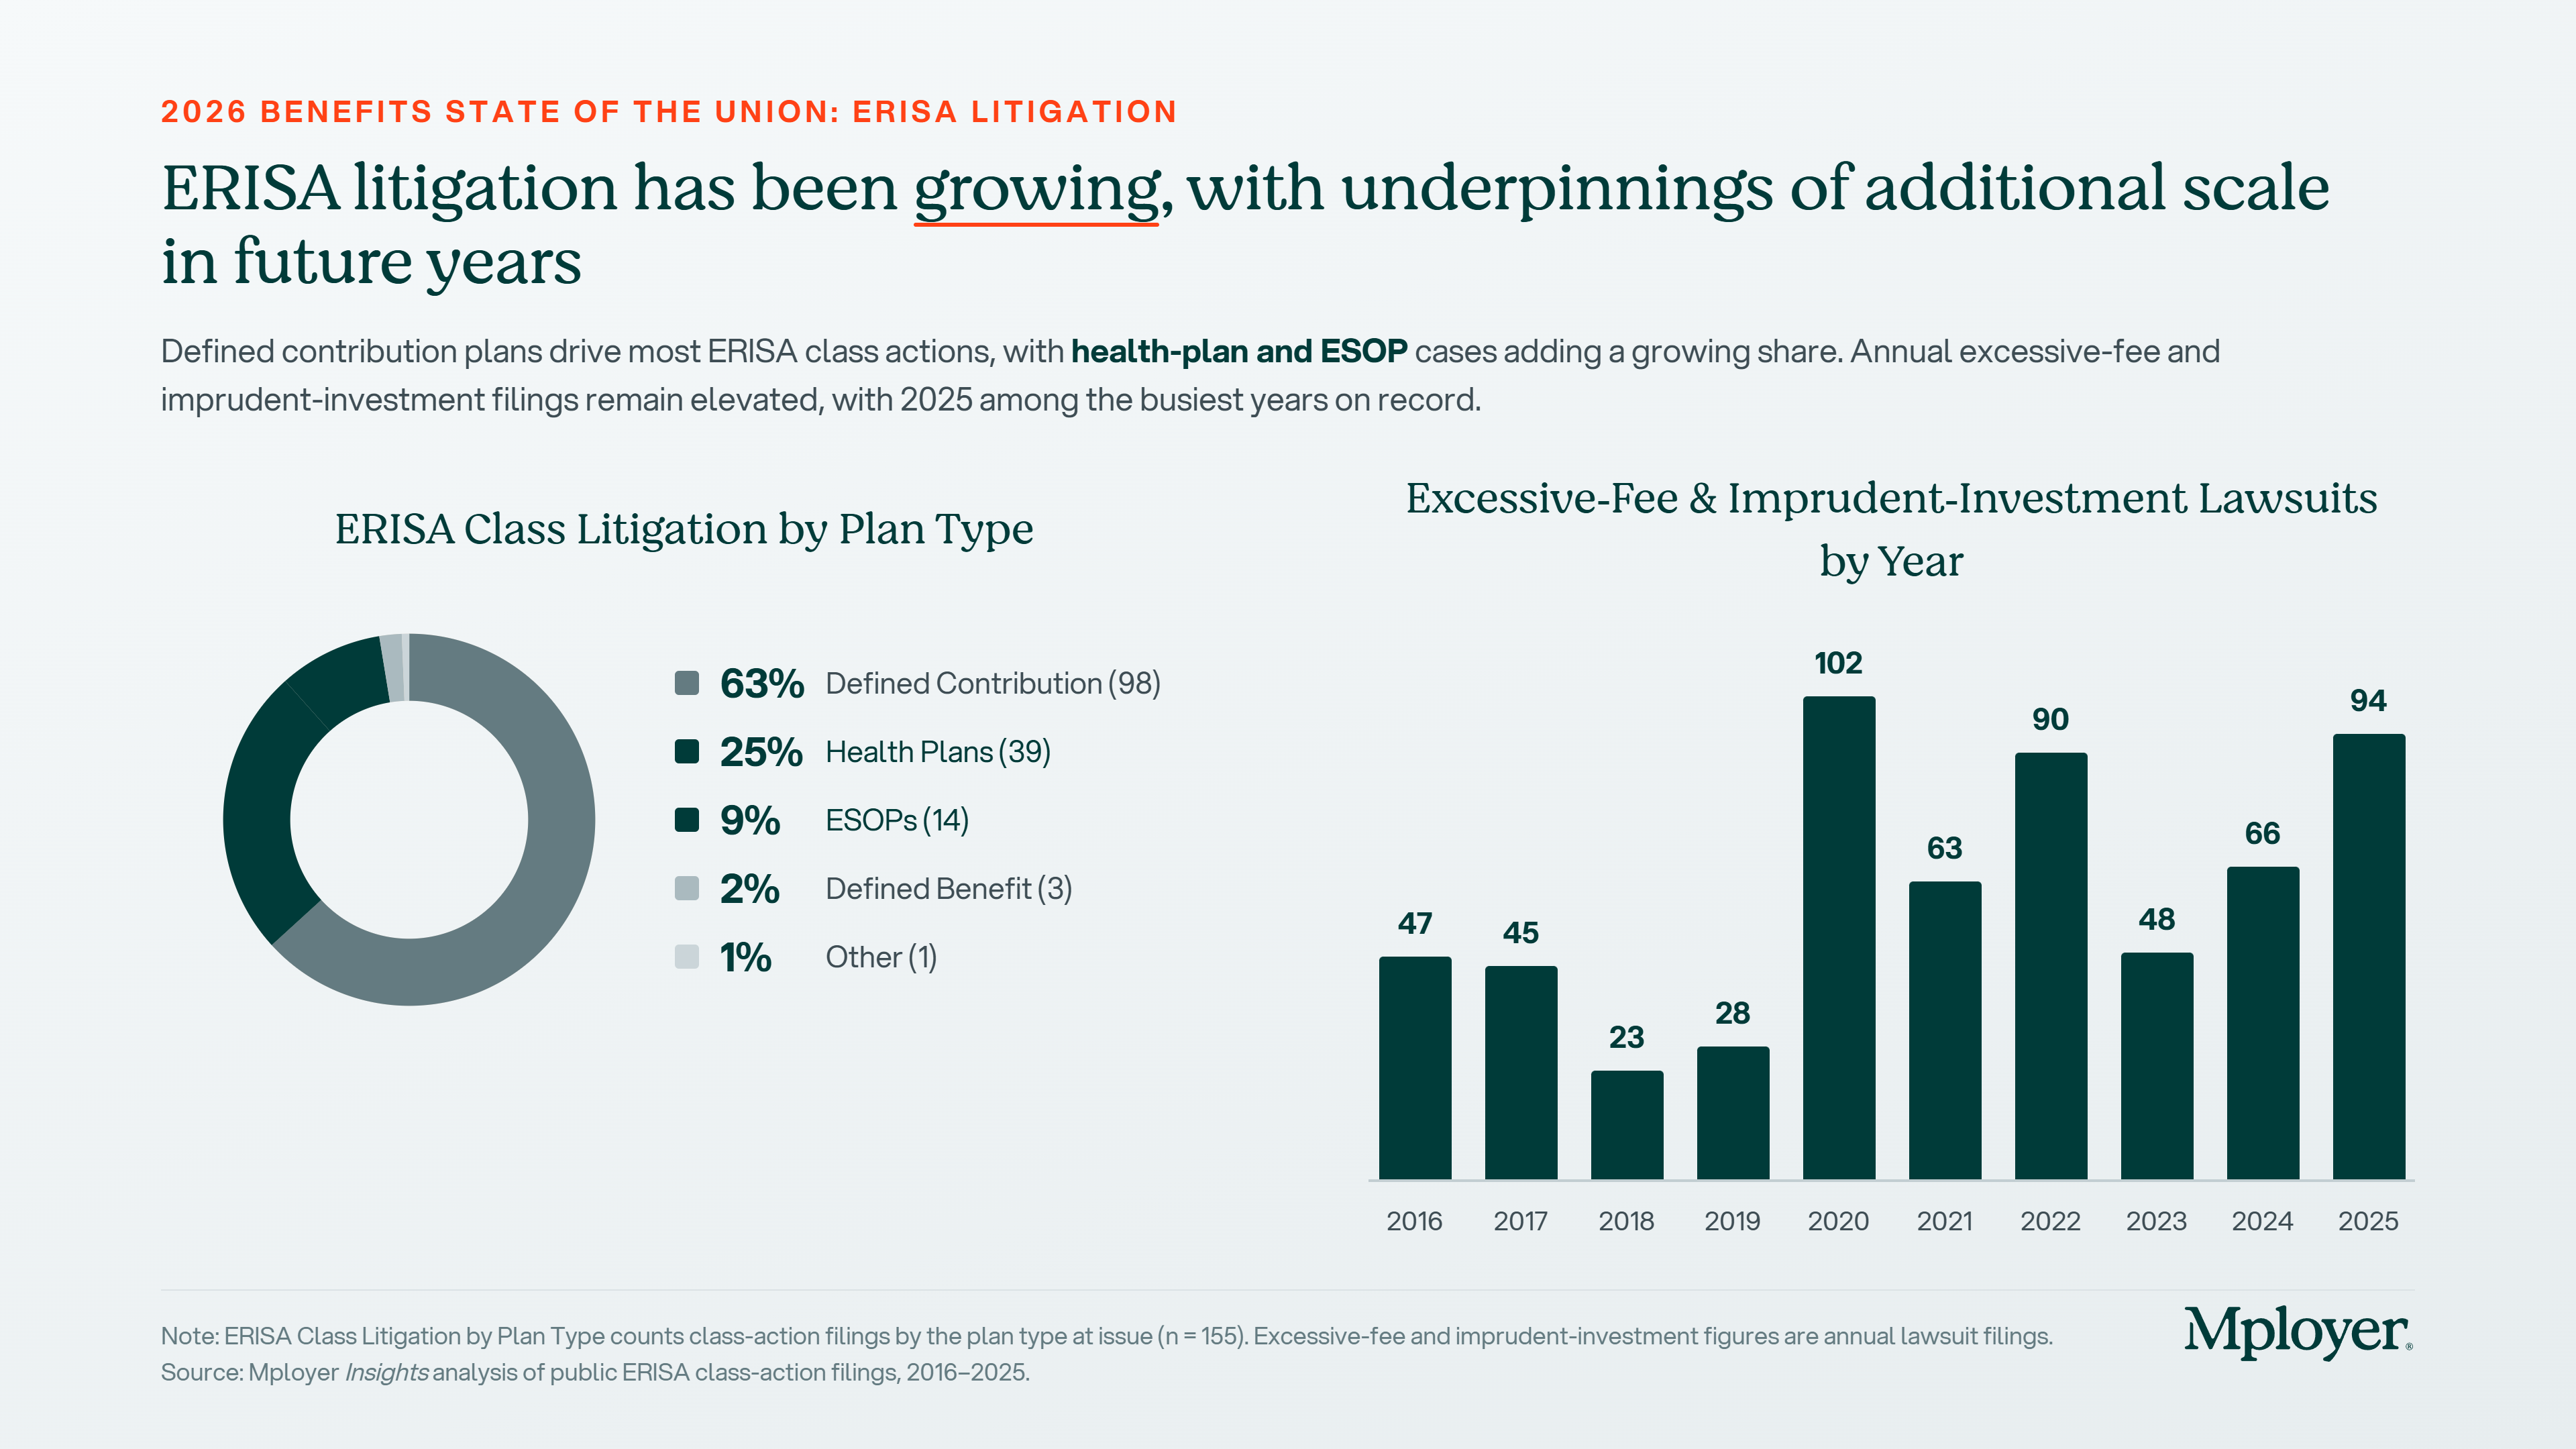
Defined contribution plans still drive the majority of ERISA class actions, representing 63% of the 155 cases filed in 2025, tracked by Encore Fiduciary in partnership with the Dorsey & Whitney law firm. But health plan cases are the fastest-growing category, accounting for 25% of all filings in 2025. That share reflects the direct impact of the CAA’s disclosure requirements and the growing sophistication of plaintiff firms in applying ERISA fiduciary standards to health plan administration. Annual excessive-fee and imprudent-investment filings remain elevated, with 2025 among the busiest years on record at 94 cases, and the trajectory since 2020 reflects a litigation environment that has become structurally elevated, not cyclical.
Who Bears Fiduciary Responsibility
ERISA fiduciary status is not limited to the HR department or the plan administrator on the plan document. Anyone who exercises discretionary authority over a benefit plan, controls plan assets, or provides investment advice for a fee can be a fiduciary under ERISA. In practice, that includes:
The standard that applies is the prudent expert standard under ERISA Section 404(a)(1)(B): decisions must reflect the care, skill, and diligence of a person familiar with such matters, acting in the sole interest of plan participants. Courts do not evaluate fiduciary duty by asking whether the outcome was good. They ask whether the process was sound. Process is the protection.
How This Litigation Actually Works
Most benefits decision makers are surprised to learn how these cases get started. Plaintiff law firms do not wait for disgruntled employees to call. They use publicly available Form 5500 annual filings, which ERISA plans must submit to the Department of Labor, to screen for plan characteristics that have historically generated successful claims. Once a target is identified, the firm recruits a plan participant to serve as the named plaintiff in a class action, frequently through outreach to current or former employees. That participant’s role is to provide legal standing, not to describe a personal grievance. The firm files the complaint, and the employer is now in litigation that can cost millions to defend regardless of the merits.
This explains a pattern that otherwise seems contradictory. Recordkeeping fees and investment fees for large 401(k) plans have declined steadily for more than a decade, yet fiduciary litigation has accelerated over that same period. Plaintiff firms have found that surviving the early stage of litigation generates settlement leverage, and their business model does not require the underlying fees to actually be excessive. In our internal data, over the past five years there have been more than 200 settlements of excessive fee and imprudent investment lawsuits totaling more than $1.3 billion. Plaintiff firms typically receive approximately one-third of those settlements. Individual plan participants, by contrast, have received an average of $55 to $70 each per settlement according to analysis from the Davis & Harman law firm.
Excessive Vendor Fees Drive the Surge
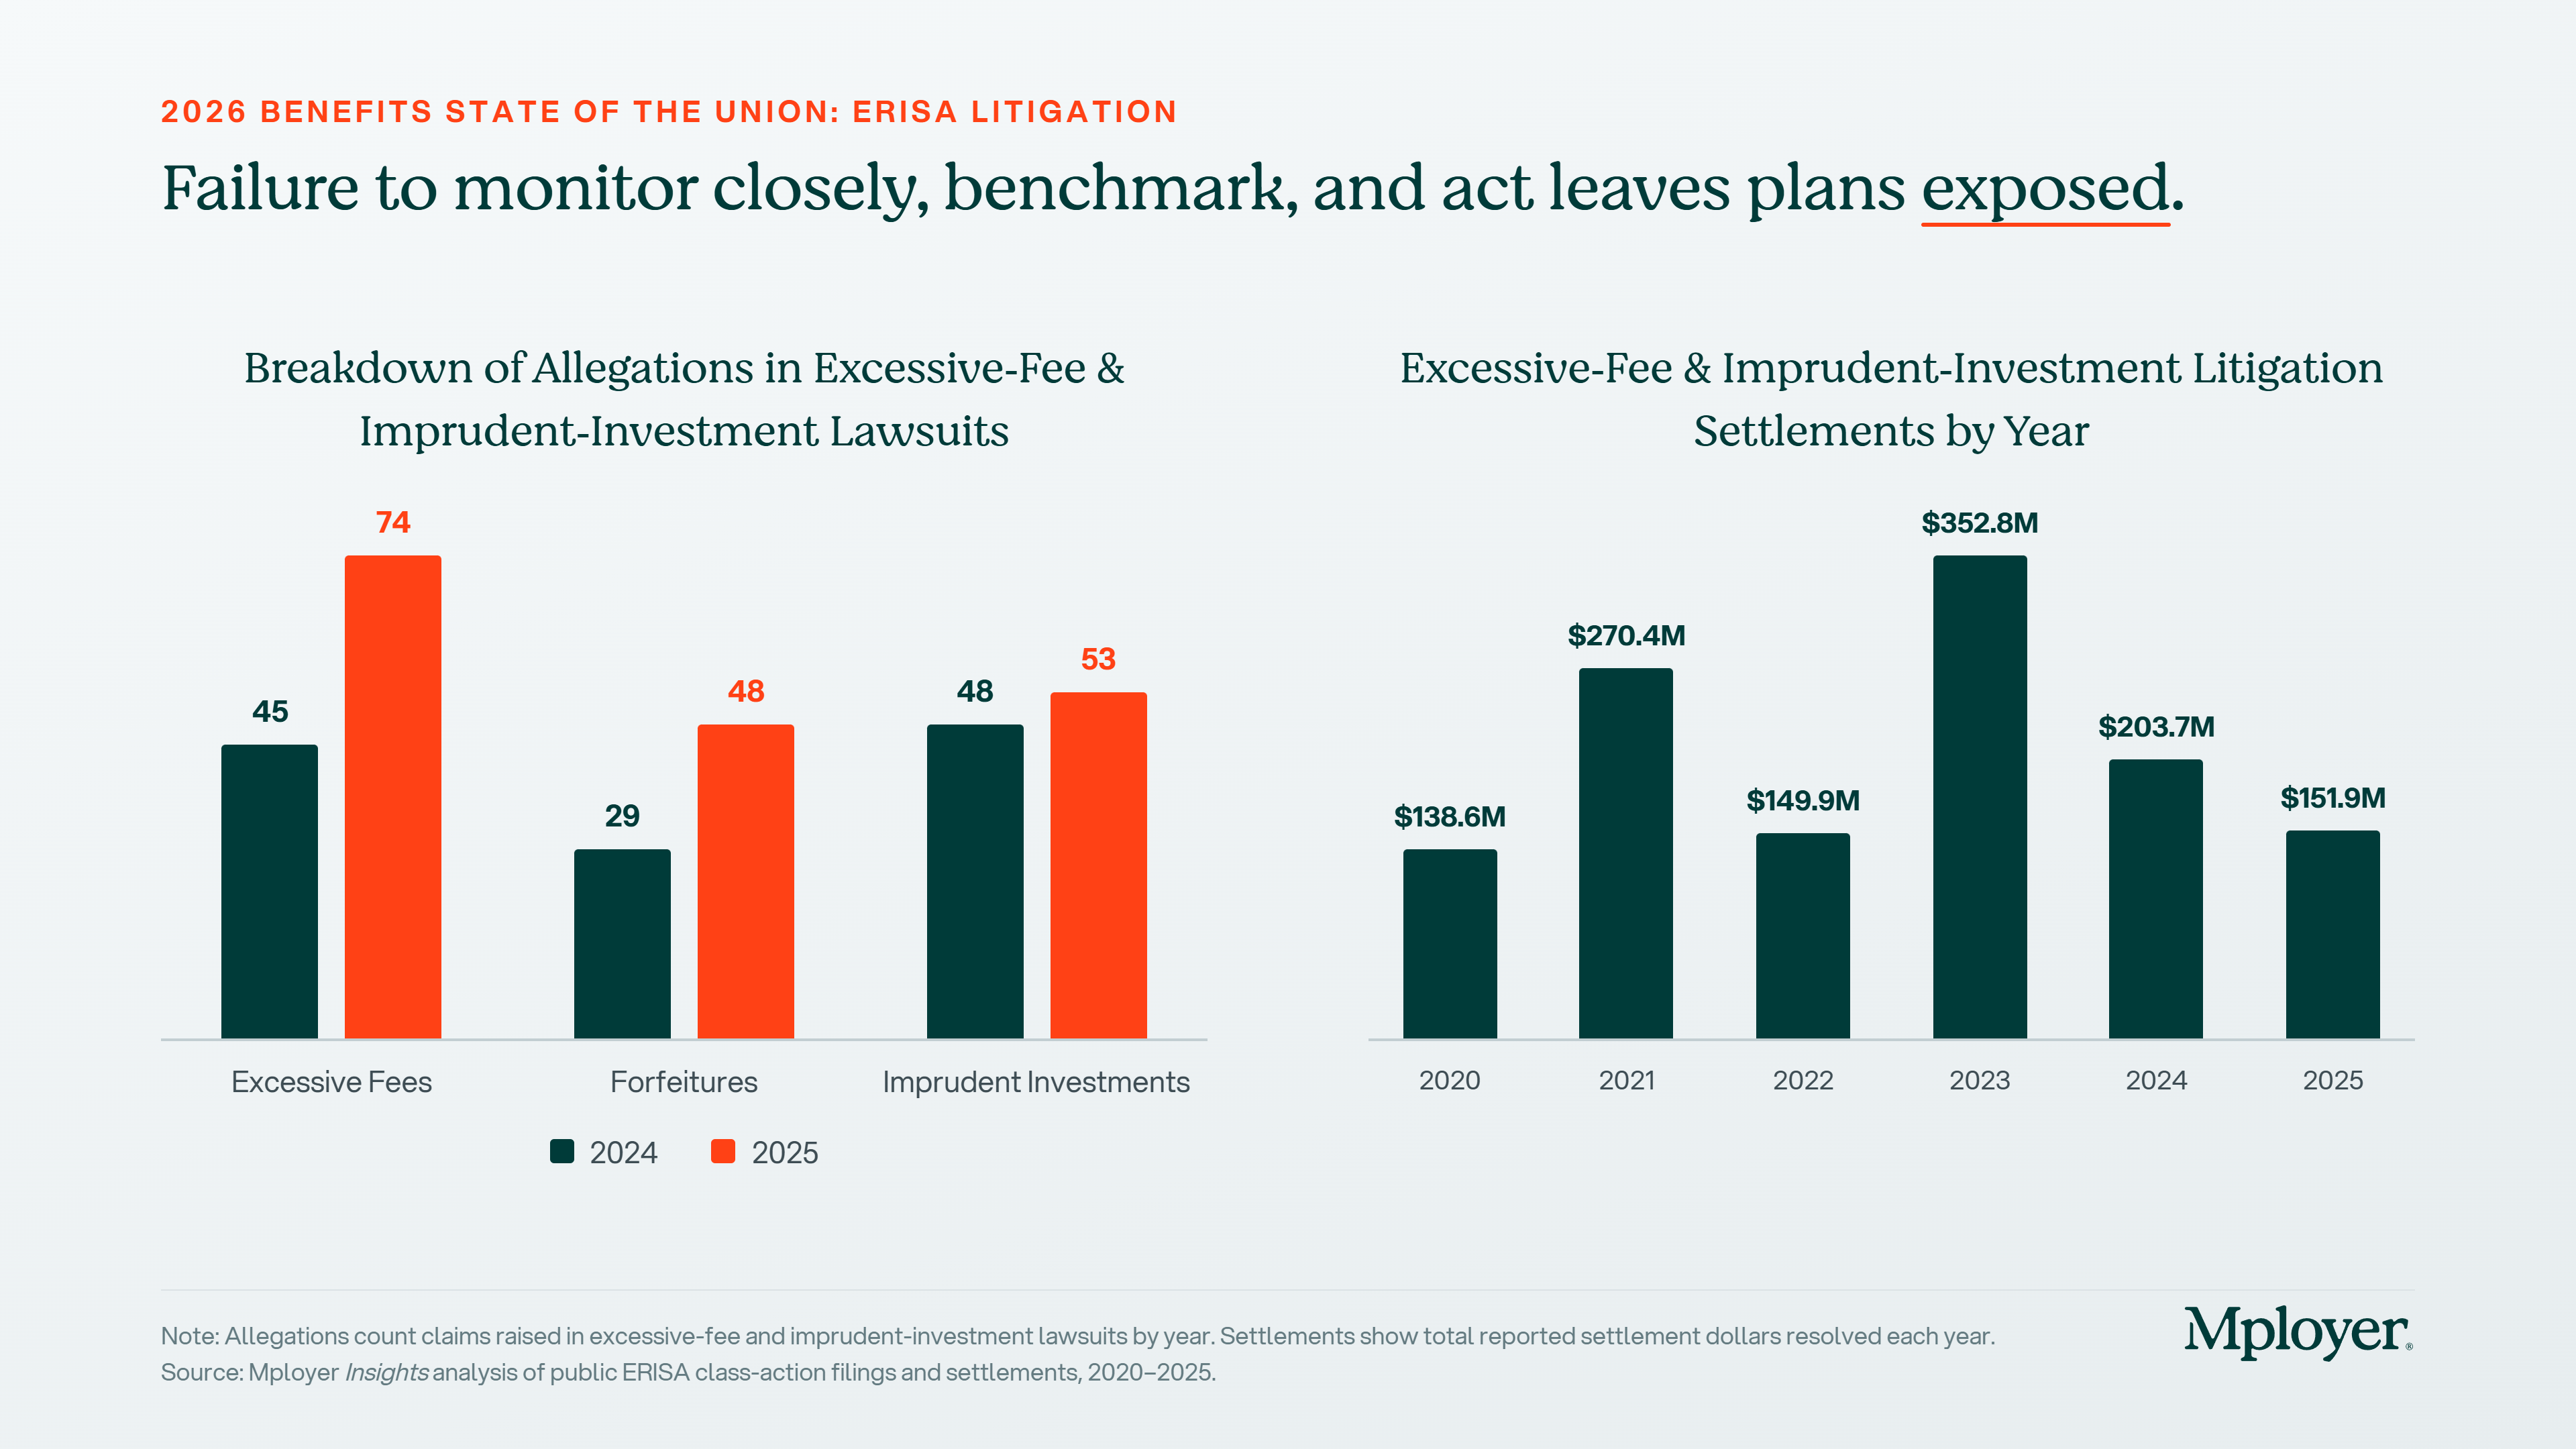
Excessive-fee allegations jumped 64% in a single year, from 45 cases in 2024 to 74 in 2025, outpacing every other claim category. Forfeiture allegations rose from 29 to 48. Imprudent investment claims grew from 48 to 53. Across all three categories, the trend is consistently upward. The right panel of the chart below shows what that volume translates to in settlement dollars: total reported settlements peaked at $352.8 million in 2023 and have remained elevated, with $151.9 million settled in 2025 alone. Watchful, deliberate fee benchmarking is the plan sponsor’s strongest defense against all three of these claim types, because each ultimately turns on whether the fiduciary made a documented, reasonable, and informed decision about what the plan was paying and to whom.
One category deserves particular attention for employers running wellness programs: tobacco surcharge claims. Plans that impose premium surcharges on tobacco users must offer a reasonable alternative standard that allows employees to earn or recoup the full reward, typically a tobacco cessation program. Nearly 50 tobacco surcharge lawsuits were filed in 2024 and 2025, with multiple settlements reaching close to $5 million each. Courts have ruled in favor of plaintiffs in the large majority of motions to dismiss decided so far. This is one of the highest-frequency, most correctable compliance risks in health plan design today.
The Main Legal Theories: A Brief Overview
In defined contribution plans, the dominant allegations are excessive recordkeeping or investment fees, imprudent investment selection, and forfeiture allocation disputes. Health plan litigation has grown significantly since the CAA’s fee disclosure requirements took effect, with the most active categories now being prescription drug cost claims, tobacco surcharge violations, ghost network failures, and, most recently, voluntary benefit broker compensation arrangements where undisclosed or unreasonable commissions are now being scrutinized directly under ERISA Section 406.
Cases That Illustrate Where the Exposure Lives
These cases show the range of conduct generating ERISA fiduciary liability claims across both retirement and health plans, and why the risk is expanding well beyond the traditional 401(k) space.
What Well-Prepared Employers Are Doing Differently
The employers best positioned in this litigation environment treat fiduciary process as an ongoing discipline. The specific practices courts and regulators look for are consistent across plan types.
How Mployer Insights+ Supports Your Fiduciary Process
One of the most direct steps a benefits decision maker can take to strengthen their fiduciary position is to run an independent, third-party benchmarking review of their plan on a regular basis. This is what Mployer Insights+ is built to produce.
Completing an Insights+ review generates documentation that speaks to three of the core ERISA fiduciary obligations. On the prudent expert standard under Section 404(a)(1)(B), the report demonstrates that an independent, structured benchmarking analysis was conducted across all plan components. On cost reasonableness under Section 404(a)(1)(A), the cohort comparison against employers matched by size, region, and industry creates a data-driven, documented basis for evaluating whether plan costs fall within a reasonable market range. On the duty to monitor under Section 404(a)(1), running the review annually establishes a consistent cadence of evaluation with a written output each cycle.
Because Mployer has no carrier relationship, broker relationship, or financial arrangement with the plan being evaluated, the report reflects an objective assessment free of commercial bias. That independence speaks directly to the implicit requirement in the prudent expert standard that fiduciary analysis be conducted free of conflicts of interest, and it distinguishes the Insights+ review from a benchmark produced by a broker from their own book of business.
None of this is a substitute for legal advice, and employers should work with qualified ERISA counsel to confirm all applicable obligations are identified and satisfied. But in a litigation environment where 155 fiduciary class action lawsuits were filed in a single year and the scope is actively expanding into health plans and voluntary benefits, a documented annual benchmark is one of the most practical and defensible steps a benefits team can take.
See how your benefits package compares to your custom cohort at MployerAdvisor.com.
Sources
Encore Fiduciary / Dorsey & Whitney LLP: ERISA Fiduciary Litigation in 2025. 155 class lawsuits filed in 2025. Justin Bove, Chief Revenue Officer, Encore Fiduciary.
Mployer Insights analysis of public ERISA class-action filings and settlements, 2016-2025.
Davis & Harman LLP: 2025 Underperformance and Excessive Fee Settlement Survey. Average individual participant recovery $55-$70.
Consolidated Appropriations Act of 2021 (CAA), Section 202, broker/consultant compensation disclosure requirements for group health plans.
Kraft Heinz Co. Employee Benefits Administration Bd. v. Aetna Life Ins. Co., No. 2:23-cv-00317 (E.D. Tex., filed June 30, 2023).
Lewandowski v. Johnson & Johnson, No. 3:24-cv-00671 (D.N.J., filed February 5, 2024).
Navarro v. Wells Fargo & Co., No. 0:24-cv-3043 (D. Minn., filed July 30, 2024).
Hecht v. Cigna, filed 2024; fiduciary duty claim survived motion to dismiss February 2025; settled approximately $6 million October 2025.
Singh v. Capital One Financial Corporation, PACER Docket 1:24-cv-08538; settled approximately $10 million 2025.
Cunningham v. Cornell University, 604 U.S. 693 (2025).
Hughes v. Northwestern University, 595 U.S. ___ (2022).
ERISA Section 404, 29 U.S.C. Section 1104. DOL Voluntary Plan Safe Harbor, 29 C.F.R. Section 2510.3-1(j).
HIPAA Nondiscrimination Rules for Wellness Programs, 26 C.F.R. Section 54.9802-1.
A Quiet Docket, a Loud Signal for Benefits Leaders
The Supreme Court closed its October 2025 Term on June 30, 2026, and for once the biggest story for employee benefits is what the justices didn’t take up. After several years of consequential ERISA rulings, this term was unusually light on benefits cases. ERISA was the only major regulatory area the Court touched at all this cycle.
For CHROs and CFOs, that quiet is deceptive. The decided cases were narrow, but the case the Court agreed to hear for next term, combined with a fast-moving wave of litigation in the lower courts, means the exposure landscape is shifting under your feet even in a slow year. Here is what actually happened, and what belongs on your calendar.
A quick scheduling note. The Court runs on a fixed rhythm, opening the first Monday in October and running through late June. This term began October 6, 2025 and wrapped June 30, 2026. The next term, October Term 2026, begins October 5, 2026. That is when the case worth watching most closely will be argued.
The One Decided Case: M&K Employee Solutions
The term’s marquee ERISA decision was M&K Employee Solutions, LLC v. Trustees of the IAM National Pension Fund, decided unanimously on May 21, 2026, in an opinion by Justice Jackson.
The case concerned multiemployer pension plan withdrawal liability, the “exit tax” an employer owes when it stops contributing to an underfunded union pension plan. The narrow legal question: must the plan’s actuary lock in the actuarial assumptions, most importantly the interest and discount rate, as of the measurement date, or can those assumptions be set later? The Court held that assumptions do not have to be fixed on the measurement date. The measurement date fixes the facts about the plan, its assets, its participant data, but the actuary may select assumptions afterward, so long as they rest on information available as of that date.
Why It Matters, and to Whom
If your organization participates in a multiemployer plan, this decision removes a timing-based defense to a withdrawal liability assessment. The stakes are not theoretical. In the underlying dispute, a single change in the discount rate swung the fund’s unfunded liability from roughly $500 million to $3 billion. Employers can still challenge an assumption as unreasonable on the merits, but they can no longer argue it is invalid simply because it was adopted after the measurement date.
For CFOs with any multiemployer exposure, the practical takeaway is straightforward: keep current withdrawal-liability estimates in hand and treat assumption volatility as a live balance-sheet risk, not a historical footnote.
For the majority of employers, those sponsoring 401(k) or other single-employer defined contribution plans, M&K is informative but not directly actionable. Which is exactly why the next case deserves your attention.
The Case to Watch: Anderson v. Intel
In January 2026, the Court granted review in Anderson v. Intel Corp. Investment Policy Committee. This is the decision benefits leaders should be tracking closely. It has not yet been argued. It sits on the October 2026 calendar, with a ruling expected sometime in 2027.
The question is deceptively technical but enormously consequential: when a 401(k) participant sues plan fiduciaries for imprudently selecting or retaining an underperforming investment, must the complaint identify a “meaningful benchmark,” an appropriate comparator investment, to survive a motion to dismiss?
That pleading standard is the gate through which nearly every fiduciary-breach class action must pass. Set it high, and many suits end early, before discovery costs accumulate. Set it low, and far more cases proceed into expensive, prolonged litigation. However the Court rules, it will reset the cost-benefit calculus of fiduciary litigation for every plan sponsor in the country.
The action item here is concrete: put Anderson v. Intel on your 2027 watch list now, and revisit your investment-monitoring documentation in anticipation. Whatever standard the Court ultimately adopts, employers with a thin or informal fiduciary process will be the most exposed.
The Real Action Is Below the Supreme Court
If you read only the SCOTUS headlines, you would miss the trend most relevant to your benefits program today. Two lines of litigation are accelerating in the lower courts, and both are worth understanding now, well before either reaches the Supreme Court, if either ever does.
Voluntary and Ancillary Benefits Litigation
Building on the Court’s 2025 decision in Cunningham v. Cornell, last term’s ruling that lowered the bar for pleading an ERISA prohibited-transaction claim, plaintiffs’ firms have begun filing class actions over voluntary benefit programs such as accident, critical illness, and hospital indemnity coverage.
The theory: that employers failed to ensure premiums were reasonable, and that the brokers and consultants who placed those products acted as plan fiduciaries and engaged in self-dealing through undisclosed commissions. Notably, these suits name not just employers but their advisors directly.
The first line of defense is the Department of Labor’s voluntary-plan safe harbor. If your voluntary offerings do not satisfy all four of its requirements, ERISA fiduciary duties may attach to programs you never treated as fiduciary plans. That means the governance, documentation, and disclosure standards you apply to your 401(k) may now be relevant to your accident and critical illness offerings as well.
Forfeiture Litigation
A growing set of cases is challenging whether plan sponsors may use forfeited employer contributions, the unvested employer match dollars left behind when an employee departs before vesting, to offset future company contributions, rather than using those dollars to defray plan administrative expenses.
The Supreme Court has not taken these cases up, but the circuits are actively sorting through conflicting outcomes, and the resolution will shape a routine plan-design choice that most sponsors make without a second thought. If your plan document allows forfeitures to offset future employer contributions, a common and previously uncontroversial provision, it is worth understanding where the circuit split currently stands and how exposed your specific plan language is.
On the Health Side: A Notable Non-Decision
In January 2026, the Court declined to wade in. It denied review in Guardian Flight v. Health Care Service Corp., leaving intact a lower court ruling that there is no private right of action to enforce arbitration awards under the No Surprises Act’s dispute-resolution process. It’s a quiet development, but a meaningful data point for any employer managing surprise-billing and network-adequacy issues. The enforcement mechanism for No Surprises Act arbitration outcomes remains narrower than some plan sponsors may have assumed.
What to Do Before October
A light term is a planning window, not a reprieve. Three concrete moves worth making before the Court reconvenes:
The Justices Return October 5. The Quiet Won’t Last.
This term’s light docket should not be mistaken for reduced risk. The lower courts are actively developing theories around voluntary benefits, forfeitures, and fiduciary process that will shape benefits litigation for years regardless of whether the Supreme Court ever weighs in directly. And the one case already on next term’s calendar, Anderson v. Intel, has the potential to reset how every fiduciary-breach claim in the country gets pleaded and litigated.
Benefits compliance is not a once-a-year exercise triggered by a Supreme Court ruling. It is an ongoing discipline of documentation, benchmarking, and process, and the employers best positioned heading into next term are the ones treating it that way now.
Mployer’s benefits rating evaluates plan design and employer investment across Medical, Ancillary, Leave, and Retirement, giving CHROs and CFOs a documented, benchmarked view of how their plans compare to a custom cohort. That is precisely the kind of process discipline courts are increasingly looking for.
This is also where Mployer Insights+ does double duty. Running an Insights+ review produces the kind of independent, third-party documentation that speaks directly to ERISA’s prudent expert standard under Section 404(a)(1)(B). The report benchmarks your plan against a custom cohort matched by size, region, and industry, which gives you a data-driven basis for evaluating whether your costs and plan design fall within a reasonable market range under the cost reasonableness standard in Section 404(a)(1)(A).
It also addresses the duty to monitor under Section 404(a)(1), which is an ongoing obligation, not a one-time exercise at plan inception. An annual Insights+ re-rating establishes exactly the kind of recurring, documented review cadence that obligation calls for, with a written output each cycle that shows the analysis was conducted. Because the report is produced by an independent third party with no carrier or broker relationship to the plan being evaluated, it also speaks to the independence of assessment that the prudent expert standard implies.
None of this is a substitute for legal advice, and plan sponsors should work with qualified ERISA counsel to confirm all applicable obligations are identified and satisfied. But for CHROs and CFOs looking to strengthen their fiduciary process ahead of a term where the lower courts are actively raising the bar on documentation, an annual Insights+ review is a concrete, repeatable way to build that record.
See how your benefits package compares to your custom cohort at MployerAdvisor.com.
Sources
M&K Employee Solutions, LLC v. Trustees of the IAM National Pension Fund, decided May 21, 2026 (unanimous, opinion by Justice Jackson).
Anderson v. Intel Corp. Investment Policy Committee, certiorari granted January 2026; argument calendared for October Term 2026.
Cunningham v. Cornell University, decided 2025 (prior term).
Guardian Flight v. Health Care Service Corp., certiorari denied January 2026.
American Bar Association, October 2025 Term preview.

July brings major updates across Insights+, Catalyst, and Vista, focused on helping our partners work faster with more automation, deeper intelligence, and expanded AI capabilities, from instant benchmarking reports and smarter prospecting to more flexible reporting. Explore the updates below.
Insights+
Catalyst
Vista

.svg)


.svg)
.svg)
.svg)