By Mployer Team
February 10, 2021
Updated
August 14, 2023
6
min read

An insurance broker can save you a lot of time but can they save money for your business, compared to going directly to insurers?

The short answer is yes. Insurance brokers get better rates by leveraging industry expertise and insurer relationships to find the right policy with proper coverage at appropriate costs.

With access to multiple insurance carriers and policy packages, independent brokers can find value in the insurance market based on your company’s specific needs.

In this post, we explain how insurance brokers get better rates and how they can make your job easier.

How insurance brokers get better rates for your business

A good broker addresses your specific insurance and benefits needs at optimal costs by connecting you with the best insurance for each of your identified risks. This way, they are often able to get better rates on insurance policies for clients than individuals buying insurance directly from the company.

At a basic level, an insurance broker will compare the coverage of various insurers to get you rates specific to your needs. And they will save you time on administration and claims by managing your policy. But there are more ways that a broker can get better rates for your business:

Finding policies.

  • An independent broker is not obligated to sell insurance policies from any specific carrier. So, they can compare coverage packages from various insurers to get you the best rates available. Brokers will assess your business’s specific insurance needs to match you with policies from carriers best equipped to meet your needs at the right price.
  • After all, there are so many carriers, types of insurance, and complex policies for even a small, at home business to consider. The best mix of insurance may involve products from different companies. A broker will conduct that search for you, and can also combine different types of insurance and different carriers to reduce your premiums.

Making insurance decisions.

  • One of a broker’s main responsibilities is to work with clients to understand their needs before matching them with policies. With a broker or brokerage firm guiding you through insurance options, you can know exactly how much protection you need and what rates are available.
  • Having a broker to answer your questions is an easy way to make informed, fast decisions on insurance and benefits. They provide you with unbiased, cost effective policy recommendations tailored to your business. Then you can confidently buy coverage that gives you the best solution.
  • Not only does this expertise make an easy job of insurance procurement, it also helps you avoid unnecessary extra costs and coverage you do not need.

Negotiating with insurance carriers.

  • With “broker” in the title, you would be correct to assume insurance brokers also negotiate with carriers to get you the lowest prices on coverage. Acting on your behalf, they can leverage partnerships with insurers to negotiate better premiums or specific discounts.
  • Brokers’ licensing and expertise in risk assessment presents a lower risk to insurance companies, so they often discount the premiums for these representatives. In this way, a broker can access policies and rates that may not be available for those going directly to the carrier.
  • Brokers searching for better coverage and rates ongoing can also save you time and expenses long term. Your brokerage could help build loss-prevention programs and review your policy every year, remarketing your premium to get your business the best priced renewals.

Is it easy to work with an insurance broker?

Good Independent insurance brokers make it easy to understand your coverage needs and pick a carrier based on coverage types, deductibles, covered risks and prices that work best for your business.

For many reasons, it is easier to work with an insurance broker than finding and purchasing policies on your own.

After all, you are not paid to be an insurance expert, and sifting through dozens of policy plans can be stressful, at best. Brokers add value by assessing your needs based on all your operations and risks, and then finding insurance plans that fit your profile.

They guide you through the buying process with professional advice, listening carefully to your needs and asking questions that lead to intelligent choices. Importantly, a good broker also helps you by breaking down insurance options into terms and conditions you can understand.

From claims management to employee benefits education, a full-service broker will provide the knowledge and detail that lets you focus on running your business.

Smart businesses have good insurance and benefits. The best way to find good insurance and benefits is through a broker, consultant, or advisor who knows what you need and provides you with significant value. But, how do you know who to hire? With seemingly endless options, you feel under pressure to choose the right one. We believe that transparency, information, and choice leads to better hiring decisions.

Connect me with a broker

It's why we created Mployer Advisor, a free broker marketplace that allows employers to compare brokers, consultants, and advisors in one place.

To get started, find brokers near you to get matched with a short-list of qualified brokers.Looking for more exclusive content? Check out what’s trending on the Mployer Advisor blog, or check out some more insurance broker content.


Next Up

2026 Benefits State of the Union: Disability Insurance

August 21, 2026

2026 Benefits State of the Union: Disability Insurance

The Benefit That Protects the Paycheck

Disability insurance does not get the attention of health insurance or retirement savings. It rarely comes up in candidate conversations, and most employees give it little thought until they need it. But consider the actual risk it addresses: the Social Security Administration estimates that one in four workers entering the workforce today will experience a disabling condition lasting 90 days or more before they reach retirement age. That is not a rare event. It is a common financial risk that most people are not adequately prepared for on their own.

As an employer, disability insurance is one of the most direct ways you can protect your employees’ financial security when something goes wrong. It replaces a portion of their income when illness or injury prevents them from working, which keeps employees from facing simultaneous health and financial crises at the most difficult moments of their lives. The fact that only 41% of employers offer short-term disability and 38% offer long-term disability nationally means that offering both represents a genuine differentiator in the market, not just table stakes.

This post covers how disability insurance works, how to structure it, what the national data shows about offer rates and benefit levels, and what employers should be asking at their next renewal.

What Disability Insurance Actually Is: Key Terms

  • Short-term disability (STD). Insurance that replaces a portion of an employee’s income when they are temporarily unable to work due to illness or injury, including childbirth recovery. STD typically covers periods of weeks to a few months. It is the first layer of income protection and, for many employees, the foundation of maternity leave. Offered by 41% of employers nationally.
  • Long-term disability (LTD). Insurance that provides income replacement for extended disability lasting beyond the short-term period, often months or years. LTD is designed to take over when STD benefits end. Offered by 38% of employers nationally. Because LTD covers the more catastrophic scenarios, the benefit period can extend to age 65 or even lifetime in some plans.
  • Elimination period (waiting period). The number of days an employee must be disabled before benefits begin. For STD, 60% of plans use a 7-day elimination period; 23% use 14 days. For LTD, 68% use a 90-day elimination period; 23% use 180 days. The elimination period is the gap the employee must bridge with sick leave, PTO, or personal savings before disability income kicks in. Understanding how your STD and LTD elimination periods align is critical, and is covered in detail below.
  • Income replacement percentage. The share of the employee’s pre-disability earnings that the benefit replaces. 60% of earnings is the most common rate nationally for both STD and LTD. This means an employee earning $80,000 per year receives approximately $48,000 annually in disability benefits, not their full salary.
  • Maximum benefit cap. The maximum weekly (STD) or monthly (LTD) dollar amount the plan will pay, regardless of salary. This cap disproportionately affects higher-earning employees. At the 50th percentile, the STD maximum weekly benefit is $1,602 (annualizing to approximately $83,000) and the LTD maximum monthly benefit is $8,273 (approximately $99,000 annually). For employees earning above these levels, the cap creates a coverage gap.
  • Own-occupation vs. any-occupation definition. How the plan defines disability matters enormously at claim time. An own-occupation definition pays benefits if the employee cannot perform the duties of their specific job. An any-occupation definition pays only if the employee cannot work in any job for which they are reasonably qualified. Own-occupation definitions are more employee-favorable; any-occupation definitions are more restrictive and more common in group LTD plans.
  • Coordination with state programs. Several states operate mandatory short-term disability programs: California (SDI), New Jersey (TDI), New York (DBL), Hawaii (TDI), and Rhode Island (TCI). Employers in these states must navigate the interaction between the state-mandated benefit and any employer-sponsored STD plan. Some employers use the state program as the foundation and top up to a higher replacement level; others offer a separate employer plan that coordinates with state benefits.

Who Is Offering Disability Coverage and Why It Varies

Nationally, 41% of employers offer STD and 38% offer LTD. The majority do not offer either. That gap is concentrated among smaller employers, where the cost and administrative complexity of disability plans is less easily absorbed, and among industries where the workforce skews hourly or part-time and where disability programs have historically been less common.

Industries with higher physical demands, particularly manufacturing, construction, and transportation, tend to have stronger disability offer rates because the risk of workplace-related injury or illness is more visible and the case for income protection is easier to make. Knowledge-worker industries have historically underinvested in disability relative to the actual statistical risk, partly because the risk is less immediately visible when employees are not working in physically hazardous environments.

For employers who do not currently offer disability insurance, the business case is straightforward: an employee who becomes disabled and has no income protection may be forced to leave the workforce entirely or exhaust all personal savings before returning. Disability coverage keeps employees financially stable during recovery, which increases the likelihood of return-to-work and reduces the employer’s replacement and retraining costs. It is both a benefit for employees and a business continuity tool for the employer.

Short-Term Disability: Structure, Replacement Rates, and the STD Benefit Period

Among employers offering STD, 77% use a fixed percentage of earnings as the benefit structure, meaning all covered employees receive the same income replacement rate regardless of their salary. 22% use a variable percentage, where the replacement rate differs by employee group or salary band.

43% of plans replace exactly 60% of earnings, the long-standing market standard. 24% replace 50%, and 18% replace more than 69% of earnings. The remainder cluster in various intermediate rates. A 60% replacement rate means an employee on STD receives roughly three-fifths of their normal paycheck, which for many employees is adequate for a short-term period but creates real financial pressure if the disability extends for weeks or months.

The STD benefit period is how long the benefit continues to pay. The median benefit period at the 50th percentile and above is 26 weeks, meaning the plan pays for up to 26 weeks of disability. At the 25th percentile it drops to 17 weeks and at the 10th percentile to 13 weeks. The length of the STD benefit period matters particularly for cases involving serious illness, injury recovery, or maternity leave, where employees may need more than a few weeks before they can return to work.

For birth parents, STD is the financial foundation of maternity leave. The disability period covers the recovery from childbirth, typically six weeks for vaginal delivery and eight weeks for cesarean. Whether and how the employer structures additional paid leave on top of that STD period is a separate decision, covered in our Leave Benefits series.

Long-Term Disability: Structure and the Handoff from STD

LTD differs from STD in an important structural way: 55% of LTD plans use a variable percentage of earnings, compared to 77% of STD plans using a fixed rate. This reflects the longer duration of LTD benefits and the greater complexity of long-term disability claims, where factors like Social Security offset, return-to-work provisions, and benefit period length interact with the income replacement rate.

63% of LTD plans replace exactly 60% of earnings when a fixed rate is specified, which is the same dominant standard as STD. The consistency of 60% as the market standard across both short and long-term disability reflects decades of actuarial convention: 60% is enough to sustain basic living expenses for most employees without creating a financial incentive to remain on disability rather than return to work.

The most important design question in LTD is how and when it coordinates with STD. The handoff depends entirely on elimination periods aligning correctly.

How the STD-to-LTD Handoff Works: Elimination Periods

The elimination period is the number of days an employee must be disabled before benefits begin. Getting this right is one of the most important design decisions in disability plan structure, because a gap between the end of STD and the start of LTD leaves employees without income during an already difficult period.

For STD, 60% of plans use a 7-day elimination period. This means an employee who becomes disabled on Monday begins accumulating toward their benefit on Tuesday, with the first check typically arriving at the end of the first covered week. 23% of plans use a 14-day elimination period. The most common structure is for employees to bridge the elimination period with accrued sick leave or PTO, which is why the interaction between the STD elimination period and the employer’s sick leave bank matters.

For LTD, 68% of plans use a 90-day elimination period, and 23% use 180 days. The 90-day LTD elimination period is designed to align with the end of a standard STD benefit period: if STD pays for up to 26 weeks (approximately 182 days), an LTD plan with a 90-day elimination period will begin before STD ends, creating a clean handoff with no income gap. Where the misalignment typically occurs is when an employer offers LTD without STD, or when the STD benefit period is shorter than the LTD elimination period. In that scenario, an employee who remains disabled after STD ends faces a gap of days, weeks, or months with no income before LTD begins. Employers should map their own STD benefit period against their LTD elimination period explicitly to confirm there is no gap.

Maximum Benefit Caps: What They Mean for Your Workforce

The maximum benefit cap is where disability plans most visibly fail higher-earning employees. The cap sets an absolute ceiling on the weekly or monthly benefit payment, regardless of what the percentage replacement would otherwise produce.

At the median (50th percentile), the STD maximum weekly benefit is $1,602. Annualized, that is approximately $83,000 of covered income. An employee earning $120,000 per year with a 60% replacement rate would normally expect $72,000 annually in STD benefits. At the median cap of $1,602 per week, they receive $83,304 annualized, so the cap does not bind for that employee. But an employee earning $200,000 per year who expects $120,000 in annual benefits hits the median cap at $83,304, receiving only about 42% of their salary rather than the stated 60%.

The LTD median monthly cap of $8,273 annualizes to approximately $99,000. For employees earning above $165,000 per year, the standard 60% replacement rate begins to be limited by this cap. At the 90th percentile, the LTD cap reaches $16,067 per month ($192,804 annualized), which provides meaningful coverage for higher-income employees. The range from 10th to 90th percentile ($4,073 to $16,067 monthly) reflects the wide variation in how generously employers set maximum benefit limits.

For employers with meaningful high-earning populations, the maximum benefit cap deserves deliberate attention. An executive or senior professional who becomes disabled and discovers their LTD benefit is capped at a level far below their salary has a financial gap that employer-sponsored disability, as structured, does not fill. Executive disability policies and supplemental individual disability insurance are the tools for addressing this, and brokers who work with professional services or technology firms routinely review this gap as part of a benefits assessment.

The Carrier Market

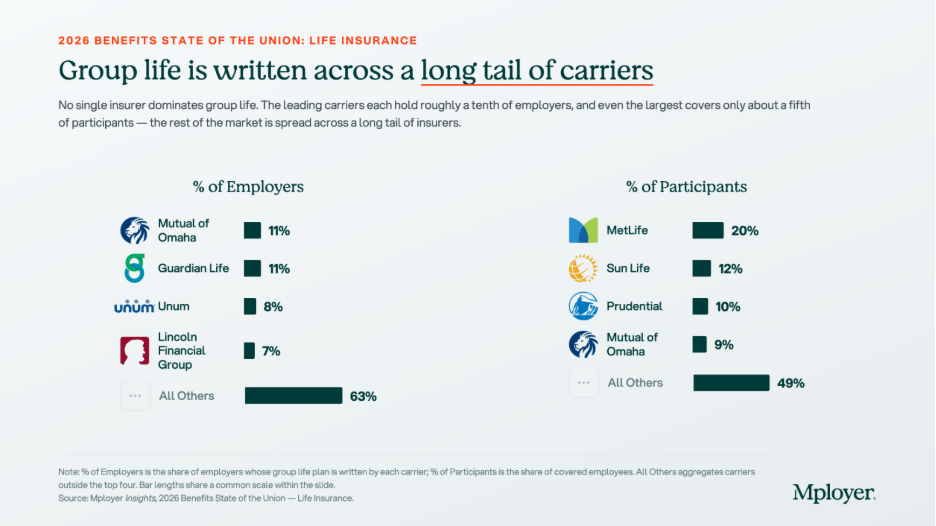
Like group life insurance, the disability carrier market is fragmented with no single dominant player. Mutual of Omaha leads by employer count at 12%, followed closely by Guardian Life at 11%. The participant view shifts noticeably: MetLife and Sun Life each cover 14% of participants, reflecting their strength at large-employer accounts with high headcounts. The Hartford, absent from the top-four employer-count list, appears at 10% of participants for the same reason.

The carriers that dominate disability by employer count, Mutual of Omaha, Guardian Life, and Unum, have strong expertise in the small to mid-market segment and offer integrated STD/LTD packages that are easy to implement alongside life insurance from the same carrier. Employers already working with one of these carriers for life insurance often find that bundling disability simplifies administration and can generate favorable pricing.

As with life insurance, the fragmentation of this market is an opportunity. There is no carrier with enough market concentration to hold pricing power unilaterally, and disability is one of the easier benefits lines to put to competitive bid. Employers who have not reviewed their disability carriers and pricing in three or more years should do so, particularly if their workforce demographics have shifted or if they have grown into a size band where different carrier economics apply.

Questions Every Employer Should Be Able to Answer About Their Disability Coverage

  • Do we offer both STD and LTD, or just one? STD alone leaves employees exposed to extended disability. LTD alone leaves employees with a significant income gap before long-term benefits begin. The programs are designed to work together. If you offer only one, understand what the gap means for your employees.
  • Does our STD benefit period align with our LTD elimination period? Map these two numbers explicitly. If your STD pays for 13 weeks and your LTD has a 90-day elimination period, employees who remain disabled after 13 weeks face a gap. If STD pays for 26 weeks and LTD begins at 90 days, the handoff is clean.
  • What income replacement rate do we offer, and is it adequate? 60% is the market standard and is generally sufficient for short-term periods. Consider whether 60% is enough for your specific workforce demographics and compensation levels, and whether any employee groups face hardship at that replacement rate.
  • Are our maximum benefit caps appropriate for our compensation structure? Pull the actual annual salary distribution of your workforce and compare it to your STD and LTD benefit caps. Identify the salary level at which the cap begins limiting coverage and evaluate whether that is acceptable given your workforce composition.
  • Do we operate in a state with mandatory disability programs, and have we optimized the coordination? Employers in California, New Jersey, New York, Hawaii, and Rhode Island operate within state-mandated disability frameworks. The interaction between the state program and any employer-sponsored coverage should be reviewed explicitly to avoid duplication and to maximize the total benefit employees receive.
  • When did we last go to market on disability? Disability pricing is experience-rated over time and should be reviewed periodically, particularly as workforce size, demographics, and claims history change. If you have not compared carrier pricing and terms in three or more years, a market review is overdue.

Know Where Your Disability Coverage Stands

Disability insurance is the benefit employees rarely think about until they need it, at which point nothing else matters more. The employers who have structured it well, who understand how STD and LTD work together, who have set replacement rates and benefit caps that actually protect their workforce, and who have communicated the benefit clearly, are the ones whose employees feel genuinely protected.

Most employers with disability coverage know they have it. Fewer know whether it is competitive, whether the STD-to-LTD handoff is seamless, or whether the benefit caps are adequate for their actual workforce compensation levels. A benchmark built from employers who look like you is the starting point for answering those questions.

Mployer’s benefits rating evaluates STD and LTD offer rates, replacement levels, and benefit caps as part of the Ancillary pillar score, benchmarked against employers in your industry, region, and size band.

See how your benefits package compares to your custom cohort at MployerAdvisor.com.

Sources

Mployer Insights, 2026 Benefits State of the Union: Disability. Source: Mployer Insights analysis of 76,000+ employer benefit plans. All Size Avg, All Region Average, All Industries.

Carrier market share data sourced from Catalyst, a leading analytics platform for carrier market share in the benefits industry. Data reflects fully insured disability plans; market share patterns are broadly representative of self-insured disability plans as well.

Social Security Administration: approximately 1 in 4 workers entering the workforce will experience a disabling condition before retirement age. ssa.gov.

State mandatory disability programs: California SDI, New Jersey TDI, New York DBL, Hawaii TDI, Rhode Island TCI.

Product Updates, August 2026

July 31, 2026

August Release Notes: Catalyst and Insights

Welcome to our latest release. We are excited for you to try the new features. This release focused on four things: making Mployer AI available throughout every product, rebuilding each product's home page to put the AI assistant front and center, adding new filters in Catalyst to help you find more opportunities, and opening free tiers on all products. Below is a summary of the major changes.

Mployer AI throughout Catalyst

The Mployer AI panel is now available on every Catalyst search grid: Employer, Commercial P&C, Broker, Carrier, Company, PEO, and Retirement. You can ask questions about your results without leaving the search.

The home page search bar has been replaced with the same AI chat. You can ask about companies, OSHA data, or benefits in plain language from the top of the page, and your chat history is retained on your device.

All AI surfaces in Catalyst, including the in-app chatbot and home page search, now run on an updated MCP backend, making every assistant significantly smarter.

Commercial Search

Experience Mod, carrier relationship, modeled payroll, and premium are now available as filters and columns in Commercial Search. OSHA and DOT records show violation gravity, the number of employees exposed, and 12-month trend direction across violations, crashes, and drivers. P&C brokers can now build prospect lists around financial exposure and compliance risk directly in the grid.

PEO Search

PEO Search, Snapshot, and Company Snapshot now show a single view of an employer's most recent PEO affiliation, with full switching history available from the same place. Previously, multiple affiliations could appear as separate records. Filters, columns, and exports now include Filing Source, PEO status, Benefits and Overall Rating, Most Recent Filing, EIN, and NAICS, bringing PEO Search in line with Employer Search.

Export and contact visibility

The export modal now shows your remaining credit balance and the actual record count and cost after exclusions, before you confirm. The "Exclude Previously Exported" option now covers the past 12 months rather than your full export history.

Contact records display an email verification status at all times, and you can filter contacts by that status when prioritizing outreach.

Mployer AI on the Insights home page

You can now ask questions about your book of business directly from the Insights home page. An AI assistant sits alongside your submissions and works against your client data, so you can ask which clients scored below benchmark, which reports are complete, which clients qualify for an award, or "show me completed reports where voluntary STD is offered," and get the answer without building filters by hand.

You can filter submissions by benchmark score, lifecycle state, and award eligibility, run reports from the same view, and export any filtered result to CSV.

Free tiers on all products

Every product now includes a free tier. We encourage you to try out all the resources now available to you.  

AI panel on Insights+ reports

The Mployer AI panel on Insights+ HTML reports has been redesigned to match the AI panels in the rest of the platform, with the same layout, controls, and prompt patterns. Generate recommendations and ask any questions about the report and data, and get answers instantly.  

Help Center

A new Help Center is live, with a home page, per-product detail pages, and a video tutorial library. Webinars, product updates, a glossary, and FAQs will be added within the same structure.

If you have questions about any of these changes, contact Partner Success or reach us through the Help Center.

2026 Benefits State of the Union: High-Cost Drugs and What They Mean for Your Health Plan

July 27, 2026

The Likely Fastest-Growing Line in Your Benefits Budget

Modern medicine has produced remarkable advances. Cancer therapies that were not available five years ago are now extending and saving lives. Treatments for autoimmune diseases, multiple sclerosis, and rare genetic conditions are giving employees and their families real options where few existed before. As an employer, providing access to these treatments through your benefit plan is one of the most meaningful things your organization does for the people who work there.

It also comes with a financial reality that every benefits decision maker needs to understand clearly. Over 25% of total employer health benefit expenses are now driven by prescription drugs, and within that figure, a small number of specialty drugs account for an outsized share of the cost. A single covered employee on an oncology therapy can generate $100,000 to $170,000 or more in annual drug spend. A handful of members on these treatments can represent a larger budget impact than the entire pharmacy spend of the rest of your workforce combined. The goal is not to restrict access to these medications. The goal is to understand how the system works, how costs flow, and how to structure your plan so that both your employees and your organization are best positioned for the long term.

This piece covers how the pharmacy benefit system works, how your plan’s tier structure determines who pays what, how stop-loss insurance interacts with high-cost drug claims, and what employers can do to manage this exposure thoughtfully.

The tier structure in the chart above reflects how plans already account for the cost complexity of specialty drugs. Tier 4, which is where specialty biologics and injectables are typically placed, carries significantly higher cost-sharing than the other tiers: an average employee copay of $123 and coinsurance requirements in 31% of plans. But Tier 4 behaves very differently from the other tiers. On Tier 1, 2, and 3 drugs, cost-sharing is relatively predictable and manageable. On Tier 4, the combination of high drug cost and percentage-based coinsurance can generate out-of-pocket exposure that approaches or exceeds a patient’s annual out-of-pocket maximum in a single month of therapy. How Tier 4 is structured, what controls are in place, and how the plan manages cost is one of the most consequential design decisions an employer makes.

Understanding Your Benefit Plan’s Pharmacy Options

How Pharmacy Benefit Managers Work

Most employer health plans do not manage pharmacy benefits directly. That function is delegated to a Pharmacy Benefit Manager, or PBM, which acts as the intermediary between the health plan, the pharmacy, and the drug manufacturer. The PBM builds and maintains the formulary, negotiates drug prices and rebates with manufacturers, contracts with pharmacy networks, and processes pharmacy claims. The three dominant PBMs, Express Scripts (owned by Cigna), CVS Caremark (owned by CVS Health / Aetna), and OptumRx (owned by UnitedHealth Group), together manage the pharmacy benefits of approximately 80% of covered lives in the United States. Each is affiliated with a major carrier, meaning that employers who use an ASO medical arrangement often default to the carrier’s affiliated PBM without realizing it. Independent PBMs such as Capital Rx, Navitus, and MedOne Pharmacy Benefit Solutions operate on transparent, pass-through pricing models that return all rebates to the plan rather than retaining them as PBM revenue. PBMs are compensated through administrative fees, spread pricing (charging the plan more than the pharmacy receives and keeping the difference), manufacturer rebates in exchange for formulary placement, and specialty pharmacy margin. For any employer managing meaningful specialty drug spend, understanding which of these revenue sources applies to your contract is essential.

How Drug Tiers and Cost-Sharing Work

Every pharmacy benefit plan organizes covered drugs into tiers, with cost-sharing that increases as you move from Tier 1 generics (avg. $12 copay) through Tier 2 preferred brands ($40), Tier 3 non-preferred brands ($71), and into Tier 4 specialty drugs ($123 copay, with coinsurance in 31% of plans). The tier placement of a drug affects both what the employee pays and, indirectly, what the plan pays, since tier placement drives utilization patterns. Plan sponsors have real levers here: step therapy (requiring a patient to try a lower-cost drug first), prior authorization, specialty pharmacy channel mandates, and formulary exclusions all affect Tier 4 cost without eliminating clinical access. These controls require balancing cost management with the reality that for many specialty drugs, no lower-cost alternative achieves the same clinical outcome.

How Stop-Loss Insurance Interacts with High-Cost Drug Claims

For self-funded employers, specialty drug claims are now among the most common triggers for individual stop-loss reimbursement. A single employee on a cancer therapy or rare disease treatment can generate pharmacy claims that exceed the plan’s specific stop-loss deductible, which averages $141,938 nationally for self-insured plans, within a single plan year. The mechanics: the employer pays all claims up to the deductible threshold, and the stop-loss carrier reimburses costs above it. Several dynamics are specific to high-cost drugs. At renewal, stop-loss carriers may laser a known high-cost member by raising their individual deductible or excluding them from coverage. Some carriers now specifically carve out GLP-1 medications or other high-utilization drug categories from stop-loss reimbursement, so employers adding new drug coverage should verify what their contract covers. Specialty drugs can also be administered under either the pharmacy benefit or the medical benefit depending on whether they are self-administered or clinic-administered, and some stop-loss contracts apply different terms to each channel. Employers should model their actual specialty drug cost distribution against their stop-loss deductible at every renewal to understand where the plan’s real exposure sits.

The Costliest Specialty Drugs: What They Treat and What They Cost

The chart below shows the highest-cost specialty and biologic drugs by average cost per patient, ranked from most to least expensive. Cancer therapies dominate the top of the list, but treatments for autoimmune conditions, MS, and inflammatory disease also appear, reflecting how broadly specialty drug spending is distributed across a workforce.

  • Darzalex Faspro (daratumumab/hyaluronidase) | $170,800 avg. annual cost per patient. Janssen (J&J). Multiple myeloma, a blood cancer. The highest-cost drug on the list by average patient cost. The subcutaneous formulation allows home administration, increasing the likelihood it flows through the pharmacy benefit rather than the medical benefit.
  • Keytruda (pembrolizumab) | $158,200 avg. annual cost per patient. Merck. FDA-approved across more than 40 cancer indications including lung, melanoma, head and neck, and bladder cancers. One of the most prescribed oncology drugs globally and one of the most common high-cost pharmacy claims in large employer plans.
  • Yervoy (ipilimumab) | $149,800 avg. annual cost per patient. Bristol-Myers Squibb. Melanoma and in combination with Opdivo for lung and other cancers. Combination Yervoy plus Opdivo therapy is among the highest per-patient drug cost regimens in common use.
  • Enhertu (trastuzumab deruxtecan) | $139,800 avg. annual cost per patient. AstraZeneca / Daiichi Sankyo. HER2-positive and HER2-low breast and gastric cancers. A significant recent clinical advance for patients with cancers that previously had limited options after first-line treatment.
  • Opdivo (nivolumab) | $135,600 avg. annual cost per patient. Bristol-Myers Squibb. Melanoma, lung, kidney, bladder, and other cancers. Frequently used in combination with Yervoy, compounding cost significantly when both are prescribed together.
  • Ocrevus (ocrelizumab) | $106,200 avg. annual cost per patient. Genentech. Relapsing and primary progressive multiple sclerosis. MS therapies are a persistent specialty drug cost driver because patients remain on therapy for years, making each diagnosed member a multi-year plan cost.
  • Entyvio (vedolizumab) | $56,600 avg. annual cost per patient. Takeda. Moderate-to-severe Crohn’s disease and ulcerative colitis. Inflammatory bowel disease therapies are among the most common specialty drug claims in employer plans because the conditions are prevalent in working-age adults.

Biosimilars: The Cost Opportunity Most Employers Are Not Fully Using

A biosimilar is a biologic drug that is highly similar to an already-approved reference biologic, with no clinically meaningful differences in safety, purity, or potency. Biosimilars are not generic drugs in the traditional sense, because biologic drugs are complex proteins manufactured from living cells and cannot be chemically replicated exactly. But they go through an FDA approval pathway that confirms their clinical equivalence to the reference product, and they cost significantly less. The biosimilar market has expanded rapidly as major biologic patents have expired. Humira, the world’s best-selling drug for much of the past decade, now has multiple biosimilar competitors in the U.S. Stelara has followed. The oncology biosimilar pipeline is maturing, with more approvals expected in the next two to three years.

The chart above shows what biosimilar substitution looks like in dollar terms. For Humira, the net price after rebates and negotiated discounts is $2,370 per box. The biosimilar Yusimry has an estimated net price of $635, a 73% reduction. For Stelara, the reference drug net price is $7,636 per box. The biosimilar Starjemza has an estimated net price of $4,010, a 47% reduction. For an employee on monthly Humira therapy, the difference between the reference drug and the biosimilar is approximately $21,000 per year in net plan cost. For a Stelara patient, the annual difference is approximately $43,500. Across even a small number of members on these therapies, biosimilar substitution is one of the highest-return cost management interventions available.

Plan sponsors have four main tools to drive biosimilar adoption: preferred formulary placement (putting the biosimilar on a lower tier and the reference drug on a higher tier), step therapy for new patients, automatic substitution where state law permits, and formulary exclusion of the reference drug entirely. The most important variable in any biosimilar strategy is whether your PBM has a financial incentive to keep the reference drug preferred. A PBM earning a large rebate on Humira has a direct financial reason to keep Humira on the preferred formulary, even when the biosimilar costs the plan less on a net basis. Independent PBMs operating on pass-through pricing remove this conflict entirely, because all rebates return to the plan and formulary decisions are made without a competing financial interest.

What Employers Should Be Asking About Their Pharmacy Benefit

High-cost drug management requires active decisions about PBM contract structure, formulary design, specialty pharmacy strategy, and stop-loss alignment. The questions worth asking at every renewal:

  • Is your PBM contract pass-through or spread-based? A pass-through model means you pay exactly what the pharmacy receives and all rebates come back to the plan. A spread-based model means the PBM earns revenue that is not visible in the administrative fee. Request full compensation disclosure under the CAA requirements.
  • Are you receiving all available biosimilar savings? Ask your PBM for a net cost comparison of each reference drug plus rebate against the available biosimilar net price. The answer will tell you whether your formulary is designed around the plan’s cost interest or the PBM’s rebate interest.
  • What is your specialty drug channel strategy? Are specialty prescriptions being filled through your PBM’s affiliated specialty pharmacy? Carving specialty to an independent pharmacy or using a white-bagging program for clinic-administered drugs can generate meaningful cost differences.
  • How does your stop-loss deductible interact with your specialty drug exposure? Model your actual specialty drug claims against your stop-loss threshold. If most of your high-cost drug claims fall below the deductible, the plan is absorbing those costs without triggering reimbursement.
  • Does your formulary have appropriate Tier 4 controls? Step therapy, prior authorization, and quantity limits on specialty drugs reduce cost without eliminating clinical access. Without these controls, high-cost therapies can be approved and dispensed without any plan-level review of whether a lower-cost alternative exists.

Know How Your Pharmacy Benefit Compares

Pharmacy is now one of the two or three most consequential cost management decisions in health plan design. The employers managing it well are not restricting access to the medications their employees need. They are ensuring that the structure of the benefit, the PBM contract, the formulary design, and the stop-loss coverage work together in the plan’s interest, and that every dollar spent on high-cost drugs is spent as efficiently as possible.

Mployer’s benefits rating evaluates pharmacy benefit design as part of the Medical pillar score, benchmarked against a custom cohort matched by size, region, and industry. Knowing where your pharmacy benefit stands relative to employers who actually look like you is the starting point for making better decisions.

See how your benefits package compares to your custom cohort at MployerAdvisor.com.

Sources

Mployer Insights: Average Spend by Setting, Prescription Structure, and High-Cost Specialty Drugs. Source: Mployer Insights analysis.

MedOne Pharmacy Benefit Solutions: Biosimilar substitution impact data for Humira/Yusimry and Stelara/Starjemza. MedOne is a leading independent PBM focused on improving health outcomes and reducing net costs for self-funded employers. [email protected].

Mployer 2025 and 2026 Employee Benefit Plan Design Study, covering 50,000+ employer plans. Individual stop-loss avg $141,938 self-insured.

Consolidated Appropriations Act of 2021, Section 202: broker/consultant compensation disclosure requirements for group health plans.

FDA Biosimilar approval framework: 42 U.S.C. Section 262(k).