By Mployer Team
December 12, 2023
Updated
December 12, 2023
6
min read

The holiday season is upon us, and for many, Christmas is a focal point of festivities. As a US-based employer, understanding the nuances of this widely celebrated holiday is essential for fostering an inclusive and respectful workplace environment. In this guide, we'll explore specific dates, the level of importance, background information, cultural practices, and how to navigate legal and compliance considerations related to Christmas.

Specific Dates to Keep in Mind  

Christmas Day, the central celebration, falls on December 25th each year. However, it's important to note that many employees may take time off in the days leading up to Christmas, and some may continue celebrating through New Year's Day. Be mindful of this when planning work schedulDes and projects during December.

Level of Importance

In the United States, Christmas holds high cultural significance. While it is rooted in Christian traditions, it has become a widely embraced cultural and secular holiday. Many Americans, regardless of religious affiliation, participate in Christmas celebrations, making it a high-importance holiday for a vast majority of the population.

Background on the Holiday

Christmas commemorates the birth of Jesus Christ. Beyond its religious origins, it has evolved into a time of joy, gift-giving, and festive decorations. The holiday season officially kicks off with Thanksgiving in late November, and Christmas marks the culmination of the festive period.

Specific Cultural Practices

While Christmas traditions vary among individuals and families, some common practices include decorating homes with Christmas trees and lights, exchanging gifts, and attending church services. Some families may have specific customs, such as not eating past sundown on Christmas Eve or wearing certain colors or festive attire during celebrations.

Specific Foods

Christmas is often associated with special meals and treats. Traditional dishes may include roast turkey or ham, mashed potatoes, stuffing, and a variety of desserts like Christmas cookies and fruitcake. Consideration for dietary restrictions and preferences within your team is essential if planning workplace celebrations involving food.

Celebrating Christmas as a US Employer

Recognizing and respecting the diversity of your workforce is crucial during the holiday season. Consider these inclusive strategies:

  • Flexible Scheduling: Acknowledge that employees may have personal commitments during the holiday season and be open to flexible work arrangements.
  • Inclusive Decorations: If decorating the workplace, opt for neutral and inclusive decorations that represent the holiday spirit without favoring any specific religious or cultural beliefs.
  • Company-wide Celebration: Organize inclusive events that embrace the diversity of your team. Consider a "holiday" celebration that encompasses various cultural festivities observed by employees.

Communicating Christmas to Your Teams

Subject: Celebrating the Holiday Season Together

Dear [Team],

As the holiday season approaches, we want to take a moment to recognize the diversity within our team and celebrate the upcoming festivities. Christmas, a widely observed holiday, is an occasion for joy and togetherness.

While Christmas has Christian origins, it has evolved into a cultural and secular celebration for many. As we approach December, we encourage everyone to embrace the spirit of the season in a way that resonates with their beliefs and traditions.

If you have specific customs or practices related to Christmas that you'd like to share with the team or if you have any preferences regarding workplace celebrations, please feel free to communicate with [HR/Management]. Our goal is to ensure that everyone feels included and respected during this festive time.

Wishing you a joyous and inclusive holiday season!

Warm regards, [Your Company]

Legal and Compliance

  • Time-off Requests: Be prepared for an increase in time-off requests during the holiday season. Establish clear guidelines for requesting time off and ensure fairness in granting time-off requests.
  • Religious Accommodations: Be aware of religious accommodations that employees may request related to Christmas observances. Ensure compliance with anti-discrimination laws and make reasonable accommodations where necessary.
  • Inclusive Language: Use inclusive language in communications and avoid assuming that everyone celebrates Christmas. Consider using phrases like "holiday season" or "end-of-year celebrations" to be more inclusive.

Navigating the holiday season as a US employer requires a delicate balance between celebrating traditions and respecting the diversity within your workforce. By fostering an inclusive and understanding environment, you can ensure that everyone feels valued and appreciated during this festive time.
Next Up

2026 Benefits State of the Union: Life Insurance

August 28, 2026

2026 Benefits State of the Union: Life Insurance

Why Employers Offer Life Insurance (And Why It Matters More Than They Think)

Life insurance is not legally required of private employers. There is no federal mandate compelling you to offer it. And yet 83% of employers do. That near-universal adoption is not driven by regulation. It is driven by the recognition that a basic life insurance benefit is one of the clearest signals an employer can send about how it views its relationship with the people who work there.

At its core, employer-sponsored group life insurance provides a death benefit to an employee’s designated beneficiaries if that employee dies while covered under the plan. For most employees, particularly those with families and financial dependents, that coverage represents real peace of mind. It costs the employer relatively little to provide. It means a great deal to the employee who has it. And when it is absent, employees notice, especially those at stages of life where financial protection for their families is a priority.

This post approaches life insurance from the employer’s perspective: what you are providing, how to structure it, what the market looks like, how to explain it to your workforce, and what questions to ask at your next renewal. Life insurance rarely wins a job offer on its own. But it is a visible component of a benefits package that candidates and employees evaluate as part of the whole picture.

What You Are Actually Offering: Key Terms and Plan Types

Understanding the vocabulary of group life insurance is the starting point for making good decisions about it and communicating clearly about it to employees.

  • Group term life insurance. The most common form of employer-sponsored life insurance. The employer purchases a group policy from a carrier, and all eligible employees are covered under the same contract. Coverage lasts only while the employee is actively employed and enrolled in the plan. There is no cash value and no investment component. It is pure death benefit coverage.
  • Noncontributory (employer-paid). The employer pays 100% of the premium. 96% of employer-sponsored basic life plans are noncontributory, according to Mployer’s data. This is the standard structure for basic life coverage and is generally expected by employees as a baseline benefit.
  • Contributory (employee-paid or shared). The employee pays part or all of the premium. Voluntary life insurance, offered by 92% of employers, is typically structured this way. Employees elect to purchase additional coverage beyond the employer-provided basic amount, at group rates that are typically lower than what they could obtain individually.
  • Face amount / death benefit. The dollar amount paid to beneficiaries upon the employee’s death. This is the number that matters most to employees and their families. How you set this amount, and whether it keeps pace with wage growth, determines whether the benefit is actually meaningful.
  • Flat dollar benefit. The benefit is set as a fixed dollar amount for all covered employees, regardless of salary. 36% of employers use this structure. Simple to administer and communicate, but can become inadequate over time if the flat amount does not increase as wages do.
  • Multiple of earnings (variable % of earnings). The benefit is set as a multiple of the employee’s annual salary, for example 1x or 2x pay. 47% of employers use this structure. Scales automatically with compensation, which means higher-paid employees receive proportionally more coverage without plan amendments.
  • Accidental death and dismemberment (AD&D). A supplemental benefit that pays an additional amount, or a portion of the face amount, if the employee dies as a result of an accident or suffers a qualifying injury such as loss of a limb or vision. Often bundled with basic life coverage. The median AD&D benefit at the 50th percentile is $300,000; at the 75th percentile it reaches $500,000.
  • Portability. One of the most valuable but least-communicated features of group life insurance. Portability allows a departing employee to continue their group life coverage after leaving employment, converting the group policy to an individual policy or taking a portable term policy, without having to prove insurability. This matters enormously to employees who have developed health conditions while employed and might not qualify for individual coverage on the open market. Employers who offer portable group life and communicate that feature at onboarding are providing real financial protection that extends beyond employment. Not all group life plans offer portability, and the terms vary by carrier. This is worth confirming and communicating explicitly.

Offer Rates: Basic Life and Voluntary Life
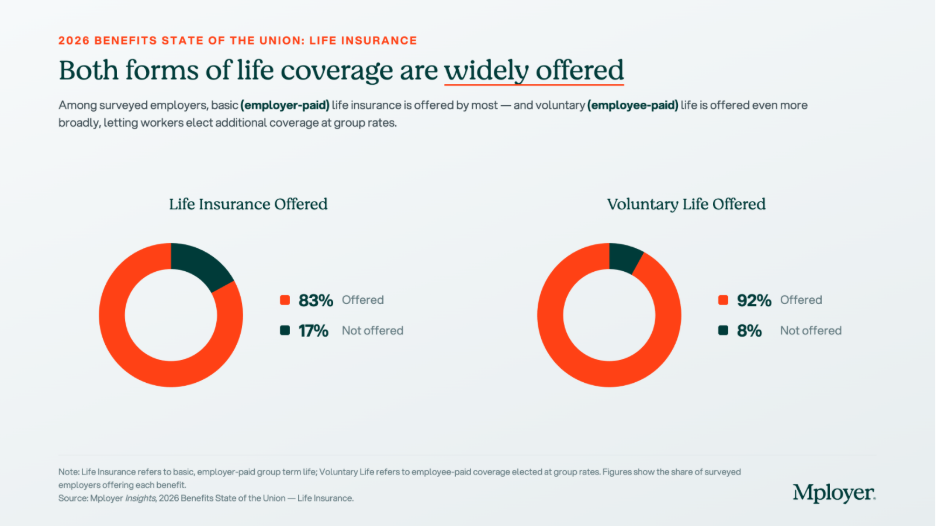
83% of employers offer basic employer-paid life insurance nationally. Among those employees whose employers offer it, 97% are enrolled, one of the highest participation rates of any benefit. That near-universal enrollment reflects how employees treat basic life insurance: when it is offered at no cost, virtually everyone accepts it. 96% of basic life plans are noncontributory, meaning the employer absorbs the full premium cost.

Voluntary life, offered by 92% of employers, allows employees to purchase additional coverage beyond the employer-paid basic amount. Voluntary life is typically employee-paid at group rates, which are generally lower than individual market rates and, critically, often available without medical underwriting up to a guaranteed issue amount. For employees who want more than 1x salary coverage or whose family situation warrants higher protection, voluntary life is how they get it without going through individual underwriting. Offering voluntary life costs the employer very little in direct dollars, since employees fund it themselves, but it adds meaningful value to the benefits package and is worth communicating clearly at open enrollment.

How the Benefit Is Structured: Flat Dollar vs. Earnings Multiple
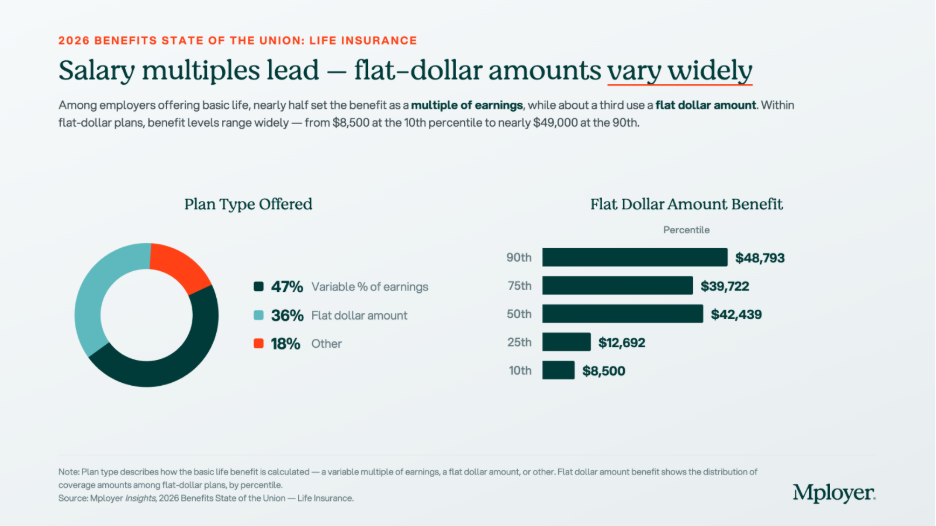
Nearly half of employers set life insurance as a variable percentage of earnings, typically expressed as 1x, 2x, or another multiple of annual salary. About a third use a flat dollar amount. The choice between these two structures has meaningful implications for both the employer and the employee.

Flat dollar plans are simple to administer and easy for employees to understand. A $50,000 life insurance benefit is a $50,000 life insurance benefit. The limitation is that a flat dollar amount set years ago may have become inadequate as wages and inflation have risen. An employee earning $90,000 with a $25,000 flat life insurance benefit has coverage that would not cover a year of their salary. Flat dollar plans should be reviewed periodically against wage growth, not just against the carrier market.

Earnings multiples scale automatically. When an employee receives a raise, their life insurance coverage increases proportionally without any plan amendment or administrative action. For employers with meaningful variation in compensation across the workforce, an earnings multiple ensures that the benefit stays proportionally relevant for all employees. The tradeoff is slightly more complexity in administration and in communicating the benefit to employees who need to understand that their coverage changes with their pay.

Among flat dollar plans, the range is significant: from $8,500 at the 10th percentile to $48,793 at the 90th percentile. An employer with a $10,000 flat dollar benefit is offering a benefit that does not cover even a quarter of the median household income. That is a visible gap to employees who are evaluating their financial protection.

The Earnings Multiple Market: One Times Pay Dominates
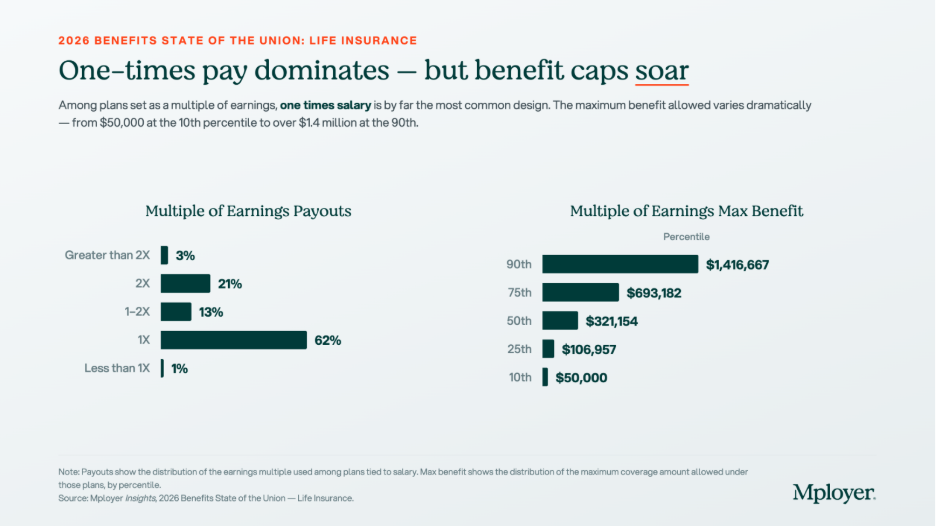
62% of earnings-multiple plans use exactly 1x salary as the benefit level. 21% use 2x, and 13% sit between 1x and 2x. Only 3% go above 2x salary.

1x salary is the market standard, but it is worth being honest with employees about what that means in practice. Financial planning guidance consistently suggests that individuals need 10 to 12 times their annual income in life insurance to adequately protect dependents over the long term. 1x salary covers roughly one year of income replacement before an employee’s family needs to find another source of financial support. For an employer, providing 1x salary as a baseline and offering voluntary life insurance for employees who want more is a reasonable and common approach. What matters is communicating both clearly: here is what the company provides, and here is how you can supplement it if your situation warrants it.

The maximum benefit cap data shows wide variation across the market. The median maximum benefit under earnings-multiple plans is $321,154, but this rises steeply toward the top: $693,182 at the 75th percentile and $1,416,667 at the 90th percentile. These high caps are most common among plans designed for organizations with significant executive or high-income populations, where a 1x or 2x multiple on a high salary generates a large face amount. Setting an appropriate maximum benefit is a plan design decision that affects both cost and equity across the workforce.

Portability and Communication: Two Places Most Employers Fall Short

Two of the most underutilized dimensions of employer-sponsored life insurance are portability and active communication. Both represent real value that most employees never fully receive because employers do not proactively surface them.

Portability

When an employee leaves your organization, what happens to their life insurance coverage? In most group plans, it ends. But many group life plans offer portability, the option for a departing employee to convert their group coverage to an individual policy or take a portable term policy with them, without having to go through medical underwriting again. For an employee who has developed diabetes, heart disease, or any other condition while employed, this feature can be the difference between being able to obtain affordable life insurance and being priced out of the individual market entirely.

Portability terms vary by carrier and plan design. Some plans allow full portability of the basic benefit; others allow conversion only. Some require the employee to act within 31 days of separation. Employers who know what their plan offers and communicate it proactively at offboarding, not just in the fine print of a benefits guide, are delivering real value to departing employees at a moment when that information is most useful.

Communication

Group life insurance has a 97% enrollment rate when offered at no cost, but a significantly lower rate of employee understanding. Most employees know they have life insurance through their employer. Very few know the face amount, whether it is set as a multiple of their salary, what their current death benefit would be, whether they have AD&D coverage, or whether the plan is portable. The annual open enrollment period is the most reliable moment to give employees a clear, plain-language statement of what they have: your current life insurance benefit is X dollars, which represents approximately Y months of your salary, and you have the option to increase your coverage to Z through voluntary life.

This is not just an employee wellbeing gesture. It is an employer brand decision. Employees who understand and appreciate their benefits are more likely to value their total compensation accurately, which affects retention.

The Carrier Market: Fragmented and Worth Shopping
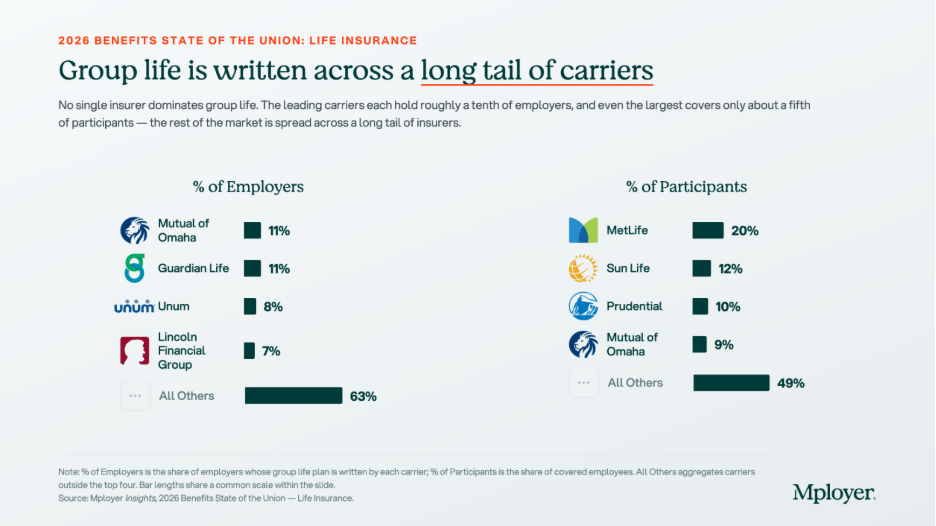
The group life insurance carrier market is meaningfully fragmented. No single insurer holds more than 11% of employers nationally, and the top four carriers combined cover less than 40% of employers. The All Others category at 63% of employers reflects a long tail of regional carriers, specialty insurers, and smaller national players that collectively write the majority of group life business.

The participant view looks different. MetLife, which ranks outside the top two by employer count, covers 20% of participants by covered lives, reflecting its strength at large-employer accounts with high headcounts. Sun Life’s 12% participant share relative to a smaller employer-count share follows the same pattern: large-account concentration that does not show up proportionally in employer count.

The fragmentation of this market is good news for employers at renewal. There is no single dominant carrier with pricing power, and switching carriers on a group life plan is relatively straightforward compared to switching a medical carrier. Employers who have not formally gone to market on group life in three or more years are worth doing so. Premium rates, portability terms, guaranteed issue amounts for voluntary life, and AD&D inclusion can vary meaningfully across carriers at the same coverage level.

Questions Every Employer Should Be Able to Answer About Their Life Insurance Plan

  • What is our current death benefit, and how is it calculated? If you cannot answer this from memory, your employees almost certainly cannot either. Know whether it is flat dollar or a multiple of earnings, and what the current face amount is for a median employee at your organization.
  • Is our basic life coverage adequate relative to our workforce compensation? A $25,000 flat benefit at an organization where median compensation is $75,000 is not a competitive benefit. It is a checkbox. Review the relationship between your benefit level and your actual compensation distribution.
  • Do we offer voluntary life, and do employees understand how to use it? Voluntary life at group rates is one of the most cost-effective ways to let employees increase their financial protection without significant employer cost. If you offer it, communicate it actively at open enrollment. If you do not, consider whether to add it.
  • Is our plan portable, and do we communicate that at offboarding? Confirm what your carrier’s portability terms are and build a standard communication into your offboarding process. An employee who leaves your organization and loses coverage they did not know could travel with them has been underserved by a plan feature that cost you nothing to communicate.
  • When did we last go to market on this benefit? Group life insurance is one of the simpler benefits to put out to bid. If you have not compared carrier pricing and terms in three or more years, you may be paying above-market rates for a benefit that could be restructured without reducing coverage.

Know How Your Life Insurance Compares

Life insurance is not the most complex benefit you manage. But it is one where the gap between what employers think they are providing and what employees actually understand and value is consistently wide. The employers who close that gap, by structuring the benefit deliberately, communicating it clearly, and knowing how it compares to market, are the ones who get credit for it.

Mployer’s benefits rating evaluates life insurance benefit levels, plan structure, and voluntary life availability as part of the Ancillary pillar score, benchmarked against employers in your industry, region, and size band.

See how your benefits package compares to your custom cohort at MployerAdvisor.com.

Sources

Mployer Insights, 2026 Benefits State of the Union: Life Insurance. Source: Mployer Insights analysis of 76,000+ employer benefit plans. All Size Avg, All Region Average, All Industries.

Carrier market share data sourced from Catalyst, a leading analytics platform for carrier market share in the benefits industry. Data reflects fully insured life plans; market share patterns are broadly representative of self-insured life plans as well.

AD&D benefit data: Mployer Insights, 2026 Benefits State of the Union. 25th percentile $150,000 / 50th percentile $300,000 / 75th percentile $500,000.

2026 Benefits State of the Union: Disability Insurance

August 21, 2026

2026 Benefits State of the Union: Disability Insurance

The Benefit That Protects the Paycheck

Disability insurance does not get the attention of health insurance or retirement savings. It rarely comes up in candidate conversations, and most employees give it little thought until they need it. But consider the actual risk it addresses: the Social Security Administration estimates that one in four workers entering the workforce today will experience a disabling condition lasting 90 days or more before they reach retirement age. That is not a rare event. It is a common financial risk that most people are not adequately prepared for on their own.

As an employer, disability insurance is one of the most direct ways you can protect your employees’ financial security when something goes wrong. It replaces a portion of their income when illness or injury prevents them from working, which keeps employees from facing simultaneous health and financial crises at the most difficult moments of their lives. The fact that only 41% of employers offer short-term disability and 38% offer long-term disability nationally means that offering both represents a genuine differentiator in the market, not just table stakes.

This post covers how disability insurance works, how to structure it, what the national data shows about offer rates and benefit levels, and what employers should be asking at their next renewal.

What Disability Insurance Actually Is: Key Terms

  • Short-term disability (STD). Insurance that replaces a portion of an employee’s income when they are temporarily unable to work due to illness or injury, including childbirth recovery. STD typically covers periods of weeks to a few months. It is the first layer of income protection and, for many employees, the foundation of maternity leave. Offered by 41% of employers nationally.
  • Long-term disability (LTD). Insurance that provides income replacement for extended disability lasting beyond the short-term period, often months or years. LTD is designed to take over when STD benefits end. Offered by 38% of employers nationally. Because LTD covers the more catastrophic scenarios, the benefit period can extend to age 65 or even lifetime in some plans.
  • Elimination period (waiting period). The number of days an employee must be disabled before benefits begin. For STD, 60% of plans use a 7-day elimination period; 23% use 14 days. For LTD, 68% use a 90-day elimination period; 23% use 180 days. The elimination period is the gap the employee must bridge with sick leave, PTO, or personal savings before disability income kicks in. Understanding how your STD and LTD elimination periods align is critical, and is covered in detail below.
  • Income replacement percentage. The share of the employee’s pre-disability earnings that the benefit replaces. 60% of earnings is the most common rate nationally for both STD and LTD. This means an employee earning $80,000 per year receives approximately $48,000 annually in disability benefits, not their full salary.
  • Maximum benefit cap. The maximum weekly (STD) or monthly (LTD) dollar amount the plan will pay, regardless of salary. This cap disproportionately affects higher-earning employees. At the 50th percentile, the STD maximum weekly benefit is $1,602 (annualizing to approximately $83,000) and the LTD maximum monthly benefit is $8,273 (approximately $99,000 annually). For employees earning above these levels, the cap creates a coverage gap.
  • Own-occupation vs. any-occupation definition. How the plan defines disability matters enormously at claim time. An own-occupation definition pays benefits if the employee cannot perform the duties of their specific job. An any-occupation definition pays only if the employee cannot work in any job for which they are reasonably qualified. Own-occupation definitions are more employee-favorable; any-occupation definitions are more restrictive and more common in group LTD plans.
  • Coordination with state programs. Several states operate mandatory short-term disability programs: California (SDI), New Jersey (TDI), New York (DBL), Hawaii (TDI), and Rhode Island (TCI). Employers in these states must navigate the interaction between the state-mandated benefit and any employer-sponsored STD plan. Some employers use the state program as the foundation and top up to a higher replacement level; others offer a separate employer plan that coordinates with state benefits.

Who Is Offering Disability Coverage and Why It Varies

Nationally, 41% of employers offer STD and 38% offer LTD. The majority do not offer either. That gap is concentrated among smaller employers, where the cost and administrative complexity of disability plans is less easily absorbed, and among industries where the workforce skews hourly or part-time and where disability programs have historically been less common.

Industries with higher physical demands, particularly manufacturing, construction, and transportation, tend to have stronger disability offer rates because the risk of workplace-related injury or illness is more visible and the case for income protection is easier to make. Knowledge-worker industries have historically underinvested in disability relative to the actual statistical risk, partly because the risk is less immediately visible when employees are not working in physically hazardous environments.

For employers who do not currently offer disability insurance, the business case is straightforward: an employee who becomes disabled and has no income protection may be forced to leave the workforce entirely or exhaust all personal savings before returning. Disability coverage keeps employees financially stable during recovery, which increases the likelihood of return-to-work and reduces the employer’s replacement and retraining costs. It is both a benefit for employees and a business continuity tool for the employer.

Short-Term Disability: Structure, Replacement Rates, and the STD Benefit Period

Among employers offering STD, 77% use a fixed percentage of earnings as the benefit structure, meaning all covered employees receive the same income replacement rate regardless of their salary. 22% use a variable percentage, where the replacement rate differs by employee group or salary band.

43% of plans replace exactly 60% of earnings, the long-standing market standard. 24% replace 50%, and 18% replace more than 69% of earnings. The remainder cluster in various intermediate rates. A 60% replacement rate means an employee on STD receives roughly three-fifths of their normal paycheck, which for many employees is adequate for a short-term period but creates real financial pressure if the disability extends for weeks or months.

The STD benefit period is how long the benefit continues to pay. The median benefit period at the 50th percentile and above is 26 weeks, meaning the plan pays for up to 26 weeks of disability. At the 25th percentile it drops to 17 weeks and at the 10th percentile to 13 weeks. The length of the STD benefit period matters particularly for cases involving serious illness, injury recovery, or maternity leave, where employees may need more than a few weeks before they can return to work.

For birth parents, STD is the financial foundation of maternity leave. The disability period covers the recovery from childbirth, typically six weeks for vaginal delivery and eight weeks for cesarean. Whether and how the employer structures additional paid leave on top of that STD period is a separate decision, covered in our Leave Benefits series.

Long-Term Disability: Structure and the Handoff from STD

LTD differs from STD in an important structural way: 55% of LTD plans use a variable percentage of earnings, compared to 77% of STD plans using a fixed rate. This reflects the longer duration of LTD benefits and the greater complexity of long-term disability claims, where factors like Social Security offset, return-to-work provisions, and benefit period length interact with the income replacement rate.

63% of LTD plans replace exactly 60% of earnings when a fixed rate is specified, which is the same dominant standard as STD. The consistency of 60% as the market standard across both short and long-term disability reflects decades of actuarial convention: 60% is enough to sustain basic living expenses for most employees without creating a financial incentive to remain on disability rather than return to work.

The most important design question in LTD is how and when it coordinates with STD. The handoff depends entirely on elimination periods aligning correctly.

How the STD-to-LTD Handoff Works: Elimination Periods

The elimination period is the number of days an employee must be disabled before benefits begin. Getting this right is one of the most important design decisions in disability plan structure, because a gap between the end of STD and the start of LTD leaves employees without income during an already difficult period.

For STD, 60% of plans use a 7-day elimination period. This means an employee who becomes disabled on Monday begins accumulating toward their benefit on Tuesday, with the first check typically arriving at the end of the first covered week. 23% of plans use a 14-day elimination period. The most common structure is for employees to bridge the elimination period with accrued sick leave or PTO, which is why the interaction between the STD elimination period and the employer’s sick leave bank matters.

For LTD, 68% of plans use a 90-day elimination period, and 23% use 180 days. The 90-day LTD elimination period is designed to align with the end of a standard STD benefit period: if STD pays for up to 26 weeks (approximately 182 days), an LTD plan with a 90-day elimination period will begin before STD ends, creating a clean handoff with no income gap. Where the misalignment typically occurs is when an employer offers LTD without STD, or when the STD benefit period is shorter than the LTD elimination period. In that scenario, an employee who remains disabled after STD ends faces a gap of days, weeks, or months with no income before LTD begins. Employers should map their own STD benefit period against their LTD elimination period explicitly to confirm there is no gap.

Maximum Benefit Caps: What They Mean for Your Workforce

The maximum benefit cap is where disability plans most visibly fail higher-earning employees. The cap sets an absolute ceiling on the weekly or monthly benefit payment, regardless of what the percentage replacement would otherwise produce.

At the median (50th percentile), the STD maximum weekly benefit is $1,602. Annualized, that is approximately $83,000 of covered income. An employee earning $120,000 per year with a 60% replacement rate would normally expect $72,000 annually in STD benefits. At the median cap of $1,602 per week, they receive $83,304 annualized, so the cap does not bind for that employee. But an employee earning $200,000 per year who expects $120,000 in annual benefits hits the median cap at $83,304, receiving only about 42% of their salary rather than the stated 60%.

The LTD median monthly cap of $8,273 annualizes to approximately $99,000. For employees earning above $165,000 per year, the standard 60% replacement rate begins to be limited by this cap. At the 90th percentile, the LTD cap reaches $16,067 per month ($192,804 annualized), which provides meaningful coverage for higher-income employees. The range from 10th to 90th percentile ($4,073 to $16,067 monthly) reflects the wide variation in how generously employers set maximum benefit limits.

For employers with meaningful high-earning populations, the maximum benefit cap deserves deliberate attention. An executive or senior professional who becomes disabled and discovers their LTD benefit is capped at a level far below their salary has a financial gap that employer-sponsored disability, as structured, does not fill. Executive disability policies and supplemental individual disability insurance are the tools for addressing this, and brokers who work with professional services or technology firms routinely review this gap as part of a benefits assessment.

The Carrier Market

Like group life insurance, the disability carrier market is fragmented with no single dominant player. Mutual of Omaha leads by employer count at 12%, followed closely by Guardian Life at 11%. The participant view shifts noticeably: MetLife and Sun Life each cover 14% of participants, reflecting their strength at large-employer accounts with high headcounts. The Hartford, absent from the top-four employer-count list, appears at 10% of participants for the same reason.

The carriers that dominate disability by employer count, Mutual of Omaha, Guardian Life, and Unum, have strong expertise in the small to mid-market segment and offer integrated STD/LTD packages that are easy to implement alongside life insurance from the same carrier. Employers already working with one of these carriers for life insurance often find that bundling disability simplifies administration and can generate favorable pricing.

As with life insurance, the fragmentation of this market is an opportunity. There is no carrier with enough market concentration to hold pricing power unilaterally, and disability is one of the easier benefits lines to put to competitive bid. Employers who have not reviewed their disability carriers and pricing in three or more years should do so, particularly if their workforce demographics have shifted or if they have grown into a size band where different carrier economics apply.

Questions Every Employer Should Be Able to Answer About Their Disability Coverage

  • Do we offer both STD and LTD, or just one? STD alone leaves employees exposed to extended disability. LTD alone leaves employees with a significant income gap before long-term benefits begin. The programs are designed to work together. If you offer only one, understand what the gap means for your employees.
  • Does our STD benefit period align with our LTD elimination period? Map these two numbers explicitly. If your STD pays for 13 weeks and your LTD has a 90-day elimination period, employees who remain disabled after 13 weeks face a gap. If STD pays for 26 weeks and LTD begins at 90 days, the handoff is clean.
  • What income replacement rate do we offer, and is it adequate? 60% is the market standard and is generally sufficient for short-term periods. Consider whether 60% is enough for your specific workforce demographics and compensation levels, and whether any employee groups face hardship at that replacement rate.
  • Are our maximum benefit caps appropriate for our compensation structure? Pull the actual annual salary distribution of your workforce and compare it to your STD and LTD benefit caps. Identify the salary level at which the cap begins limiting coverage and evaluate whether that is acceptable given your workforce composition.
  • Do we operate in a state with mandatory disability programs, and have we optimized the coordination? Employers in California, New Jersey, New York, Hawaii, and Rhode Island operate within state-mandated disability frameworks. The interaction between the state program and any employer-sponsored coverage should be reviewed explicitly to avoid duplication and to maximize the total benefit employees receive.
  • When did we last go to market on disability? Disability pricing is experience-rated over time and should be reviewed periodically, particularly as workforce size, demographics, and claims history change. If you have not compared carrier pricing and terms in three or more years, a market review is overdue.

Know Where Your Disability Coverage Stands

Disability insurance is the benefit employees rarely think about until they need it, at which point nothing else matters more. The employers who have structured it well, who understand how STD and LTD work together, who have set replacement rates and benefit caps that actually protect their workforce, and who have communicated the benefit clearly, are the ones whose employees feel genuinely protected.

Most employers with disability coverage know they have it. Fewer know whether it is competitive, whether the STD-to-LTD handoff is seamless, or whether the benefit caps are adequate for their actual workforce compensation levels. A benchmark built from employers who look like you is the starting point for answering those questions.

Mployer’s benefits rating evaluates STD and LTD offer rates, replacement levels, and benefit caps as part of the Ancillary pillar score, benchmarked against employers in your industry, region, and size band.

See how your benefits package compares to your custom cohort at MployerAdvisor.com.

Sources

Mployer Insights, 2026 Benefits State of the Union: Disability. Source: Mployer Insights analysis of 76,000+ employer benefit plans. All Size Avg, All Region Average, All Industries.

Carrier market share data sourced from Catalyst, a leading analytics platform for carrier market share in the benefits industry. Data reflects fully insured disability plans; market share patterns are broadly representative of self-insured disability plans as well.

Social Security Administration: approximately 1 in 4 workers entering the workforce will experience a disabling condition before retirement age. ssa.gov.

State mandatory disability programs: California SDI, New Jersey TDI, New York DBL, Hawaii TDI, Rhode Island TCI.

Product Updates, August 2026

July 31, 2026

August Release Notes: Catalyst and Insights

Welcome to our latest release. We are excited for you to try the new features. This release focused on four things: making Mployer AI available throughout every product, rebuilding each product's home page to put the AI assistant front and center, adding new filters in Catalyst to help you find more opportunities, and opening free tiers on all products. Below is a summary of the major changes.

Mployer AI throughout Catalyst

The Mployer AI panel is now available on every Catalyst search grid: Employer, Commercial P&C, Broker, Carrier, Company, PEO, and Retirement. You can ask questions about your results without leaving the search.

The home page search bar has been replaced with the same AI chat. You can ask about companies, OSHA data, or benefits in plain language from the top of the page, and your chat history is retained on your device.

All AI surfaces in Catalyst, including the in-app chatbot and home page search, now run on an updated MCP backend, making every assistant significantly smarter.

Commercial Search

Experience Mod, carrier relationship, modeled payroll, and premium are now available as filters and columns in Commercial Search. OSHA and DOT records show violation gravity, the number of employees exposed, and 12-month trend direction across violations, crashes, and drivers. P&C brokers can now build prospect lists around financial exposure and compliance risk directly in the grid.

PEO Search

PEO Search, Snapshot, and Company Snapshot now show a single view of an employer's most recent PEO affiliation, with full switching history available from the same place. Previously, multiple affiliations could appear as separate records. Filters, columns, and exports now include Filing Source, PEO status, Benefits and Overall Rating, Most Recent Filing, EIN, and NAICS, bringing PEO Search in line with Employer Search.

Export and contact visibility

The export modal now shows your remaining credit balance and the actual record count and cost after exclusions, before you confirm. The "Exclude Previously Exported" option now covers the past 12 months rather than your full export history.

Contact records display an email verification status at all times, and you can filter contacts by that status when prioritizing outreach.

Mployer AI on the Insights home page

You can now ask questions about your book of business directly from the Insights home page. An AI assistant sits alongside your submissions and works against your client data, so you can ask which clients scored below benchmark, which reports are complete, which clients qualify for an award, or "show me completed reports where voluntary STD is offered," and get the answer without building filters by hand.

You can filter submissions by benchmark score, lifecycle state, and award eligibility, run reports from the same view, and export any filtered result to CSV.

Free tiers on all products

Every product now includes a free tier. We encourage you to try out all the resources now available to you.  

AI panel on Insights+ reports

The Mployer AI panel on Insights+ HTML reports has been redesigned to match the AI panels in the rest of the platform, with the same layout, controls, and prompt patterns. Generate recommendations and ask any questions about the report and data, and get answers instantly.  

Help Center

A new Help Center is live, with a home page, per-product detail pages, and a video tutorial library. Webinars, product updates, a glossary, and FAQs will be added within the same structure.

If you have questions about any of these changes, contact Partner Success or reach us through the Help Center.