

.svg)
The average US employee costs their employer about $45.42 per hour in total compensation expenses, excluding members of the armed forces. A little less than 70% ($31.29) of that total compensation was earned in salary and/or wages while a little more than 30% ($14.13) of that expense covered employee benefits and perks according to the BLS.
Benefits and perks cross a number of segments. Below is the full breakdown but as you can imagine, the majority comes from medical, social security, leave, and retirement. While life, disability, dental and vision are all important, the only represent a small percentage of the full medical.
Employers each year invest over $1T into their employee's benefits, this is over 5% of the US GDP. Your firm does the same, employee benefits are often one of the top five expenses each year for an employer, in some industries it is in the top three.
Going one level deeper, the average hourly wage/salary costs were nearly identical between service employees and goods producing employees at $30.34 and $30.31 hours, respectively, whereas the average hourly employee benefits expense was a couple dollars higher for goods-producing employees at $14.44 an hour per employee than for service employees at $12.44 an hour per employee.
Expenses derived from leave, however, whether paid time off or sick leave, were slightly higher for the service industries at $3.34 per hour relative to the $2.82 per hour average leave expense for employees in industries that produce goods.
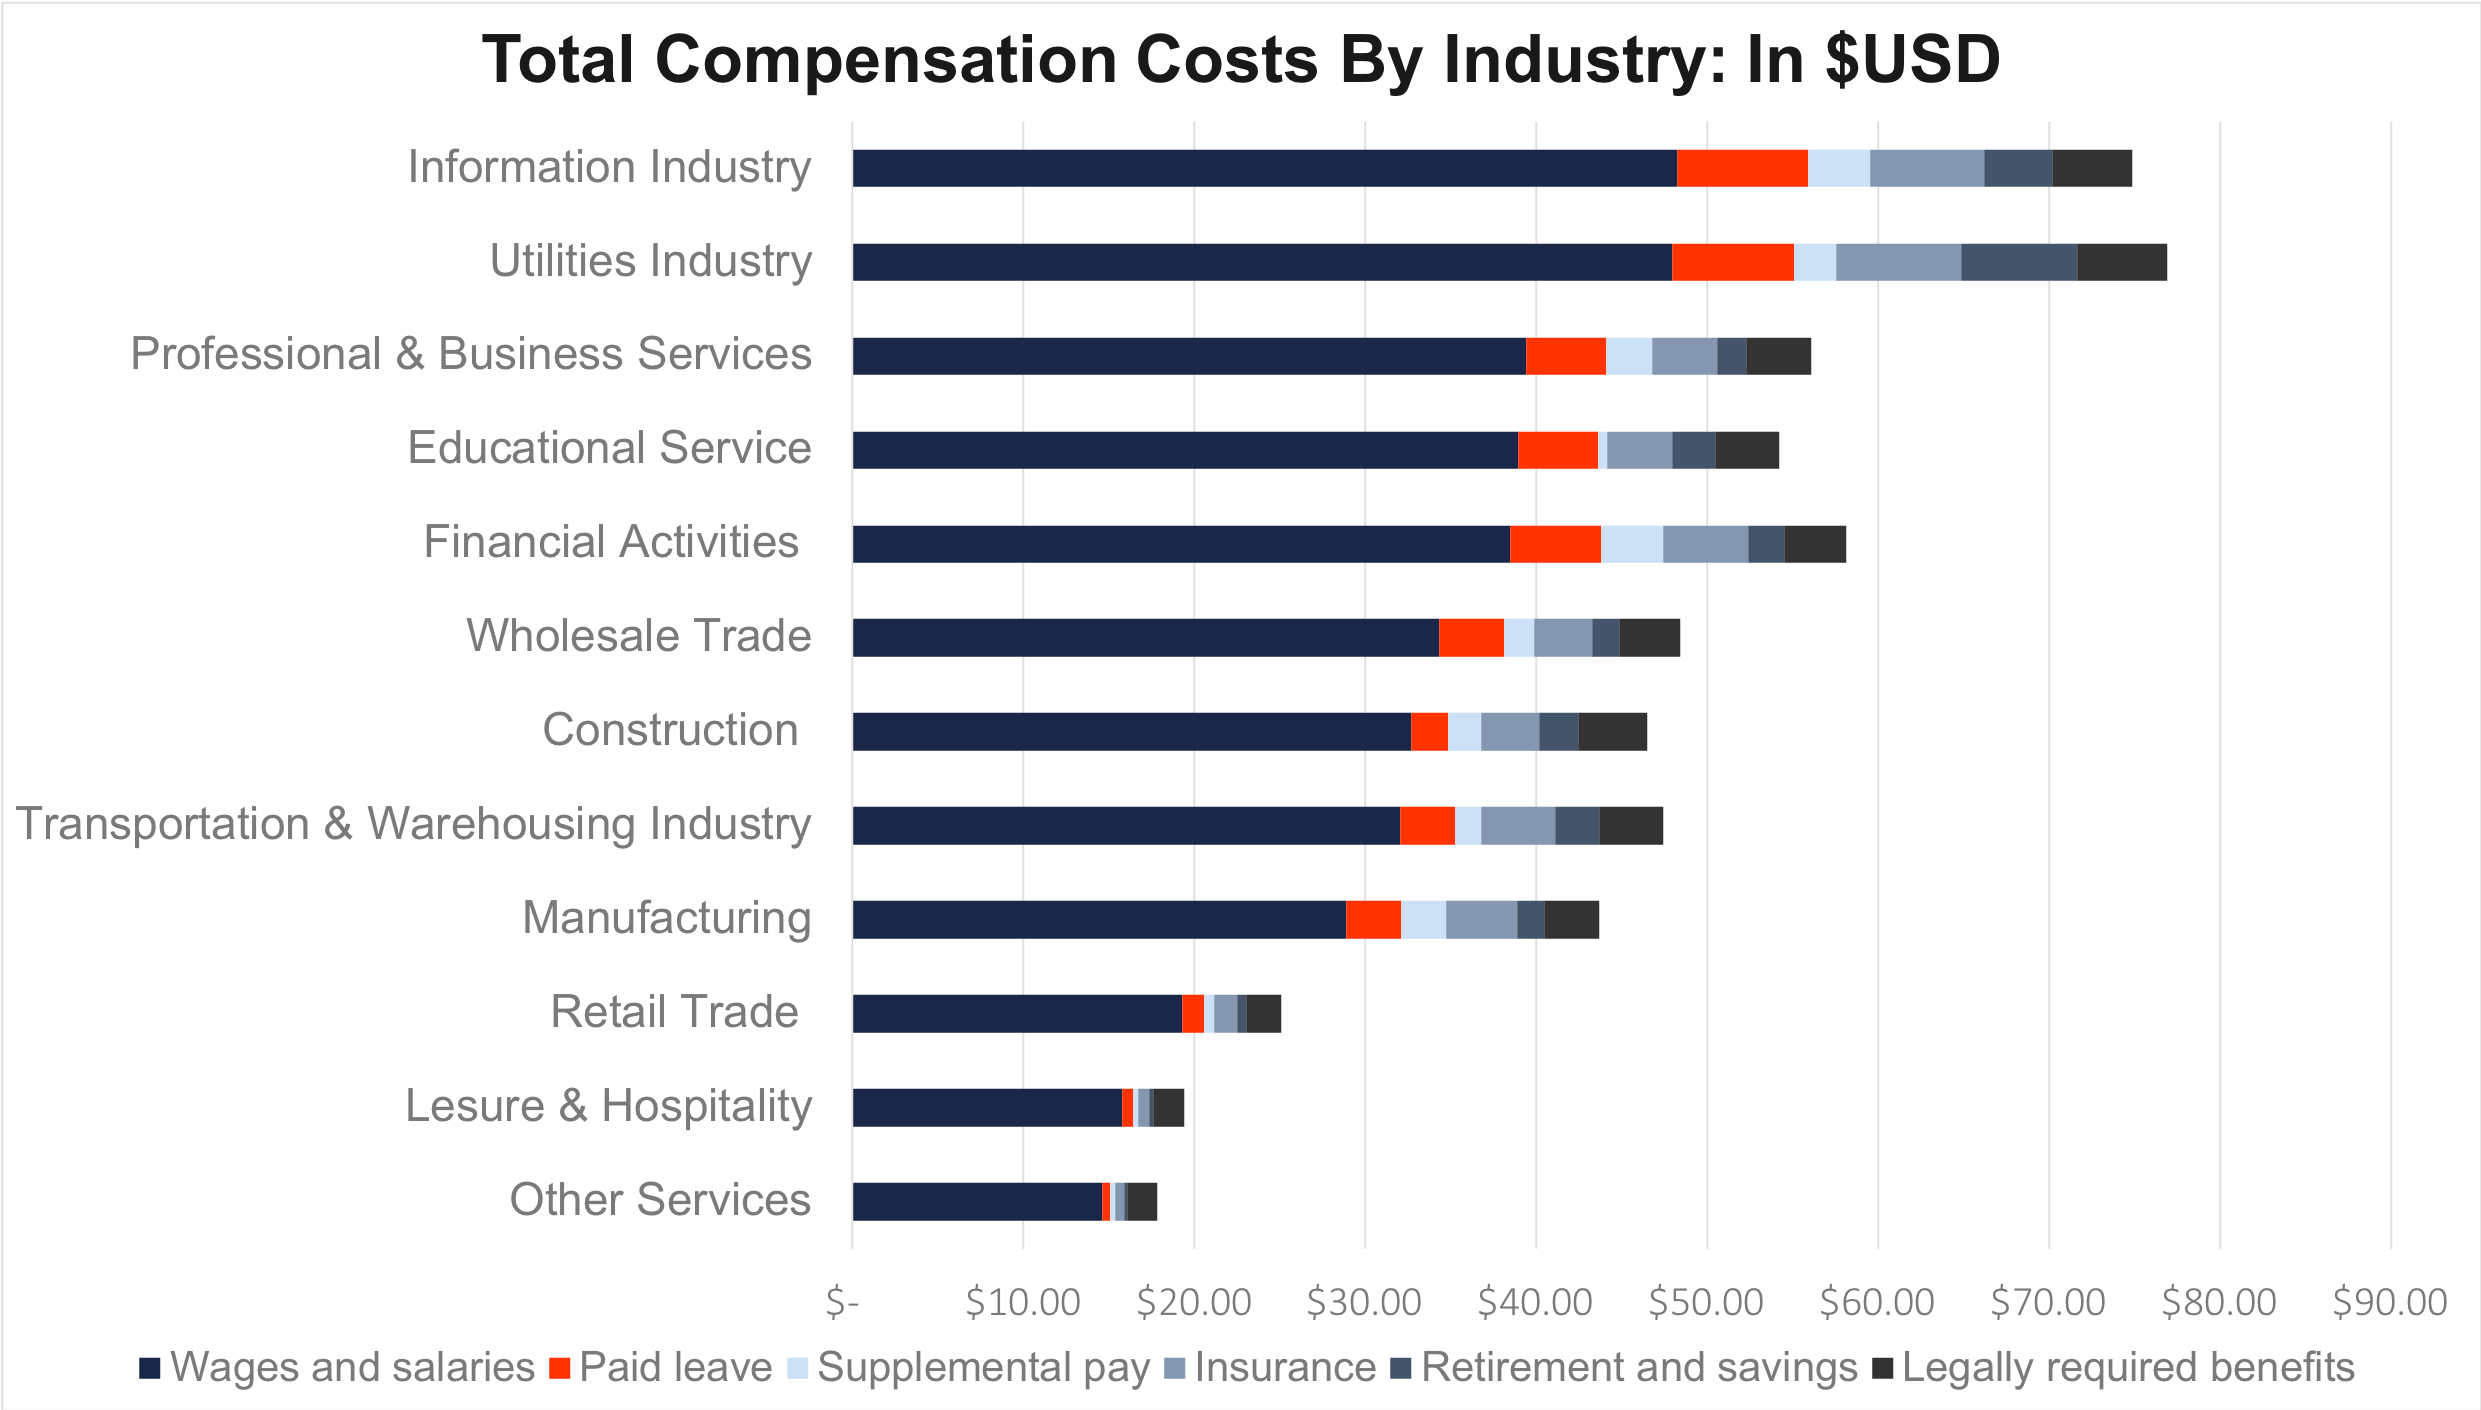
First, lets take a look by industry. As the following chart illustrates, the information industry had both the largest wage/salary expense at $48.25 per hour and the largest employee benefits expense at $26.60 per hour, for an average total compensation expense of $74.85 per employee per hour.
Despite paying a slightly lower average wage/salary expenses per employee at $47.95 than the information industry’s $48.25, the utilities industry nonetheless has the highest average hourly total employee compensation expense at $76.91 as a result of boasting the largest average hourly employee benefits expense of $28.96.
The other services industry had the lowest average total employee compensation costs of just $17.82, followed by leisure and hospitality at $19.44, and the retail industry at $25.08 before making the jump up to the manufacturing industry, which spends an average of $43.68 on employee compensation per hour.
Interestingly, despite paying the lowest wages and salaries, the other services, leisure and hospitality, and retail industries pay the largest proportion of total employee compensation in the form of wages and salaries. In short, the pay is relatively bad in these industries and the benefits are even relatively worse.
As noted above, the split between wages/salary expenses and employee benefits expenses was about 70% to 30%.
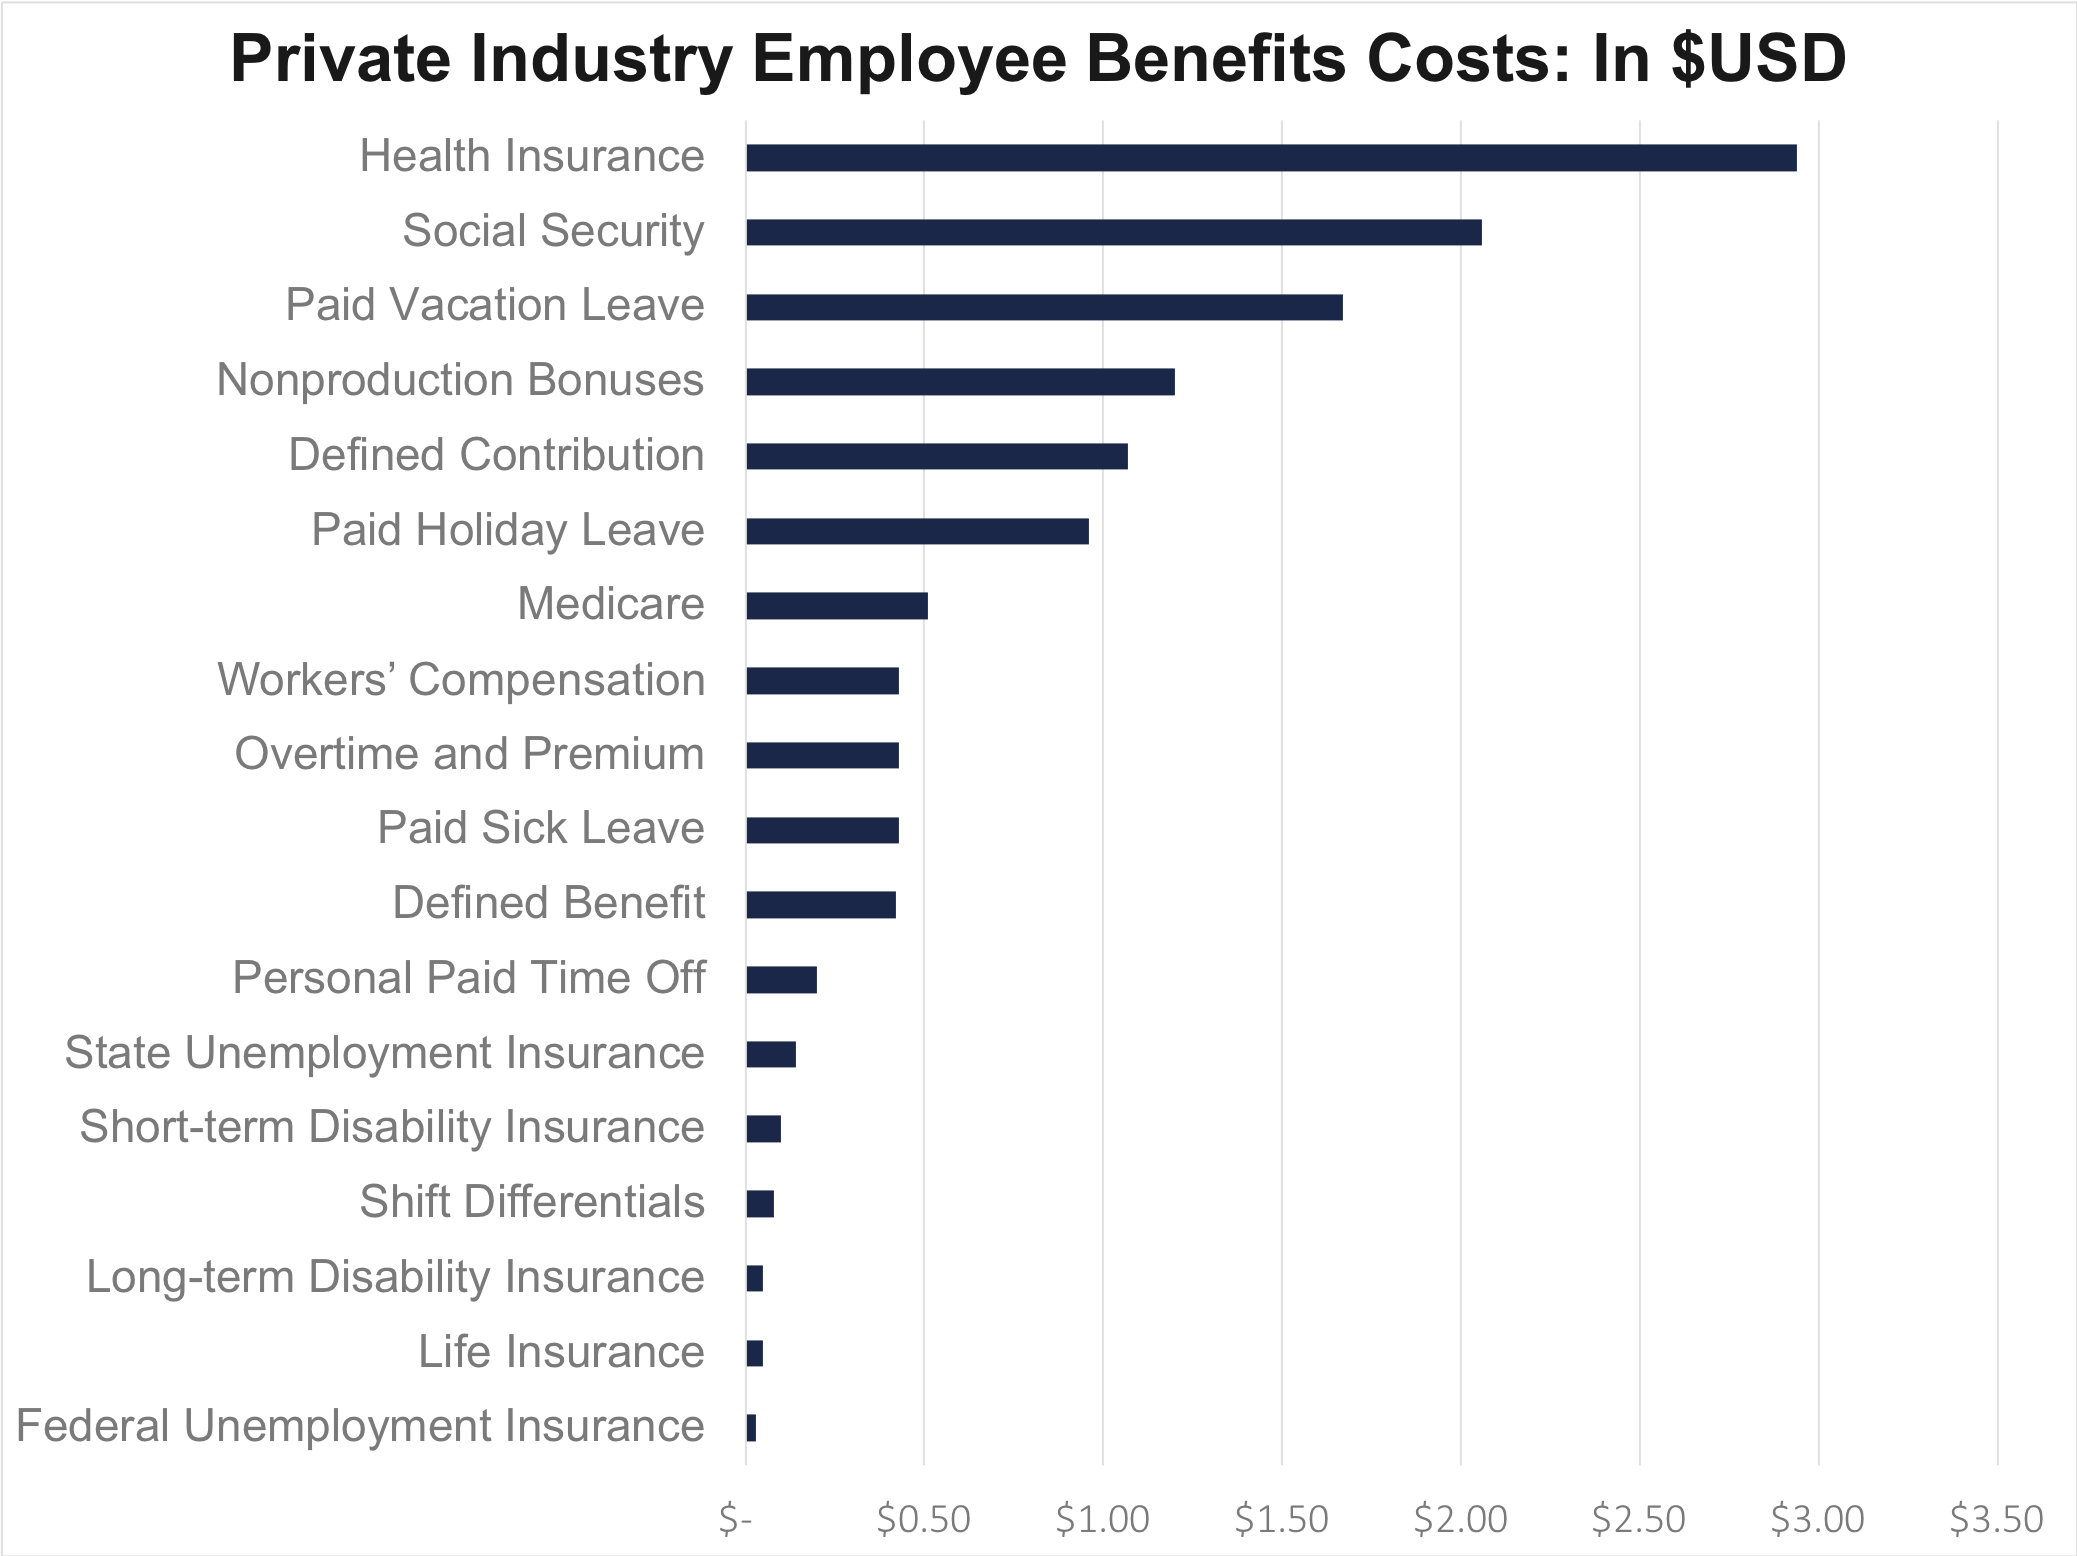
The 30% of total employee compensation expenses that went toward employee benefits can be further broken down, the largest portion of which went to health insurance of course, which cost private employers about $2.94 per hour per employee on average.
Social Security contributions were the next largest expense at $2.06 per employee per hour, followed by paid leave at $1.67, non-production bonuses at $1.20, and defined contribution benefits which cost employers an average of $1.07 per employee per hour in 2023.
Those 5 employee benefit expenses alone (totally $8.97 per employee/hour) accounted for more than 70% of the average total hourly employee compensation expense of $12.77 per hour.
The least expensive eight benefits expenditures combined to equal a little more than $1 in total cost per employee per hour, or a bit over 8% of the total average employee benefits expense.
While the list stacks up for the minor benefit offerings, with a negligible impact on cost. some of them are the most important to certain segments of employees. As noted above, the split between wages/salary expenses and employee benefits expenses was about 70% to 30%.
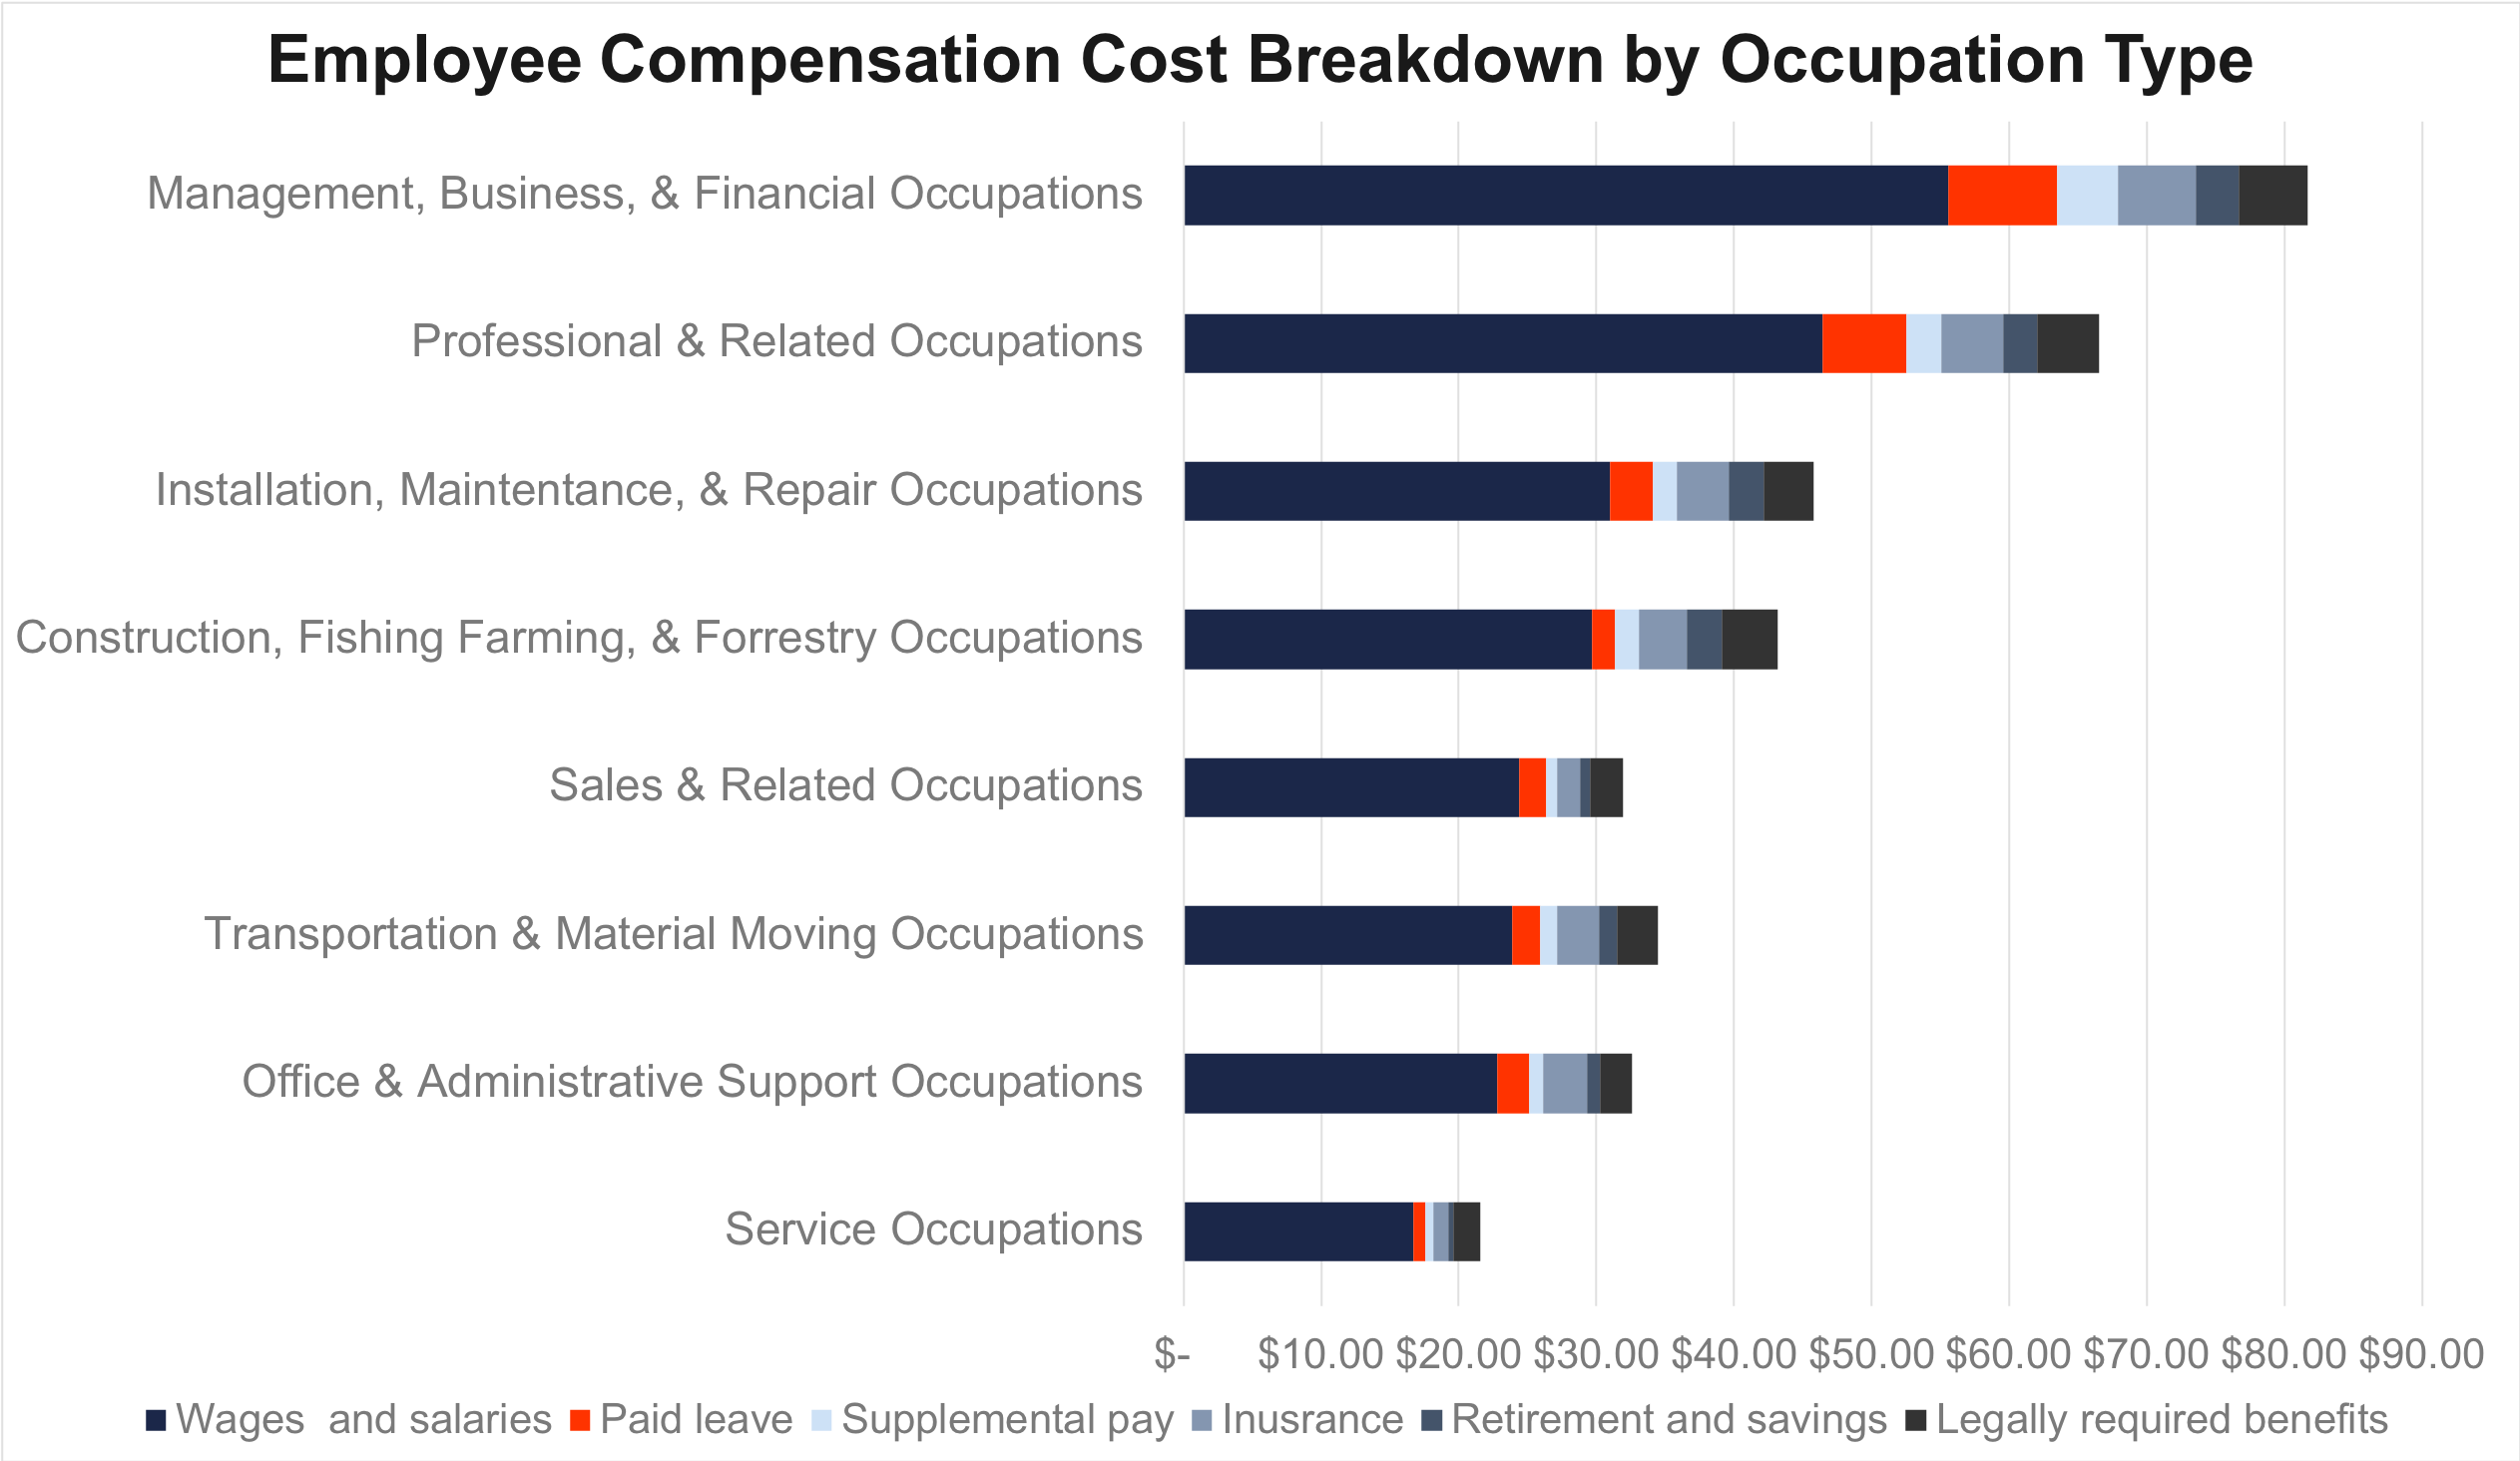
Next, lets look at the specific occupation. While workers in private industry cost their employers $43.11 per hour in total compensation expenses, those figures unsurprisingly varied quite significantly based on occupation type.
Management, business, and financial occupations had the highest average hourly compensation costs at $81.72, followed by professional and related occupations at $66.53.
Construction, fishing, farming, and forestry employees cost their employers an average of about $44.50 per hour in compensation expenses, while sales, transportation, and office and administrative employees had an average compensation expense of about $33 per hour. Service industry employees came in at the bottom of the list costing just $21.55 per hour in total compensation.
It is worth noting that the benefits expenses incurred for sales employees is surpassed by all other occupations outside service occupations, and although sales occupations pay higher wages and salaries than transportation and office/administrative jobs, transportation and office/administrative jobs are nonetheless more expensive in total compensation because of their relatively more substantial benefits offerings.
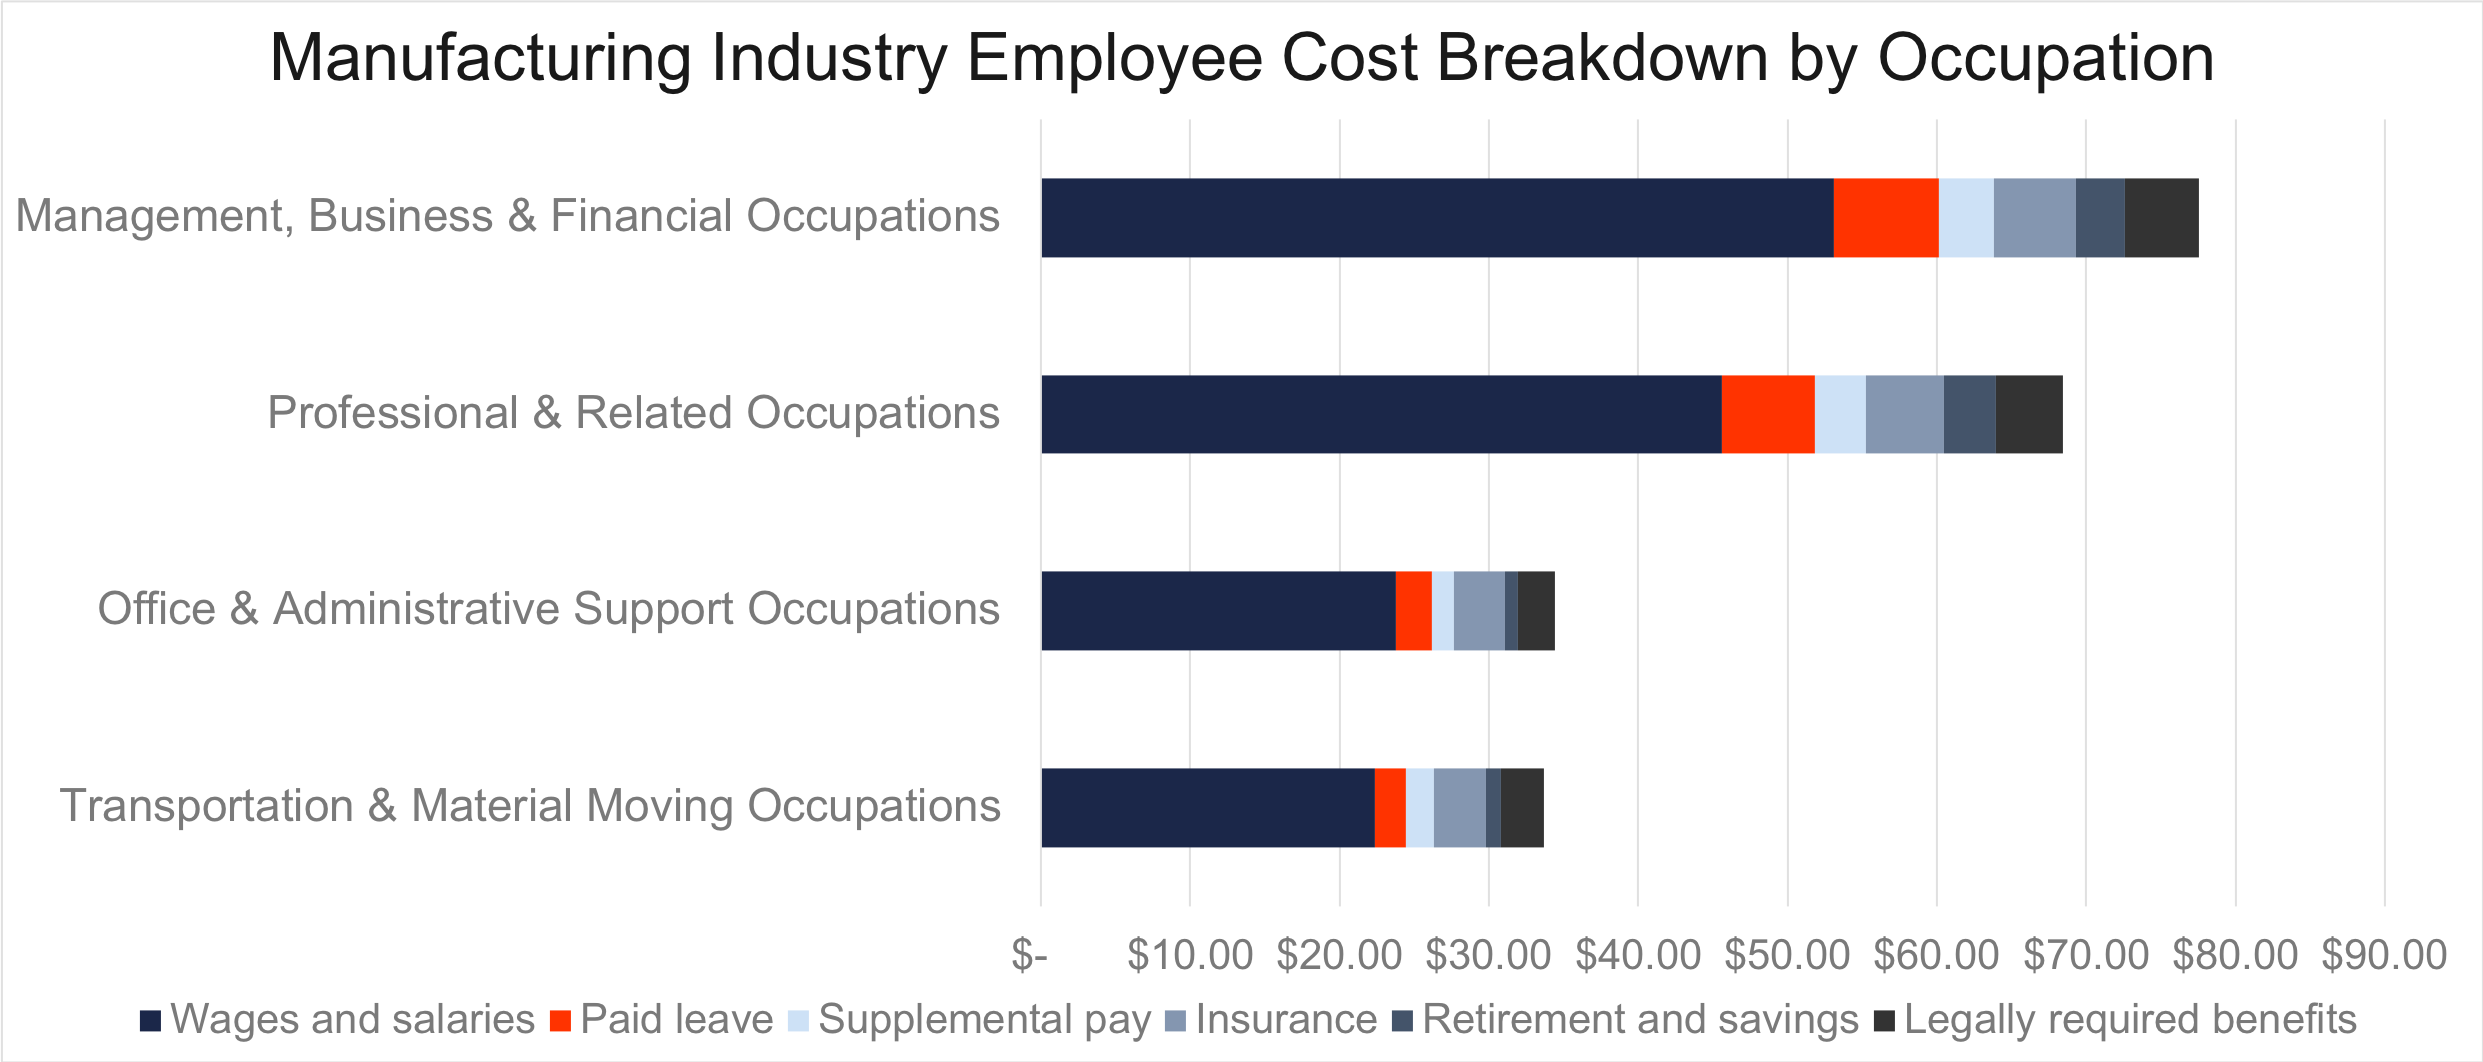
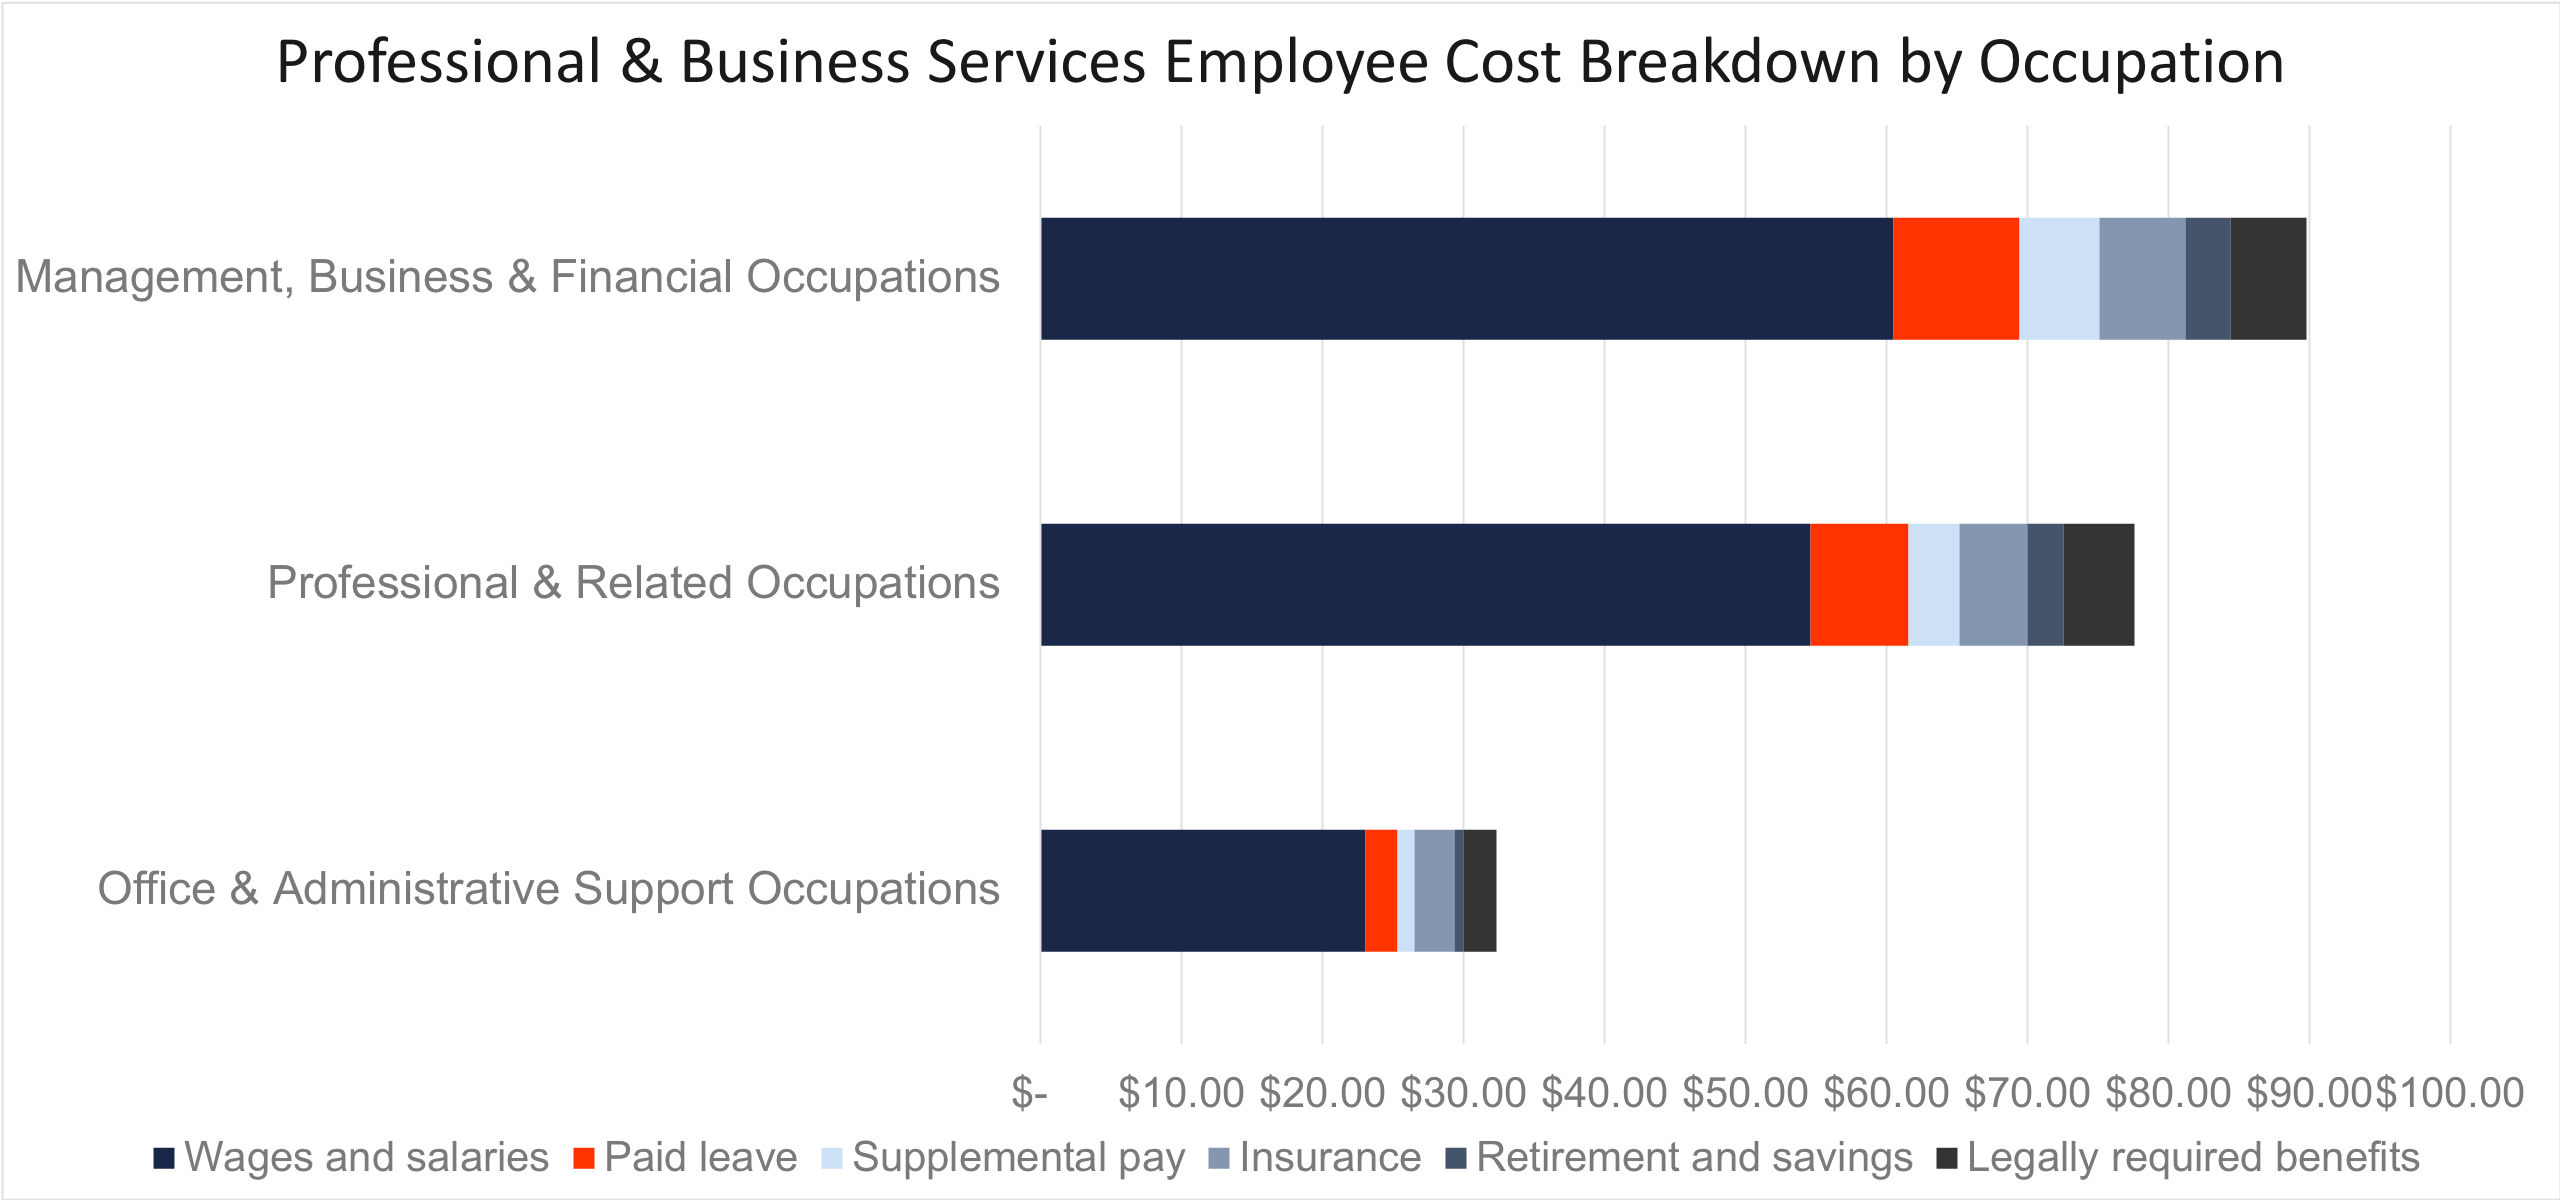
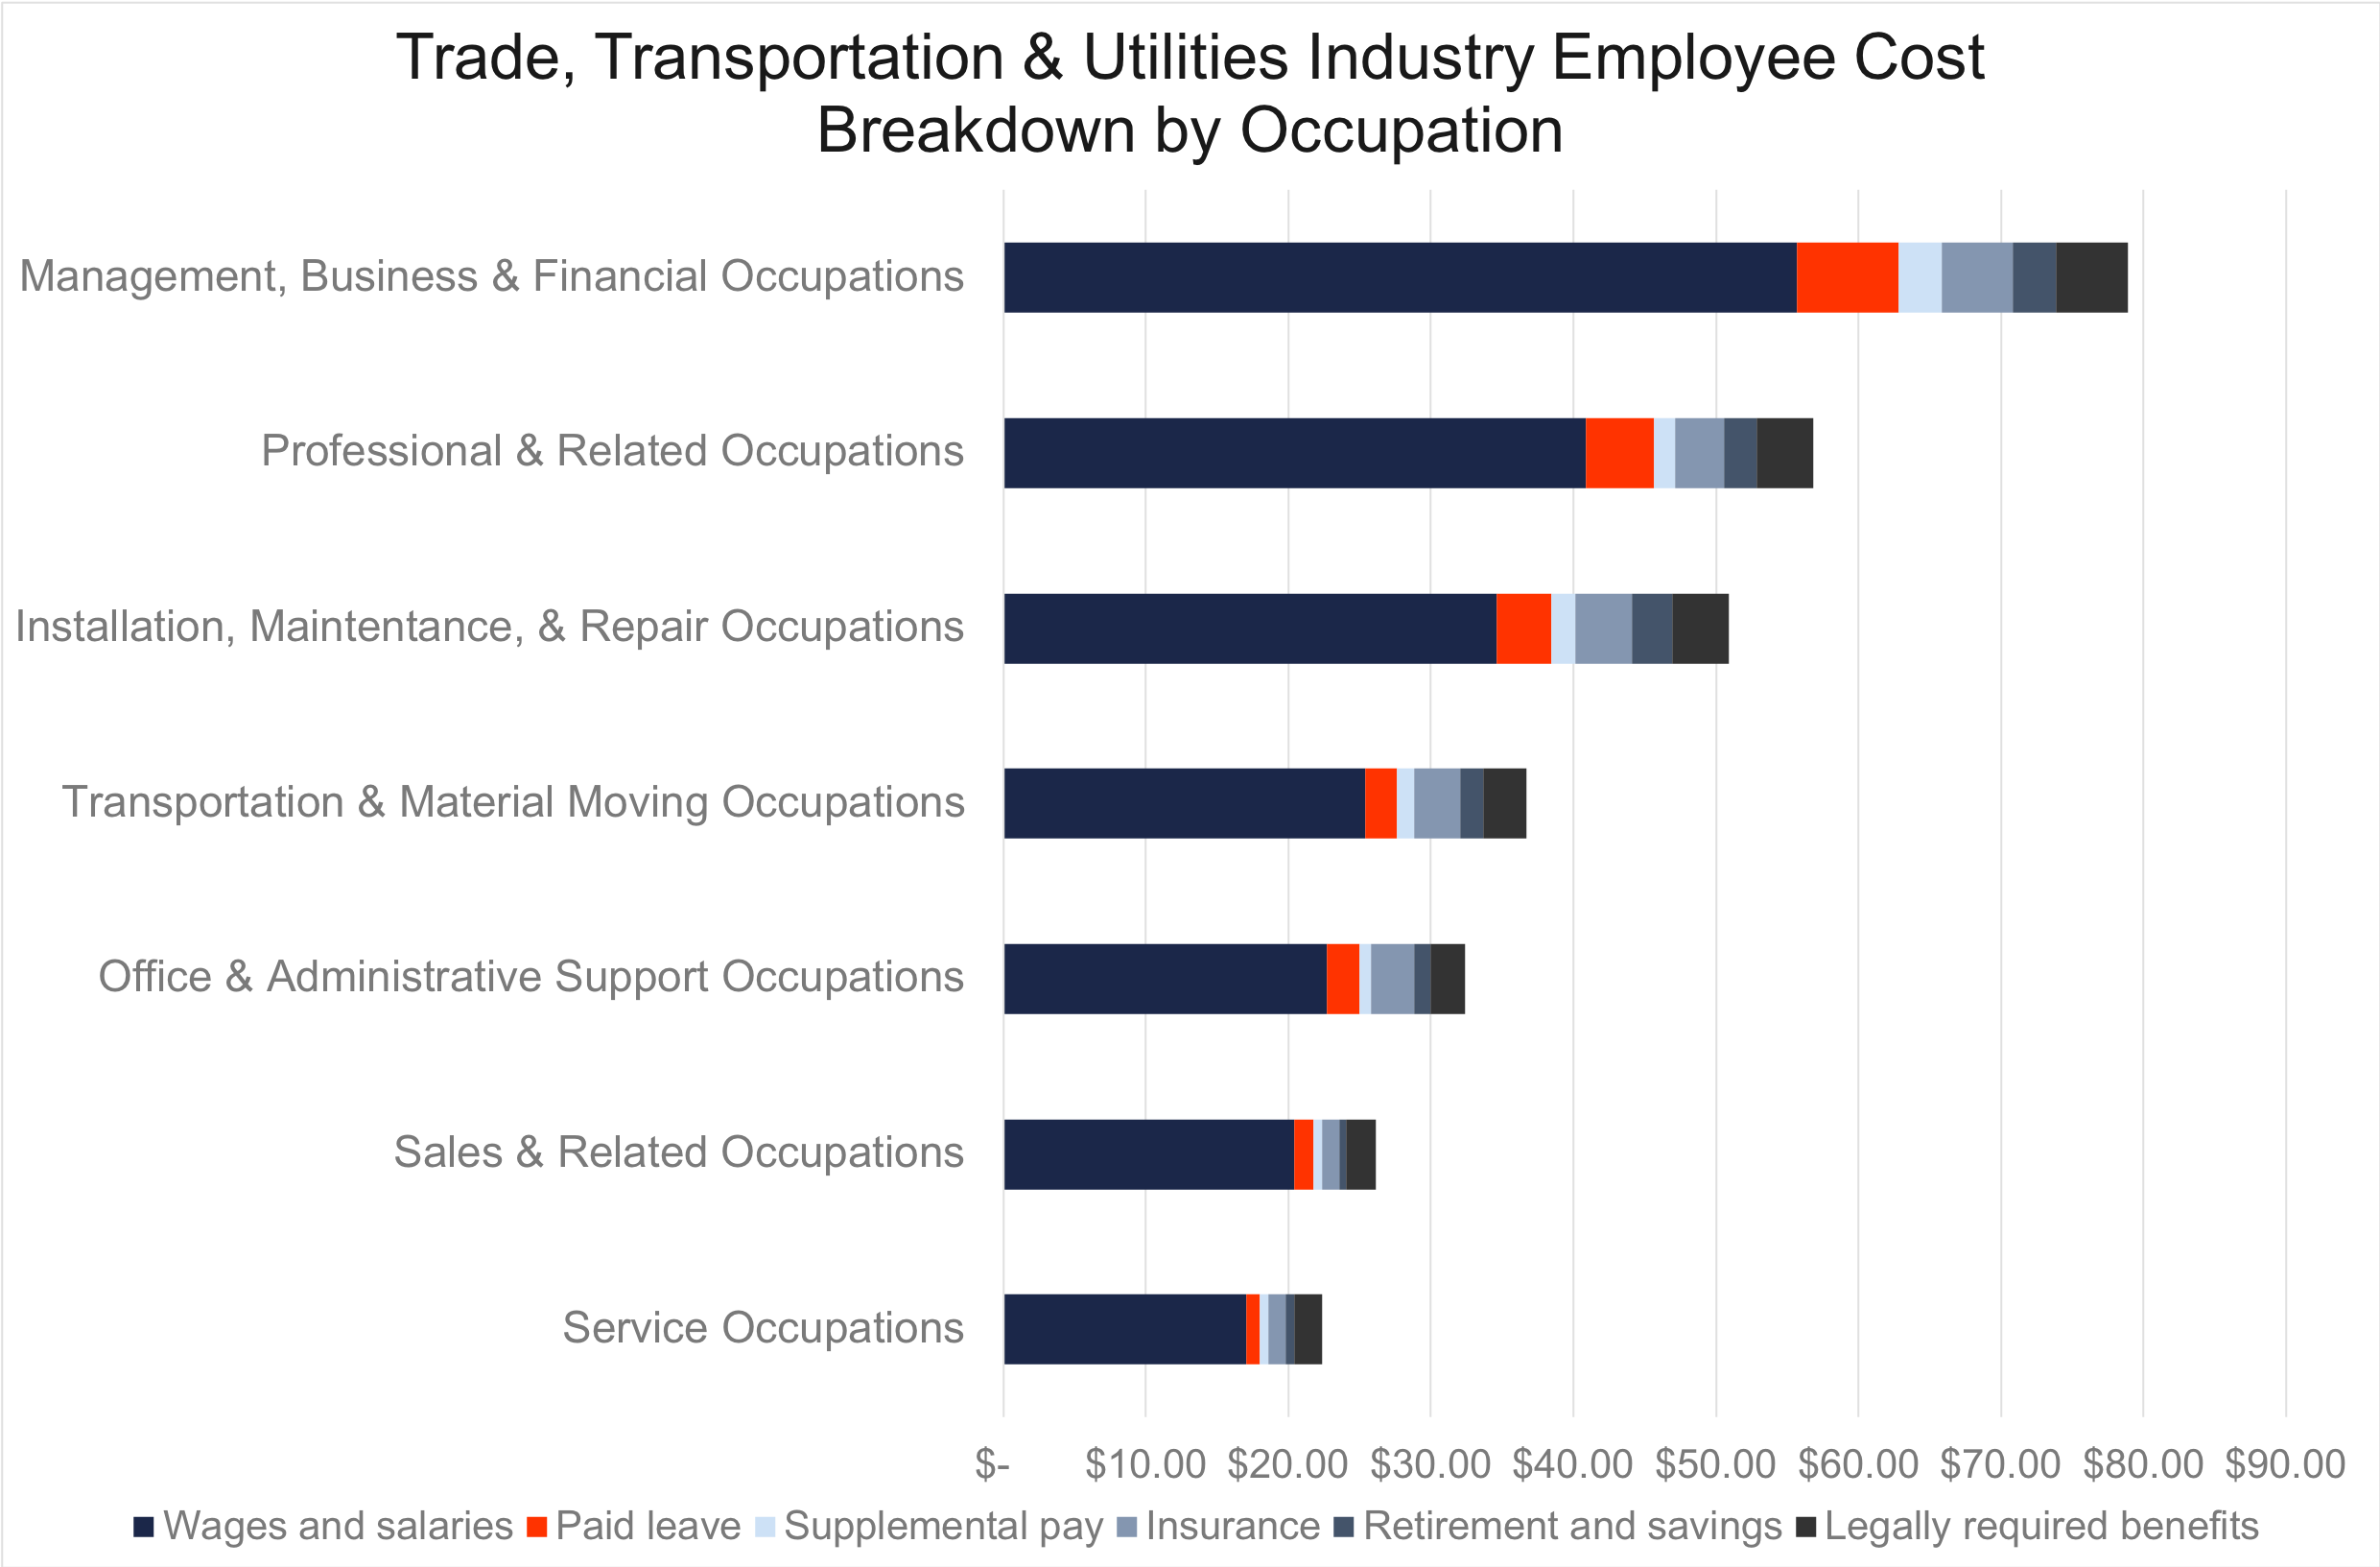
When accounting for both industry and occupation type at the same time, the combined effect that these independent factors have on average employee compensation expenses can be seen even more clearly, as in the following charts outlining employee compensation costs by industry, further broken down by occupation type.
For example, management, business, and financial jobs in the professional and business services industry cost their employers ($89.79 per hour) more than $12 more an hour in total compensation expenses than employees in the same field that work in the manufacturing industry ($77.56 per hour).
On the other hand, office and administrative support jobs compensation expenses were slightly more expensive in the manufacturing industry, albeit largely consistent across industries - $34.4 per hour in the manufacturing industry, $32.31 in the professional and business services industry, and $32.38 per hour in the trade, transportation, and utilities industries.
In a future installment, we’ll take a look at how these employee compensation expenses also vary by company size and region as well as how occupation and employee headcount combine to affect average hourly employee compensation cost.

.png)


Competing for Talent in a Constrained Market
The labor market remains highly competitive, particularly for skilled and high-performing roles. Despite some macroeconomic cooling, the structural shortage of qualified talent persists: nearly three-quarters of employers continue to report difficulty filling key positions. At the same time, employee expectations have evolved — flexibility, security, and well-being now weigh as heavily as base compensation in determining employer preference.
For most organizations, benefits represent one of the largest investments in the total rewards portfolio. Yet in practice, those investments are often under-leveraged in the recruiting process. Health coverage, retirement plans, paid time off, and wellness programs frequently appear as a brief bullet point in job descriptions or are mentioned only when an offer is extended. By that stage, the opportunity to differentiate has largely passed.
Mployer’s recent survey of more than 700 companies across 17 industries found that employers who clearly communicate the value of their benefits — and substantiate that value through credible data or recognition — are nine times more likely to be selected by candidates and to convert accepted offers. Transparency and validation drive both higher-quality applicant flow and stronger offer acceptance rates.
Transparency Converts Interest Into Action
In a competitive market, candidates are no longer applying indiscriminately. They evaluate prospective employers through publicly available information, reviews, and visible signals of value. When benefit information is vague, candidates interpret that as a risk. “Competitive benefits” have become shorthand for “average,” and uncertainty creates hesitation.
Conversely, when an organization provides a clear, quantified, and credible overview of its benefits, the dynamic changes immediately. Candidates are more willing to engage early, stay active through the interview process, and make faster, more confident decisions.
.png)
The Missed Opportunity: The Awkward Offer Conversation
In many recruiting processes today, the discussion around benefits occurs only after a verbal or written offer is made. The exchange is familiar: the candidate receives the offer, reviews the salary, and then pauses at the benefits section — uncertain whether what’s being offered is “good” or “below market.”
Recruiters often find themselves attempting to explain why the plan is competitive, citing anecdotal points about employer contributions or coverage levels. But without comparative data, the explanation sounds defensive, not differentiating. The candidate may nod politely but remain unconvinced — or worse, use the ambiguity to negotiate or delay.
At that stage, the opportunity to use benefits as a selling point has already been lost. The employer is reacting rather than leading.
In contrast, organizations that proactively communicate the strength of their benefits — in quantitative and comparative terms — enter offer discussions from a position of confidence. The candidate already understands the total value being provided and perceives the offer as comprehensive, not partial.
This is the distinction between defending your benefits and leveraging them. One undermines momentum; the other accelerates decisions.
Making Benefits a Strategic Differentiator
Leading employers are now approaching benefits communication as a core component of their talent strategy — not an HR formality. Several best practices have emerged:
These practices shorten time-to-hire, increase offer acceptance rates, and strengthen employer brand equity in measurable ways.
From Hidden Cost to Competitive Advantage
For many organizations, benefits are treated primarily as a cost center — a compliance requirement and a necessary expense. In reality, they are one of the most powerful levers available for talent attraction and retention.
When the value of those benefits is communicated with clarity, evidence, and confidence, the perception shifts. The benefits package becomes part of the employer’s market narrative — a tangible signal of how the company invests in its people.
In a tight labor market, that clarity doesn’t just help you attract candidates; it helps you close them.
How Mployer Enables Employers to Compete
Mployer helps organizations turn their benefits into a verified strategic advantage. We independently evaluate and rate employee benefit plans, comparing them across thousands of employers nationwide.
Participating organizations receive a clear assessment of how their benefits stack up against peers, along with recognition materials and benchmarking insights that can be shared directly with candidates. These assets — digital badges, comparison visuals, and concise summaries — give recruiting teams the ability to communicate benefit value credibly and consistently.
Employers across the country are already using Mployer’s data-driven validation to increase applicant volume, improve offer acceptance rates, and reinforce their reputation as employers of choice.
If you’d like to see how your benefits compare, we offer a free initial benchmark report to qualified employers. Join thousands of organizations already leveraging independent proof to strengthen their talent strategy — and move from explaining your benefits to winning with them.

In today’s hyper-competitive labor market, the fight for high-end talent has become a defining business challenge. Organizations invest significant resources into hiring and developing high- performing employees—only to lose them to competitors offering slightly higher pay or better benefits. The cost of voluntary turnover is not only financial; it disrupts operations, damages customer relationships, and erodes company culture.This white paper explores how offering market-competitive benefits—and communicating them effectively—dramatically reduces voluntary turnover. Backed by Mployer’s proprietary benchmarking and benefit rating data, we’ll show how employers that promote their benefits will experience on average 27% lower voluntary turnover each year and potentially up to 51% lower annual turnover compared to peers.
The Cost of Losing Great Talent
Every HR leader and CFO understands the financial cost of turnover—but few quantify its full scope. When an employee leaves voluntarily, costs include:
• Recruiting and onboarding new talent (often 30–50% of annual salary)
• Lost productivity during ramp-up and training
• Knowledge drain, as institutional know-how walks out the door
• Team disruption and morale impacts
• Customer relationship risks when account-facing employees depart
For specialized or customer-integrated roles, this loss compounds. A trained employee with both technical knowledge and deep integration into your teams and clients is a valuable asset—one not easily replaced. Studies show total turnover costs can exceed 1.5x–2x the employee’s annual salary for mid-level positions.
The Talent War: Competing Beyond Compensation
Across industries, the labor market remains tight. Wage competition has intensified, especially in sectors where every dollar per hour matters—manufacturing, wholesale trade, and financial services among them. Employees are increasingly willing to move for small pay increases, unless they clearly understand the total value of their benefits package.This is where benefit perception and communication become critical. When employees can see and understand the full value of what you provide—healthcare coverage, retirement matching, paid leave, mental health support—they’re less likely to be swayed by modest salary increases elsewhere. In short, benefits visibility equals retention power.
The Data: Better Benefits, Better Retention
Mployer Advisor’s analysis found that companies with highly rated benefits and effective benefits communication experience an average of 27% lower voluntary turnover than their peers. That’s a significant impact—one that directly translates into stronger productivity, reduced recruiting costs, and better workforce stability.How We Measured It: To understand how benefits quality and communication influence retention, Mployer Advisor conducted a cross-industry analysis using a blended methodology:
• Sample Group: Thousands of U.S. employers across key industries were evaluated, each with at least 50 full-time employees.
• Benefit Quality Scoring: Companies were benchmarked using Mployer’s proprietary benefit rating system, which integrates multiple data sources—including public ratings, plan benchmarking data, and employee feedback metrics.
• Communication Effectiveness: We measured not just the quality of benefits offered, but how clearly and frequently those benefits were communicated to employees through internal channels, digital materials, and recognition programs.
• Turnover Tracking: Over a 12-month period, we compared voluntary turnover rates among high-rated employers versus industry averages, focusing on trained, professional employees who had completed at least one year of tenure.The outcome was consistent and striking across every major sector: employers who both provide strong benefits and communicate them effectively retain significantly more of their trained workforce.

What this means in Practice - Let's put these numbers into context:
• Example 1: Mid-Sized Manufacturing Firm (200 Employees) Suppose a manufacturing company employs 200 workers with an annual average salary of $60,000 and a typical voluntary turnover rate of 20%. That’s 40 employees leaving each year. Replacing and retraining them at a conservative cost of 1.5× salary would total $3.6 million annually. With improved benefits communication and recognition, this firm could reduce its turnover by 44%—down to 22 separations a year—saving over $1.6 million annually in direct and indirect costs.
• Example 2: Growth-Stage Tech Company (50 Employees) A 50-person software firm might see a 25% voluntary turnover rate in a competitive labor market. Replacing those 12–13 employees could cost roughly $25,000 each in lost productivity and recruiting, totaling $300,000 per year. By improving benefits visibility and achieving results similar to the 27% national average reduction, the company could retain an additional 3–4 key employees annually—saving $75,000–$100,000 and preserving critical institutional knowledge.
The data and the dollars tell the same story: when employees both receive and recognize valuable benefits, they stay longer. Employers who treat benefits as a strategic investment—not just a line-item cost—achieve stronger retention, higher engagement, and measurable savings year over year.
Why Communication Matters as Much as the Benefits Themselves
Even the most generous benefits package fails to deliver ROI if employees don’t fully understand it. HR leaders often underestimate how little employees know about their coverage and perks. A recent survey found that:
• 46% of employees cannot accurately describe their health plan’s core benefits.
• Only 35% believe their employer communicates benefits “very effectively.”
• Yet 68% say that well-communicated benefits would increase their loyalty to the company.
Communicating benefits is no longer a once-a-year open enrollment exercise. It’s a year-round engagement effort that connects the dots between employee well-being and company investment.
Turning Benefits into a Competitive Advantage
This is where the Mployer Benefit Recognition Program makes the difference.
Through our Employer Benefit Award and recognition system, Mployer provides third-party validation that your benefits are not only competitive—but also worthy of public recognition.
Participating employers receive:
• An unbiased benefits rating benchmarked against industry peers
• A benefit summary report highlighting your strongest advantages
• Award badges and recognition toolkit providing third-party credibility for your website, social media, and recruitment materials
• Ready-to-use social media templates to promote your benefits on LinkedIn and beyond
• A visually striking award poster to display on-site, sparking employee conversations about the value of your benefits
By leveraging Mployer’s independent credibility, employers transform their benefits from a hidden cost center into a visible differentiator—enhancing recruitment, retention, and brand perception simultaneously.
Retention Starts with Recognition
In an era defined by labor shortages and rising turnover costs, the companies that win will be those that treat employee benefits not as an expense, but as a strategic investment.
The data tells the story: organizations that both offer competitive benefits and communicate them effectively enjoy up to half the turnover rates of their peers. Recognition, transparency, and consistent messaging are key to helping employees see the true value of what you provide.
Your workforce is your most valuable asset. Make sure they know how much they’re worth.
Learn more or see if your company qualifies for an Employer Benefit Award by visiting Mployer.

The modern labor market is defined by choice. In this competitive landscape, the time it takes to fill a critical position—your Time to Fill (TTF)—has become a painful metric. TTF measures the days between when a job is posted and when an offer is accepted, and every extra day costs your business. These are not just abstract numbers; they are tangible losses: decreased productivity from overburdened teams, halted projects, missed revenue targets, and increased recruiting fees (Source 1).
The solution to a high TTF doesn't lie solely in higher base salaries or aggressive sourcing. It lies in your benefits package.
Exceptional benefits are no longer a perk; they are the most efficient talent acquisition strategy to drastically reduce TTF. By treating your benefits package as a competitive differentiator, you can accelerate candidates through the hiring pipeline faster, saving thousands in the process.

The Attraction Phase: Benefits as a Candidate Magnet
In the crowded digital space, a candidate's first interaction with your company is often filtering for what matters most to their life. This is where your benefits package first accelerates the process.
Filter Efficiency and Signal Quality
Candidates actively use benefit offerings as a primary search filter on major job boards. By offering superior benefits, your role gains instant visibility among highly qualified candidates who are explicitly looking for employer support.
Furthermore, a robust benefits package serves as a powerful signal quality indicator. It immediately tells a prospective hire that your company is stable, healthy, and genuinely employee-first. This signals a positive company culture, immediately making your job more attractive than competitors offering standard, minimal coverage.
High-Value Benefits That Reduce Hesitation
Focusing on benefits that address major life stressors can dramatically shorten a candidate’s initial hesitation and application decision. High-perceived-value benefits like generous Paternity and Maternity Leave policies, comprehensive Mental Health Coverage, and practical Flexible Work Arrangements (Hybrid/Remote) instantly elevate your offer. These concrete; life-changing benefits are far more persuasive than a generic promise of a "competitive salary."
The Conversion Phase: Benefits as a Negotiation Accelerator
Once you find a great candidate, the negotiation phase is where Time to Fill often stalls. Strong benefits act as rocket fuel, accelerating the offer acceptance and minimizing costly, time-consuming back-and-forth.
Reducing Offer Time
When an offer is extended, a truly compelling benefits package often results in candidates accepting the first offer. They don't feel the need for lengthy counter-offers focused solely on base salary because the total value is already overwhelming.
A clear, well-articulated benefits statement in the offer letter minimizes follow-up questions, builds trust, and speeds up the decision-making process. The certainty and value provided by the benefits act as an irresistible closing tool.
Framing the Total Compensation Advantage
To fully leverage this advantage, your HR team must be trained to frame the discussion around Total Compensation Value. Show candidates how elements like a 100% 401(k) match, fully-funded health insurance options, or student loan repayment programs can easily surpass a perceived $5,000 difference in base salary.
When candidates are weighing multiple offers, the company that provides the most security, flexibility, and value outside of the paycheck will significantly shorten the candidate's decision time, often securing the top talent before competitors can react.
The Long-Term Ripple Effect on TTF
The benefits ROI doesn't stop once the offer is signed. A strategic benefits package initiates a powerful, long-term ripple effect that fundamentally lowers your overall vacancy rate and future TTF.
Boosted Employee Referrals
Happy employees are your best and fastest source of talent. When staff are genuinely satisfied with their compensation and benefits (especially high-value items like Sabbatical programs or generous PTO), they become powerful advocates. This satisfaction increases the likelihood of employees referring high-quality candidates, who are typically onboarded faster because of the pre-vetted nature of the relationship. Referral hires are consistently the fastest and cheapest source of talent for any organization.
Lower Turnover Rate
Ultimately, a high TTF is often symptomatic of high employee turnover. Strong benefits increase employee retention, meaning you have fewer open jobs to fill in the first place. Since TTF is calculated using both the vacancy rate and the duration of those vacancies, better benefits effectively tackle both components simultaneously.
Quantifying the Benefits: TTF vs. Public Perception
The impact of your benefits is no longer limited to the candidates you interview; it's public. When candidates research a company, they immediately consult public review platforms like Glassdoor. These platforms link candidate sentiment directly to your hiring efficiency.

Mployer’s recent analysis of 300 companies and over 2,000 open roles during a 120-day period revealed a critical connection between public sentiment and hiring speed. We compared organizations with exceptionally high Glassdoor benefit ratings (a key proxy for positive external perception) against those with mid-to-lower ratings. The result was a dramatic acceleration in the hiring funnel: for companies with top-tier benefit ratings, the average Time to Fill (TTF) was just 19 days, compared to 27 days for their counterparts—a significant 32% reduction in hiring time. While this trend was most pronounced among smaller organizations (like local businesses to mid-market firms), large global corporations (including Samsung, Morgan Stanley, and GE) demonstrated the same efficiency gain, affirming the universal impact of a strong benefit-based Employer Value Proposition.
Companies with an "Excellent" or "Above Average" benefit rating (4.0+ stars on Glassdoor, for example) consistently report a Time to Fill that is 15-20% shorter than industry peers with "Average" or "Poor" benefit ratings (Source 2). This efficiency is driven by the immediate credibility and trust built before the candidate even submits an application. A strong public rating reduces the need for the candidate to perform extensive due diligence, further accelerating the initial application phase.
Enhanced Employer Brand
A consistently excellent benefits package strengthens your overall Employer Value Proposition (EVP). This enhanced brand, which is now supported by public data, naturally improves all future recruiting efforts by attracting passive candidates who have been watching your company’s reputation grow.
Conclusion: The Investment That Pays for Itself
The takeaway is clear: investing in market-leading benefits doesn't cost money; it saves money by drastically reducing the tangible costs associated with lengthy vacancies, high recruiting fees, and low productivity.
Benefits act as an accelerant across all three critical phases of hiring: they Attract more candidates, convert them faster, and ensure their Retention, fueling a steady stream of future referral hires.
Action Item: Review your current benefits package through the lens of a prospective, top-tier candidate. Where can you add immediate, high-impact value? The race for talent is won by the company that makes the quickest, most compelling offer—and that starts with great benefits.
To gain a competitive edge and identify your specific TTF acceleration points, benchmark your offerings today. See how your benefits stack up against industry peers through a free, unbiased rating: Visit https://mployeradvisor.com/employer-rating
Sources

.svg)


.svg)
.svg)
.svg)