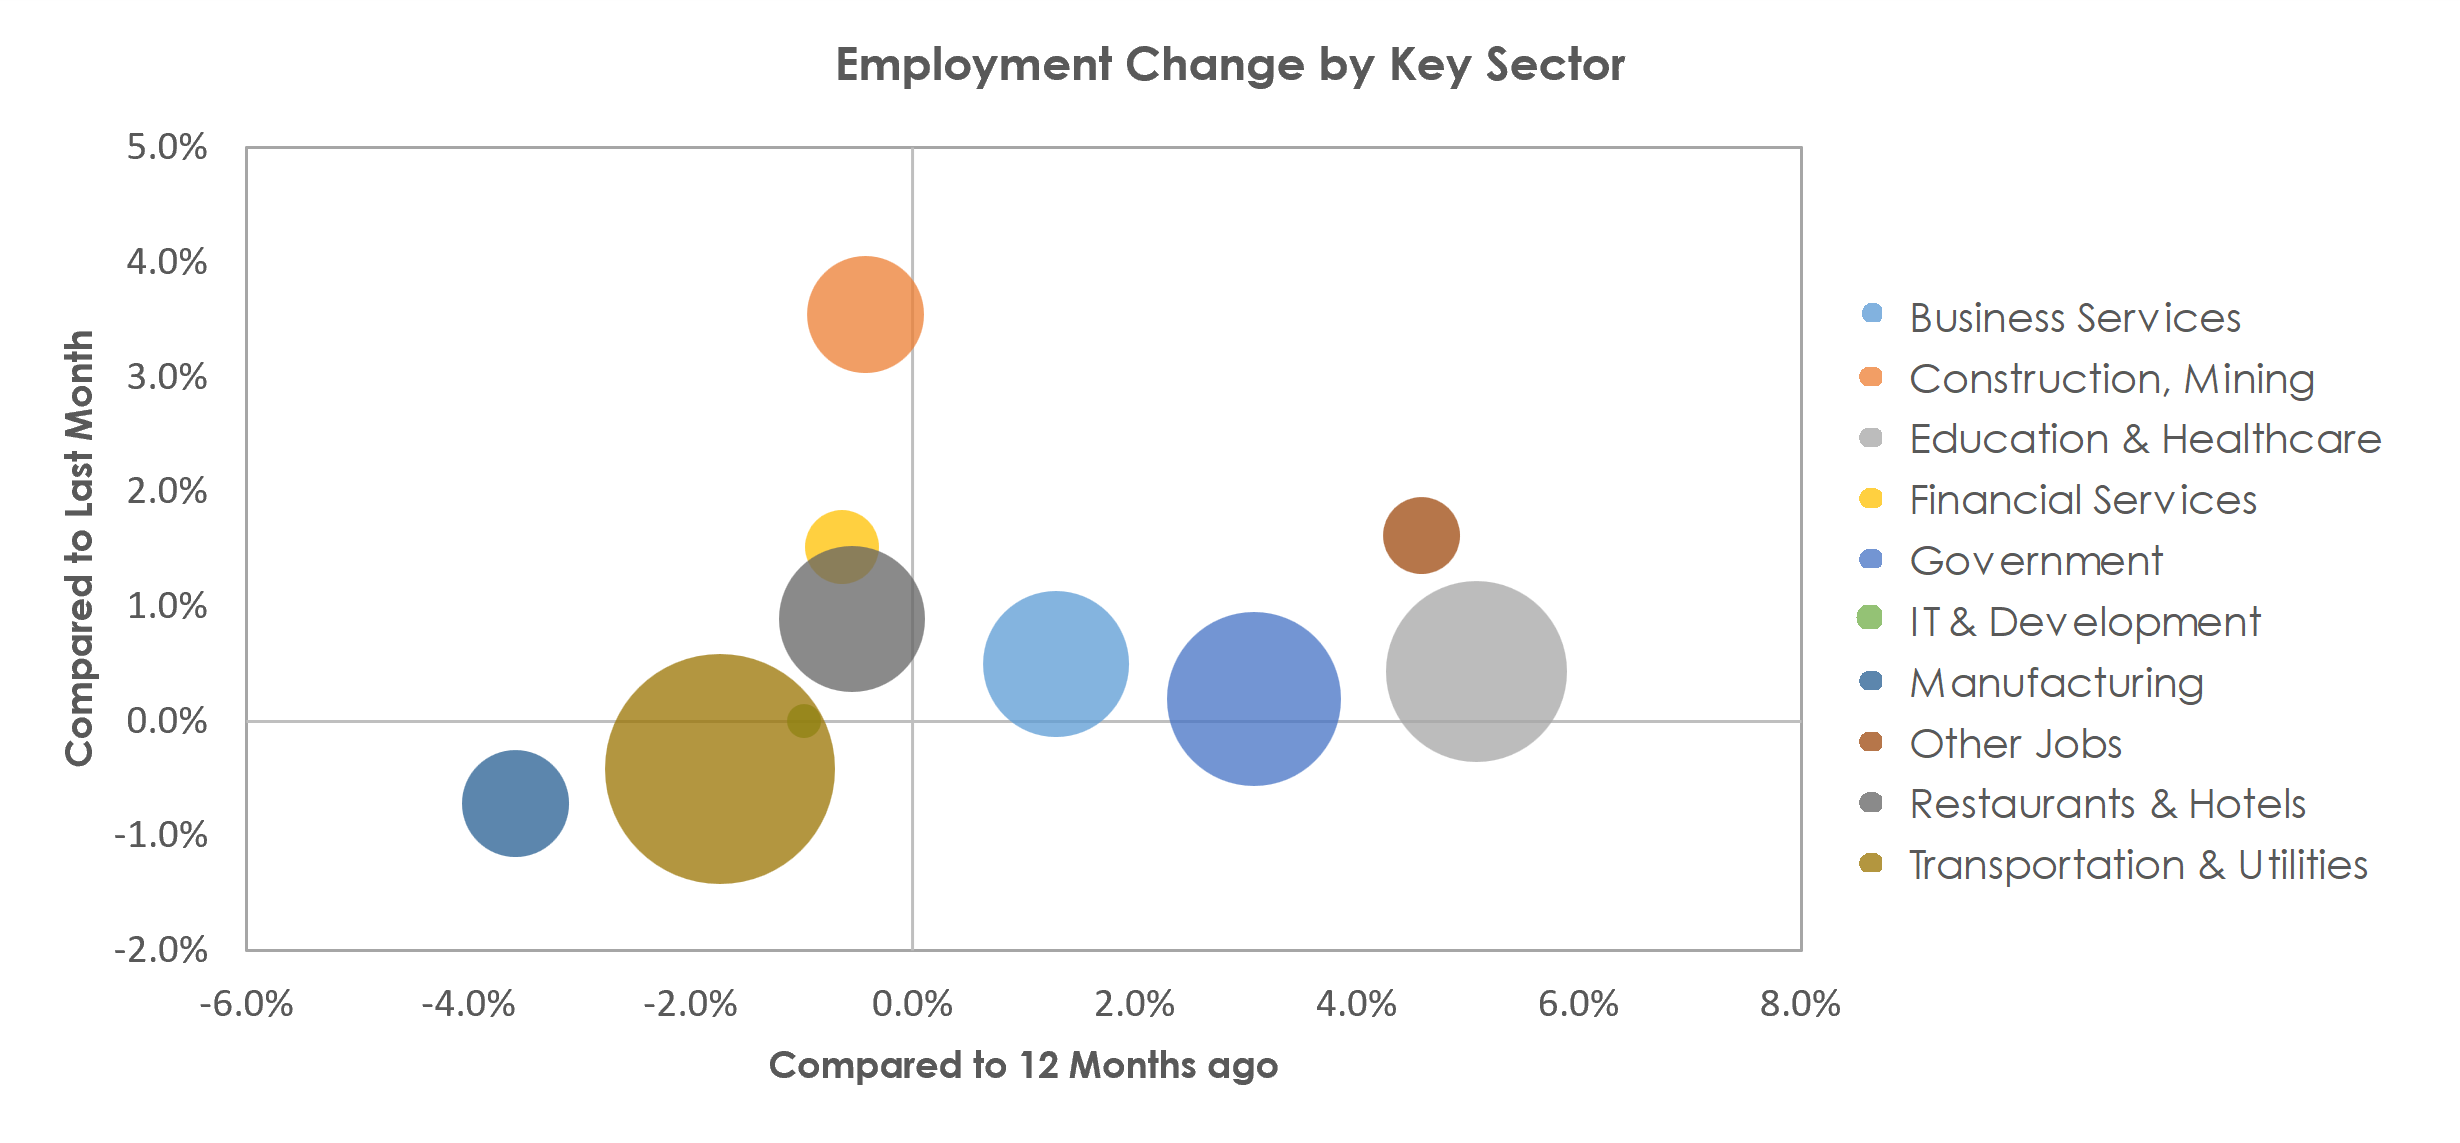
Overall unemployment rate moved down to 4.1% with the biggest shift in Construction, Mining, which gained 4,000 roles, based on the most recently available information published in June 2023.
Total employment in the Riverside-San Bernardino-Ontario, CA market declined by 19,415 jobs in April and the unemployment rate decreased compared to the prior month by 50 bps to 4.1%. The national unemployment rate decreased by 53 bps over the same time to 3.1%.
- Riverside-San Bernardino-Ontario, CA unemployment rate is 100 bps above the national rate which is a negative sign.
- Unemployment in the market is 40 bps above the unemployment rate in the market last year at this time, which is a negative.
- Average wages (per hour) grew in April versus prior month by 6.4% and are up compared to last year at this time in the market.
For key employment segments of the market, total jobs grew by 0.4% . Key sectors include:
- Transportation & Utilities: 452,700; -1,900
- Education & Healthcare: 277,300; +1,200
- Government: 258,200; +500
- Restaurants & Hotels: 181,200; +1,600
- Business Services: 181,000; +900
- Construction, Mining: 116,700; +4,000
- Manufacturing: 97,100; -700
- Other Jobs: 50,200; +800
- Financial Services: 46,800; +700
- IT & Development: 10,100; no change
Data is based on the most recent 12 months available, through April 2023 (Data published June 2023 and reports created on June 8,2023). Source: Government data agency and locally acquired statistics.
Note: All reported data is not seasonally adjusted.

