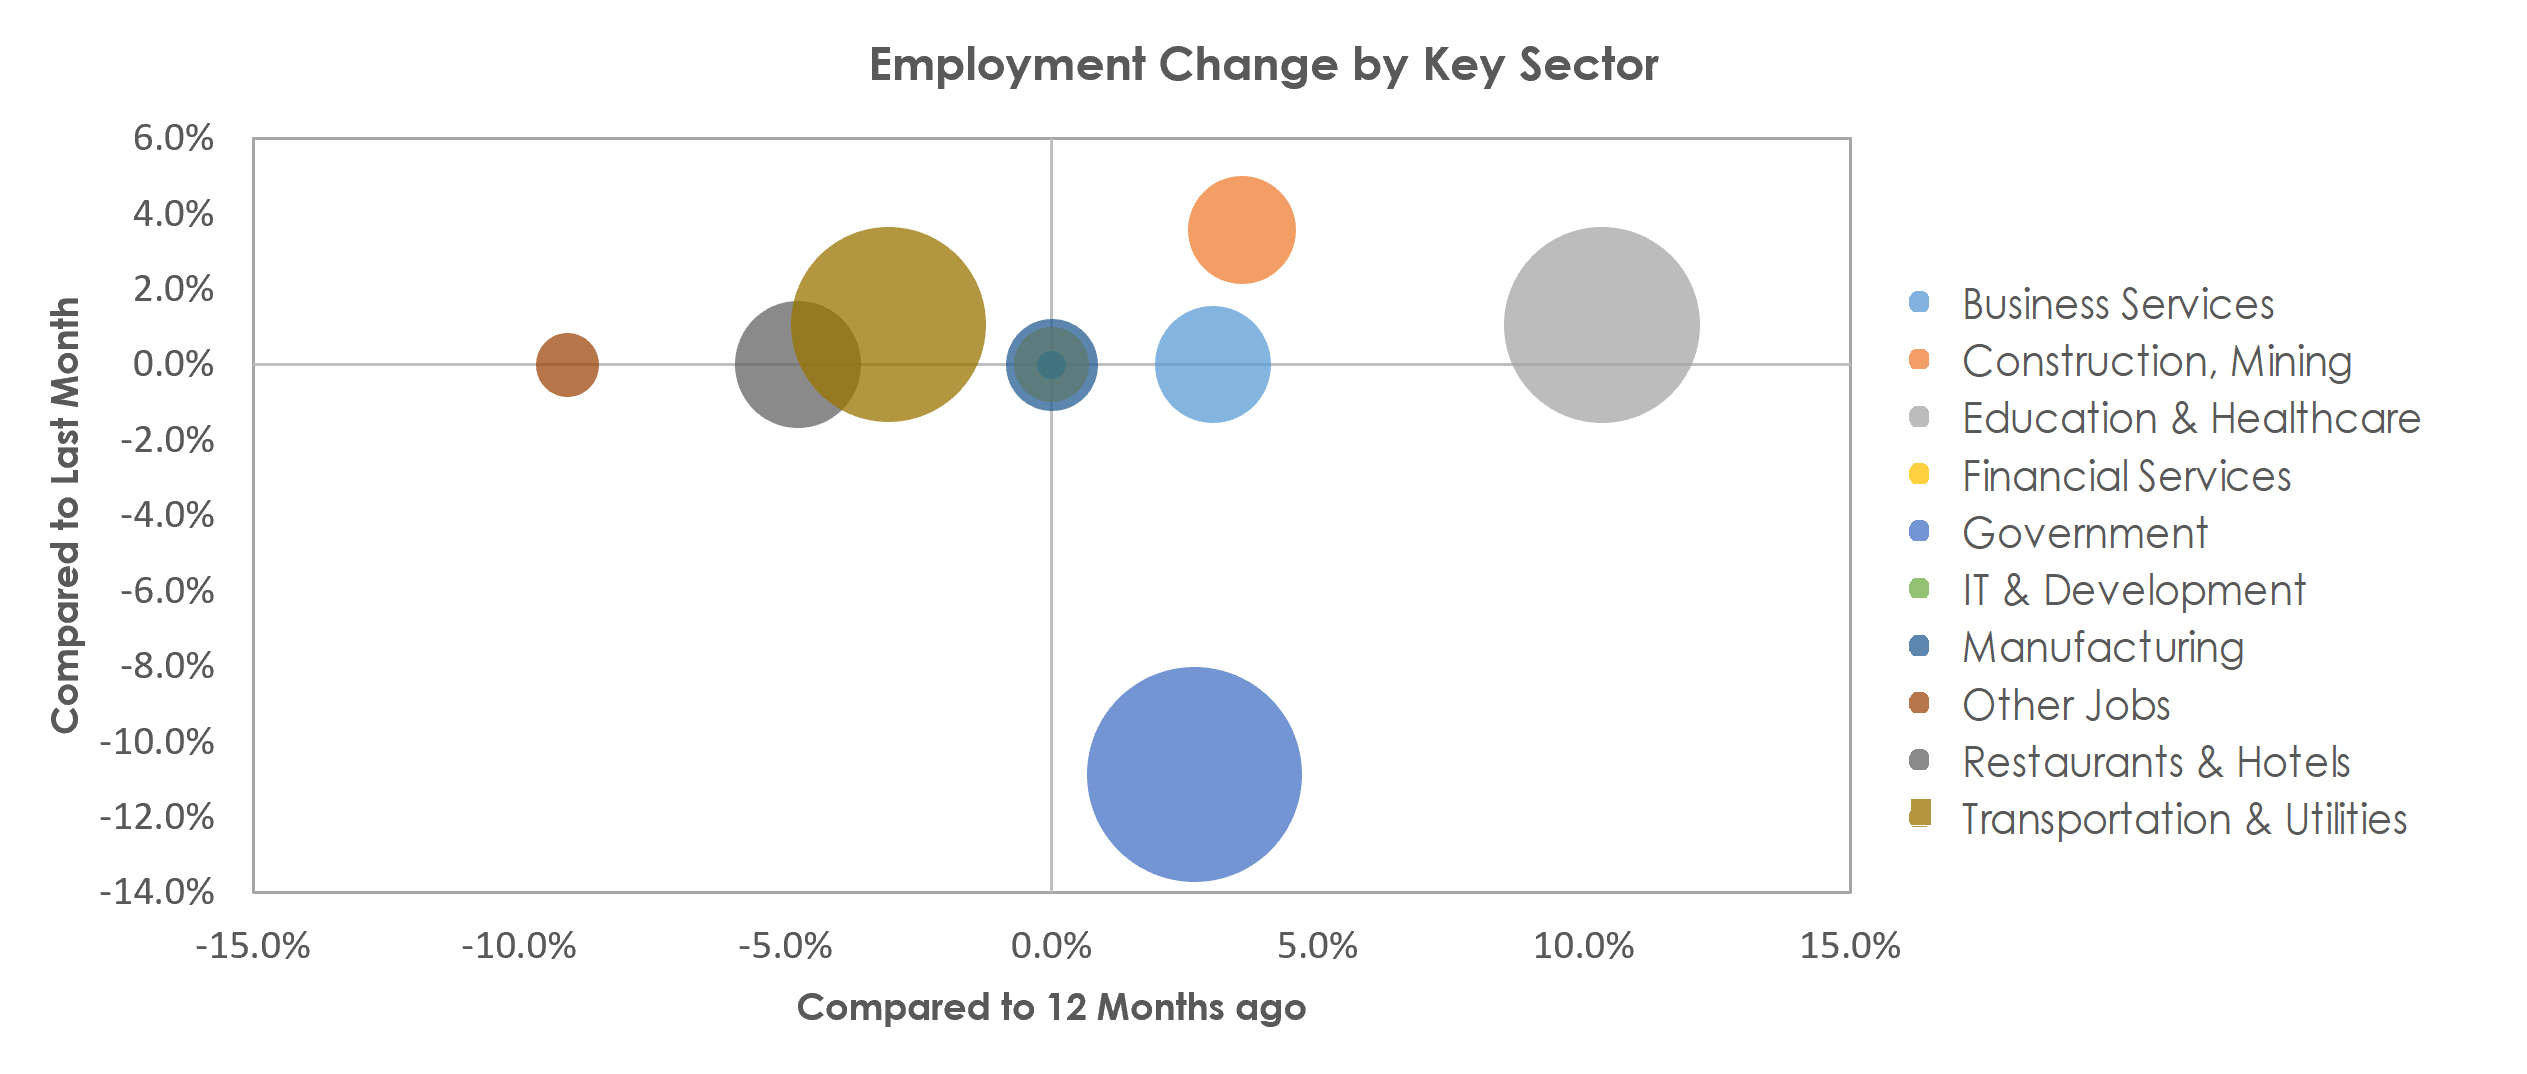
Overall unemployment rate moved down to 8.6% with the biggest shift in Government, which lost 1,400 roles, based on the most recently available information published in September 2021.
Total employment in the Yuba City, CA market rose by 565 jobs in July and the unemployment rate decreased compared to the prior month by 40 bps to 8.6%. The national unemployment rate decreased by 43 bps over the same time to 5.7%.
- Yuba City, CA unemployment rate is 294 bps above the national rate which is a negative sign.
- Unemployment in the market is 330 bps below the unemployment rate in the market last year at this time, which is a positive.
- Average wages (per hour) grew in July versus prior month by 4.6% and are up compared to last year at this time in the market.
For key employment segments of the market, total jobs declined by -2.4%. Key sectors include:
- Government: 11,500; -1,400
- Education & Healthcare: 9,600; +100
- Transportation & Utilities: 9,500; +100
- Restaurants & Hotels: 4,000; no change
- Business Services: 3,400; no change
- Construction, Mining: 2,900; +100
- Manufacturing: 2,100; no change
- Financial Services: 1,400; no change
- Other Jobs: 1,000; no change
- IT & Development: 200; no change
Data is based on the most recent 12 months available, through July 2021 (Data published September 2021 and reports created on September 1, 2021). Source: Government data agency and locally acquired statistics.
Note: All reported data is not seasonally adjusted.

